MEMBERS ONLY

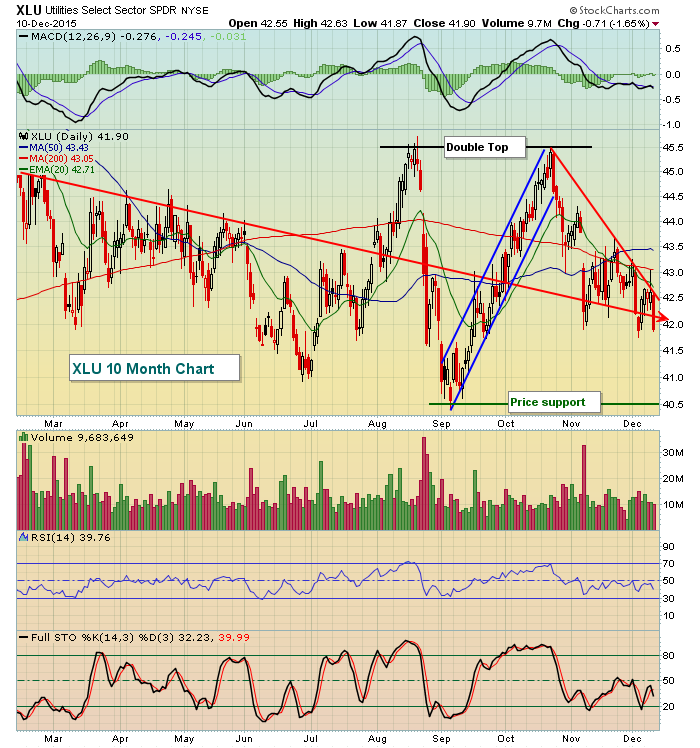
FED RAISES SHORT-TERM RATE A QUARTER POINT WITH DOVISH COMMENT -- DIVIDEND PAYING REITS AND UTILITIES LEAD REBOUND -- AT&T LEADS TELECOM HIGHER -- S&P CLEARS MOVING AVERAGE LINES -- VIX FALLS BACK BELOW 20

by John Murphy,
Chief Technical Analyst, StockCharts.com
UTILITIES AND REITS JUMP... The Fed raised short-term rates a quarter point as expected, but softened the move with a dovish statement. Shorter-term yields in the two to five-year range are moving higher. Stocks are trading higher on the Fed move. The biggest gainers, however, are rate-sensitive stocks that pay...
READ MORE
MEMBERS ONLY

Small Caps Complete 12-year Top Relative To Large Caps

by Martin Pring,
President, Pring Research
* Bullish exhaustion on Monday suggests that last week’s lows will hold during 2015
* Longer-term indicators continue to point to an overall topping out process
* Small caps break down against large caps
* 30-year yield at a critical juncture
* Euro and yen-denominated gold complete large bearish (deflationary) formations
Small year-end rally...
READ MORE
MEMBERS ONLY

Article Summaries: 6-2015 to 8-2015

by Greg Morris,
Veteran Technical Analyst, Investor, and Author
Most blog authors on StockCharts.com are writing about the current markets and do an exceptional job. I do not write about the current markets as I wanted to share my experiences after 40+ years as a technical analyst. Not only experiences with trading and investing, but model building and...
READ MORE
MEMBERS ONLY
Traders Bid Up Shares Ahead of Fed Decision

by Tom Bowley,
Chief Market Strategist, EarningsBeats.com
Market Recap for Tuesday, December 15, 2015
Energy and financials were the leaders in Tuesday's rally as all nine sectors gained ground, supporting the market's two day rally. Given the significance of today's Fed decision which will likely produce the first interest rate hike...
READ MORE
MEMBERS ONLY
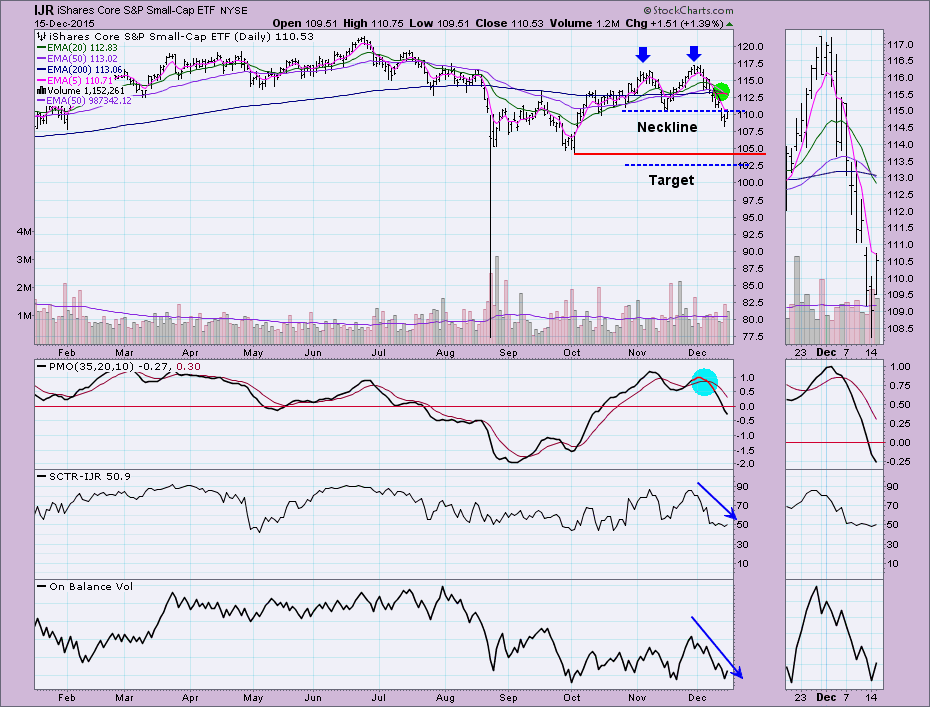
S&P 600 ETF (IJR) Moves to Official Bear Market

by Erin Swenlin,
Vice President, DecisionPoint.com
Despite today's rally, the S&P 600 ETF (IJR) logged a new Long-Term Trend Model SELL signal. This moves IJR officially into a bear market. The Long-Term Trend Model generates a SELL signal when the 50-EMA crosses below the 200-EMA. DecisionPoint Analysis considers any stock, index, ETF,...
READ MORE
MEMBERS ONLY
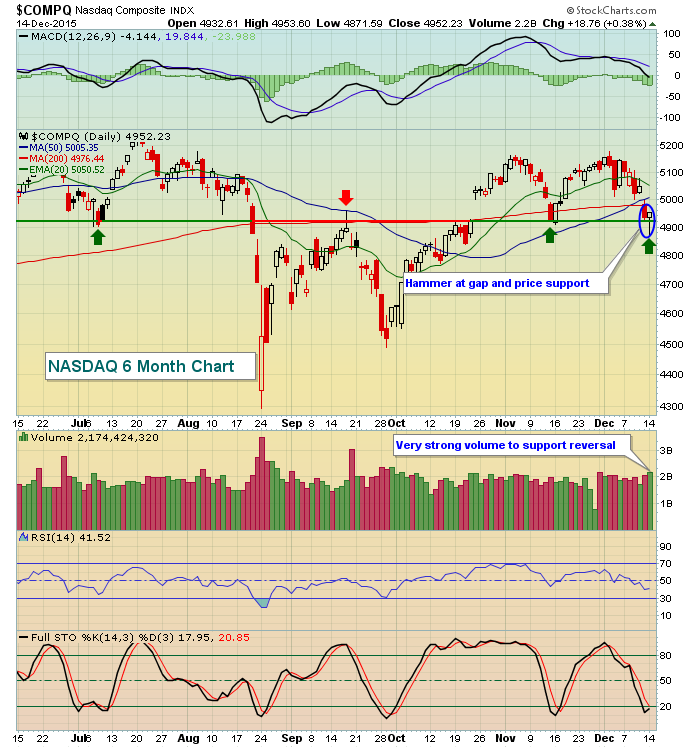
NASDAQ Prints Bullish Hammer At Price Support
by Tom Bowley,
Chief Market Strategist, EarningsBeats.com
Market Recap for Monday, December 14, 2015
Eight of the nine sectors finished higher on Monday as the U.S. stock market made a case for a near-term bottom. We know the middle of December tends to turn in favor of the bulls and there were plenty of kick saves...
READ MORE
MEMBERS ONLY
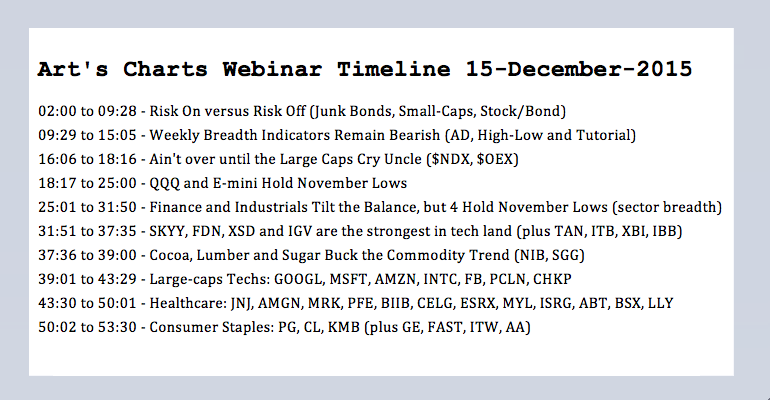
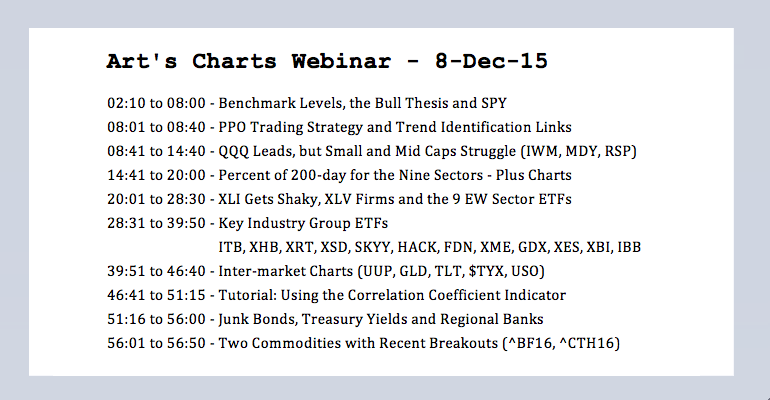
Emini Holds 2K - QQQ Still Leads - Weekly Breadth Indicators - Webinar Recording

by Arthur Hill,
Chief Technical Strategist, TrendInvestorPro.com
E-mini Tests 2000 Again // QQQ Holding above November Low // Small, Mids and Equals Extend Suffering // Weekly Breadth Indicators Remain Bearish // Finance and Industrials Tilt the Balance // Webinar Topics ////
Pockets of Strength?
The evidence for the broad stock market turned bearish last week and there are clearly some big pockets of...
READ MORE
MEMBERS ONLY
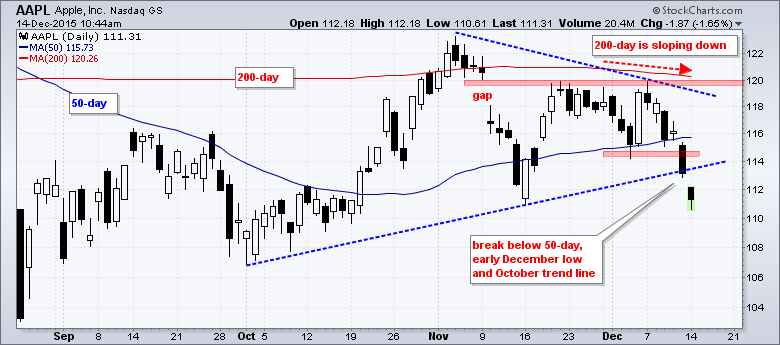
Apple Fails at One Moving Average and Breaks Another
by Arthur Hill,
Chief Technical Strategist, TrendInvestorPro.com
Apple shows signs of a long-term downtrend because it failed at a key long-term moving average and just broke a medium-term moving average. The daily candlestick shows AAPL gapping down in early November, trying to fill that gap with a bounce in mid November and ultimately failing with a peak...
READ MORE
MEMBERS ONLY
What does a stock with an RS-Momentum value of 105 equate to in respect of time?

by Julius de Kempenaer,
Senior Technical Analyst, StockCharts.com
Last week I received a question from a StockCharts.com user on RRG charts via e-mail. Usually, I try to answer such questions in 1-1 fashion by replying to the particular email. Most of the time this involves pointing to information on Relative Rotation Graphs that is already present in...
READ MORE
MEMBERS ONLY
High Volatility Equals Impulsive Bouts Of Selling
by Tom Bowley,
Chief Market Strategist, EarningsBeats.com
Market Recap for Friday, December 11, 2015
Friday was a very rough day for U.S. equities on a number of fronts, but the most obvious was the approximate 2% loss that each of our major indices sustained. In my Friday blog article, "Futures Tank, Bears Have A Big...
READ MORE
MEMBERS ONLY
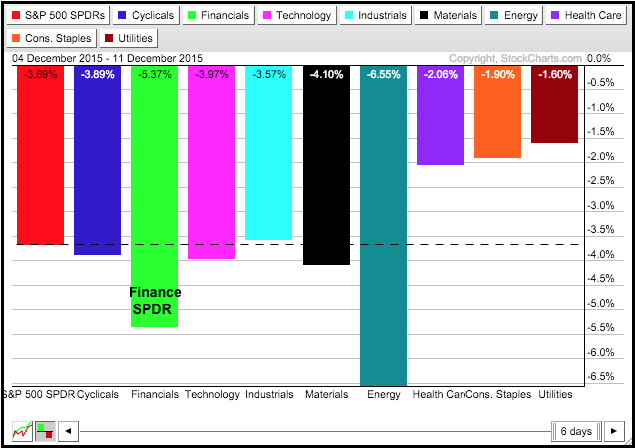
Finance Weighs - SPY/QQQ Trend Filters - Seasonality and Oversold Conditions
by Arthur Hill,
Chief Technical Strategist, TrendInvestorPro.com
Finance Weighs with Sharp Decline // SPY and QQQ Trend Filters Still Bullish // Seasonal Patterns Point to Bottom This Week // Mind the Gap and Short-term Downtrend ////
Finance Weighs with Sharp Decline
There were some medium-term and long-term bearish developments last week, but the stock market could bounce because it is short-term...
READ MORE
MEMBERS ONLY

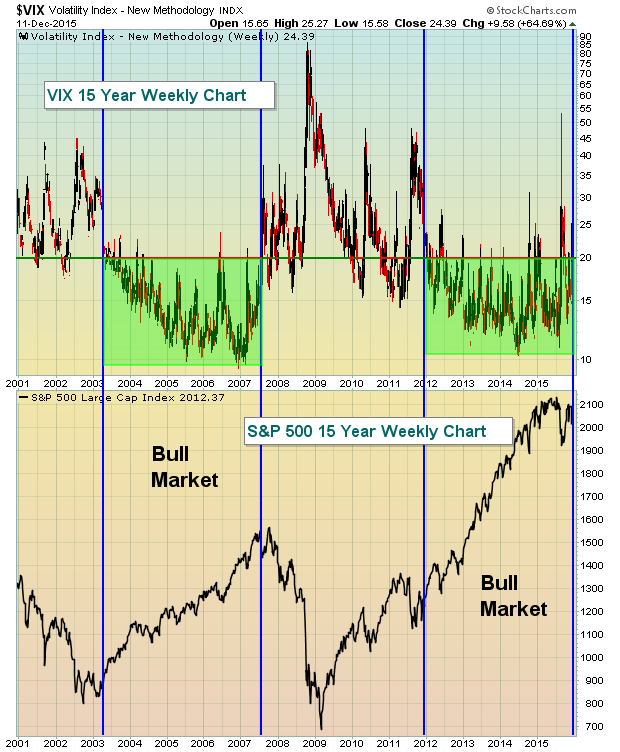
Volatility Now Becomes Bulls' Enemy #1
by Tom Bowley,
Chief Market Strategist, EarningsBeats.com
Conditions changed on Friday and the short-term market prospects grew significantly riskier. Why? Because in addition to price support breakdowns across many key indices, sectors and industry groups, the volatility index ($VIX) spiked 26% on Friday to close at 24.39. Historically, the 20 level on the VIX has carried...
READ MORE
MEMBERS ONLY
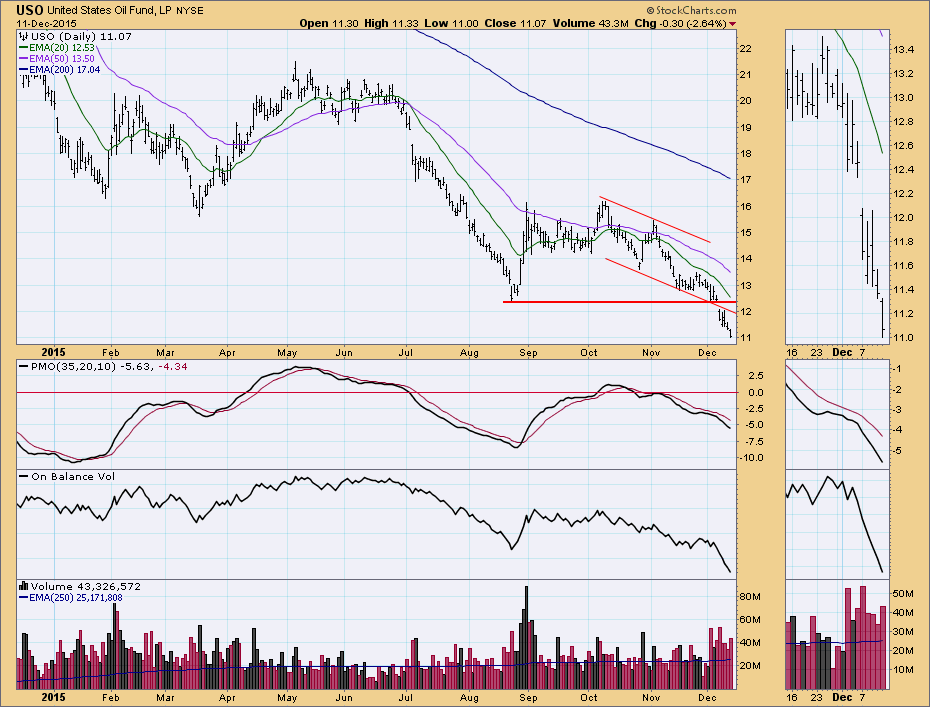
Differing Opinions About Oil

by Carl Swenlin,
President and Founder, DecisionPoint.com
On Friday I saw two opposing headlines regarding oil on one financial website: (1) No worries, oil isn't going any lower, and (2) Oil may go to $20. Before we clutch our head in both hands and cry, "It's so confusing!", let's...
READ MORE
MEMBERS ONLY

S&P 500 FALLS BELOW NOVEMBER LOW IN HIGHER TRADING -- NYSE ADVANCE-DECLINE LINE ALSO BREAKS SUPPORT -- SECTOR ROTATIONS TURN DEFENSIVE -- CRUDE NEARS TEST OF 2009 LOW -- TREASURY BOND/STOCK RATIO STRENGTHENS AS COMMODITY INDEX TUMBLES TO MULTI-YEAR LOWS
by John Murphy,
Chief Technical Analyst, StockCharts.com
S&P 500 FALLS BELOW SEPTEMBER LOW... My Friday afternoon message showed small caps breaking their November lows, and wrote that the S&P 500 Index was in the process of testing that important level. Chart 1 shows the S&P 500 Large Cap Index ending the...
READ MORE
MEMBERS ONLY
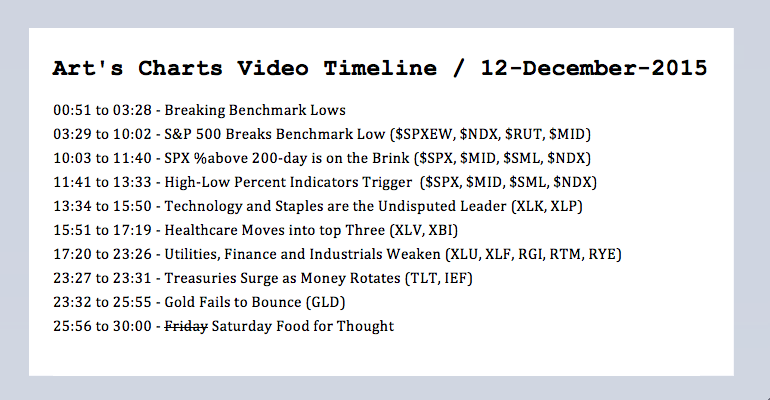
Breaking Benchmark Lows - Breadth Indicators Turn - Gold Fails to Bounce
by Arthur Hill,
Chief Technical Strategist, TrendInvestorPro.com
S&P 500 Breaks Benchmark Low // SPX %Above 200-day Is on the Brink // High-Low Percent Indicators Trigger // Technology is Undisputed Leader // Healthcare Moves into top Three // EW Consumer Discretionary Breaks Down // Treasuries Surge as Money Rotates // Gold Fails to Bounce // Friday Food for Thought ////
S&P 500 Breaks...
READ MORE
MEMBERS ONLY

STOCKS ARE UNDER HEAVY PRESSURE AS CRUDE OIL HITS NEW LOW -- S&P 500 THREATENS SUPPORT -- SMALL CAPS HAVE ALREADY BROKEN NOVEMBER LOW -- TREASURIES JUMP WHILE JUNK BONDS TUMBLE TO TWO-YEAR LOW -- EMERGING MARKETS LEAD GLOBAL DECLINE
by John Murphy,
Chief Technical Analyst, StockCharts.com
SMALL CAPS LEAD MARKET LOWER ... The drop in crude oil to another six-year low has undercut the recent bounce in energy shares, which are leading today's stock selloff. With all ten sectors in the red, energy stocks are down -3%. Commodity-related material stocks are right behind. The three...
READ MORE
MEMBERS ONLY

The Best Source of Investable Ideas

by Gatis Roze,
Author, "Tensile Trading"
Amongst investors these days, there are a number of lively debates going on. Fundamental analysis versus technical analysis, the role of behavioral finance, or where the best investment ideas come from. Pulling no punches here, I maintain that in today’s modern stock market, you are either part of the...
READ MORE
MEMBERS ONLY

The Illustrated Wyckoff

by Bruce Fraser,
Industry-leading "Wyckoffian"
In a continuation of our discussion of the overarching principles of the Wyckoff Method, let’s do a visual case study. There are three principle Laws that compose the Wyckoff Method*:
The Law of Supply and Demand
The Law of Cause and Effect
The Law of Effort and Result
We...
READ MORE
MEMBERS ONLY
Futures Tank, Bears Have A Big Opportunity
by Tom Bowley,
Chief Market Strategist, EarningsBeats.com
Market Recap for Thursday, December 10, 2015
We finished higher across all of our major indices, which is a positive. The negative, however, is that we saw much higher prices earlier in the day only to watch them deteriorate in the afternoon. I never like afternoon selling, especially when history...
READ MORE
MEMBERS ONLY

My Early Holiday Gift to You!
by Erin Swenlin,
Vice President, DecisionPoint.com
If you don't think you have time to read blogs, I issue you a challenge: Read the members-only DecisionPoint Alert blog each day for one week. You can do this for free even if you aren't currently a paid member using the free 10-day trial or...
READ MORE
MEMBERS ONLY
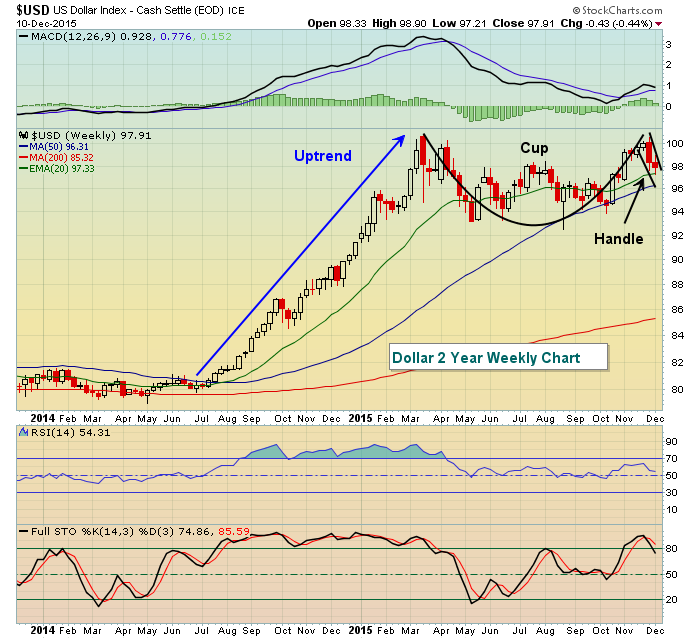
Dollar's Cup With Handle Appears Complete
by Tom Bowley,
Chief Market Strategist, EarningsBeats.com
The U.S. Dollar index ($USD) saw a parabolic rise from mid-2014 through March 2015 and has been consolidating since in a classic cup with handle pattern. The pattern doesn't confirm until we see a breakout, but there's a Federal Reserve meeting next week that could...
READ MORE
MEMBERS ONLY
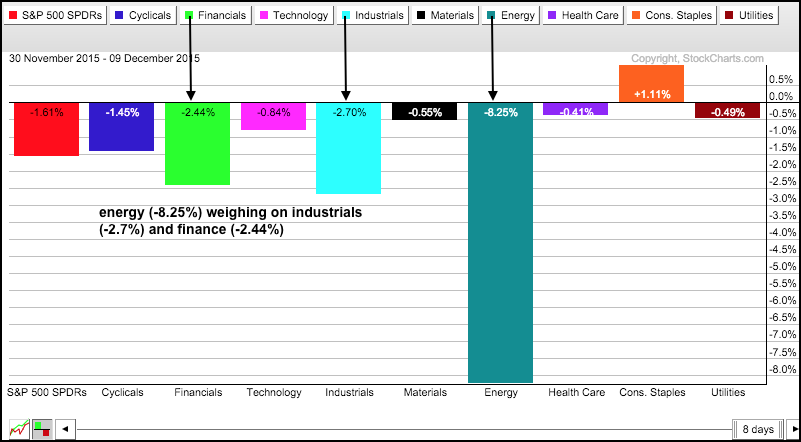
Energy Weighs on 2 Key Sectors - SPY Puts the PPO to the Test - 11 Stock Setups
by Arthur Hill,
Chief Technical Strategist, TrendInvestorPro.com
Energy Weighs on Two Key Sectors // SPY Puts the PPO to the Test // IWM Hits Moment-of-truth // Relative weakness in Small and Mid Caps Persists // XLF and RYF Tests November Lows // Regional Bank SPDR Breaks Support // XLI and RGI Exceed November Lows // Four Inside Days for IBB // Stocks of Interest (11)...
READ MORE
MEMBERS ONLY

Benchmarking and Taxes
by Greg Morris,
Veteran Technical Analyst, Investor, and Author
Many funds/strategies are tied to a benchmark. In fact, I think most are tied to a benchmark. The goal of these managers is to try to beat the benchmark. Some do and most don’t; yet when the number beating or failing to beat the benchmark is usually not...
READ MORE
MEMBERS ONLY
NASDAQ Weak; Materials Buoyed By Falling Dollar, Dupont Deal
by Tom Bowley,
Chief Market Strategist, EarningsBeats.com
Market Recap for Wednesday, December 10, 2015
The action on Wednesday was crazy. The Dow Jones was higher by 200 points in the first hour of trading. At that same time, the NASDAQ was up less than 10 points, a complete reversal of what we saw on Tuesday when the...
READ MORE
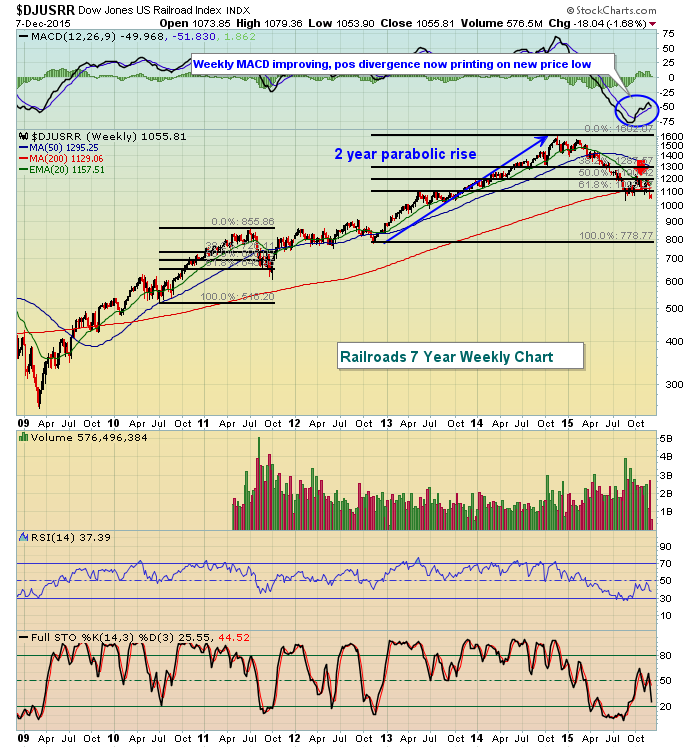
MEMBERS ONLY

More Of The Santa Sell-Off To Come?
by Martin Pring,
President, Pring Research
* Volume starting to expand on the downside
* Half a Dow Theory sell signal on the weekly charts
* 30-year yield locked in a tight trading range
* Dollar Index facing important test
Expanding volume on the downside
This market continues to be plagued with volume problems. Initially, it was a lack of...
READ MORE
MEMBERS ONLY

OIL BOUNCE FADES -- BUT ENERGY STOCKS END HIGHER -- MATERIALS JUMP ON DUPONT AND DOW CHEMICAL MERGER -- STOCKS END LOWER -- VIX NEARS 20 BARRIER
by John Murphy,
Chief Technical Analyst, StockCharts.com
MARKET RECAP... A morning oil bounce on low inventory faded in afternoon trading and the testing of support continues. Even so, energy stocks held some of their gains. Chevron and Exxon Mobil helped support the Dow. Materials had a strong day on the merger of Dupont and Dow Chemical. The...
READ MORE
MEMBERS ONLY

CRUDE OIL TRIES TO REBOUND OFF AUGUST LOW -- ENERGY STOCKS ALSO REBOUND OFF CHART SUPPORT -- HIGH YIELD BONDS TEST OLD LOWS AS WELL -- TREASURIES SELL OFF -- DOLLAR DROP BOOSTS COMMODITIES -- S&P TRIES TO HOLD CHART SUPPORT
by John Murphy,
Chief Technical Analyst, StockCharts.com
WTIC CRUDE OIL STILL TESTING LONG-TERM SUPPORT... The recent drop in the price of oil has caused energy stocks to drop which, in turn, has caused nervous selling in the rest of the market. That has pushed a number of energy-related assets into tests of important support levels. The monthly...
READ MORE
MEMBERS ONLY
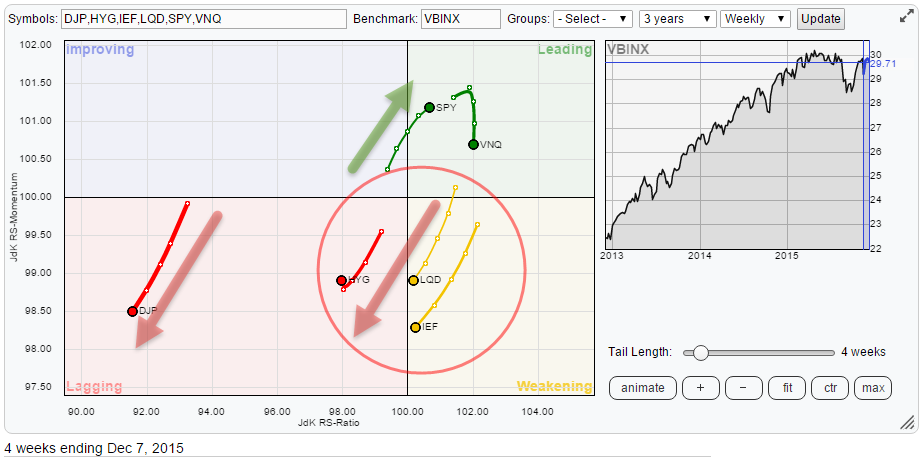
Asset class rotation: it depends on the time-frame
by Julius de Kempenaer,
Senior Technical Analyst, StockCharts.com
Summary
* Commodities keep tanking
* Bond related asset classes weakening
* Equities leading on weekly- but weakening on daily time-frame
* US equities continue to lead international equity markets
* Chinese market coming back into play
Quick scan
A quick look at the Relative Rotation Graph holding a number of asset class ETFs, comparing...
READ MORE
MEMBERS ONLY
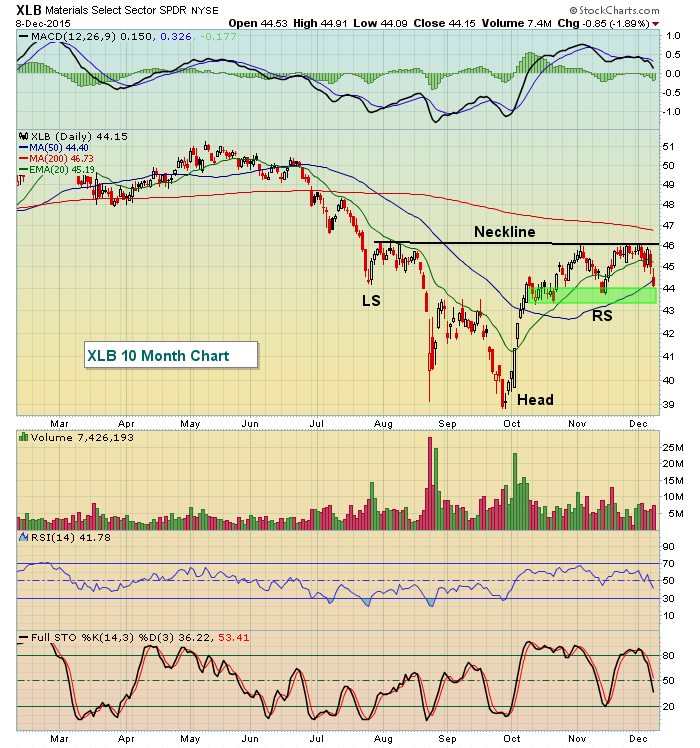
Industrials (XLI) Weak Amid Signs Of Toppiness
by Tom Bowley,
Chief Market Strategist, EarningsBeats.com
Market Recap for December 8, 2015
I indicated on Tuesday morning that the bulls' resiliency would be tested as our major indices were poised to open significantly lower. They proved they're a resilient bunch once again, frustrating those on the bearish side of the aisle. It feels...
READ MORE
MEMBERS ONLY
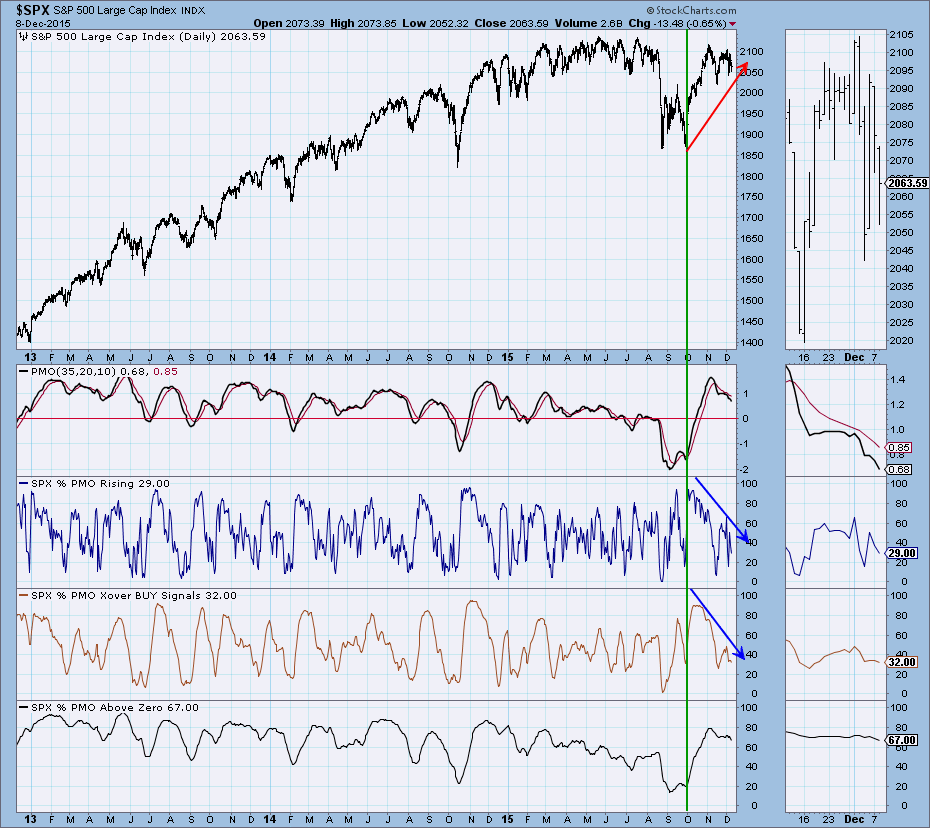
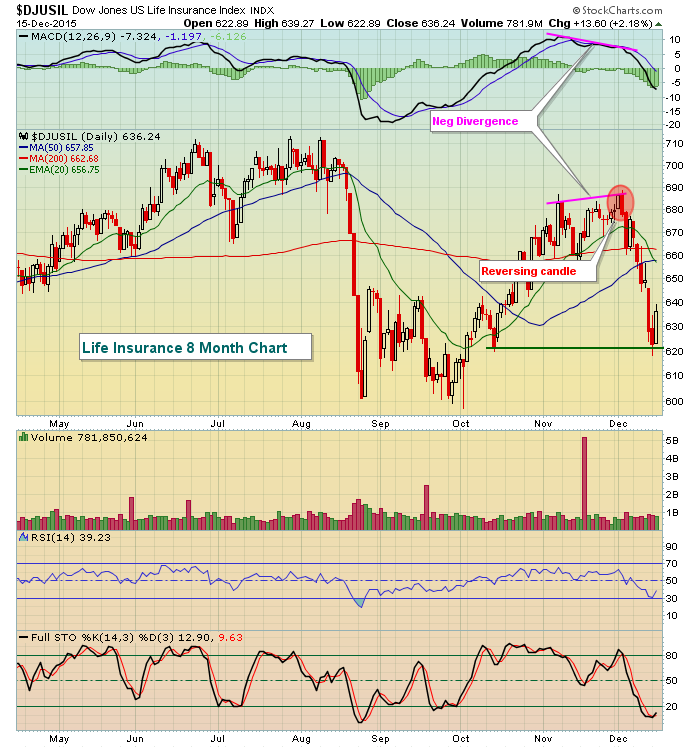
Price Momentum Oscillator (PMO) Analysis Reveals Market Weakness
by Erin Swenlin,
Vice President, DecisionPoint.com
On October 29th this year, I wrote a similar article to today's about the significance of lack of market participation in the rally out of lows. I decided it was a great time to revisit these charts based on the current decline and to trace what happened after...
READ MORE
MEMBERS ONLY
The One Key Level - Junk, Treasuries and Banks - %Above 200-day for Sectors
by Arthur Hill,
Chief Technical Strategist, TrendInvestorPro.com
The One Key Level // SPY Uptrend with Triangle // IWM Struggling, but above Key Support // Junk Bonds, Treasury Yields and Regional Banks // Percent of 200-day for the Nine Sectors // Webinar Preview ////
The One Key Level
Stocks are under pressure before the open and oil is getting the blame. While I hate...
READ MORE
MEMBERS ONLY
Same Ole Same Ole, Energy Plunges
by Tom Bowley,
Chief Market Strategist, EarningsBeats.com
Market Recap for Monday, December 7, 2015
As baseball great Yogi Berra would famously say, "It's deja vu all over again". The S&P 500 keeps trying - and failing - to break out and one big reason is the lack of participation from energy...
READ MORE
MEMBERS ONLY
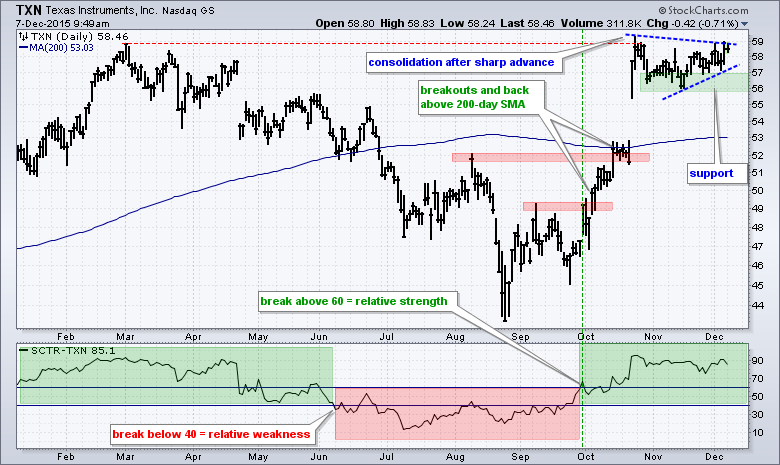
Texas Instruments Challenges Highs and Sports a Strong SCTR
by Arthur Hill,
Chief Technical Strategist, TrendInvestorPro.com
Texas Instruments (TXN) is leading the market with a strong StockCharts Technical Rank (SCTR) and the stock is consolidating near its 52-week high. TXN is part of the semiconductor industry group and the technology sector, both of which have been leading the market lately. On the price chart, TXN broke...
READ MORE
MEMBERS ONLY
Friday Rebound Keeps Bull Market On Track - Maybe
by Tom Bowley,
Chief Market Strategist, EarningsBeats.com
Market Recap for Friday, December 4, 2015
Major indices here in the U.S. rebounded Friday in a big, big way after Thursday's drubbing. During uptrends, I always look to rising 20 day EMAs for support. On Thursday, all of our major indices lost 20 day EMA support,...
READ MORE
MEMBERS ONLY

Taking Full Advantage of StockCharts.com's Holiday Special
Hello Fellow ChartWatchers!
Well, it's that time of year again - time to save a bunch of money on your StockCharts membership! As long-time members know, we usually run our Holiday special during the month of December and that is usually a great time to take advantage of...
READ MORE
MEMBERS ONLY
Gold Starting New Rally
by Carl Swenlin,
President and Founder, DecisionPoint.com
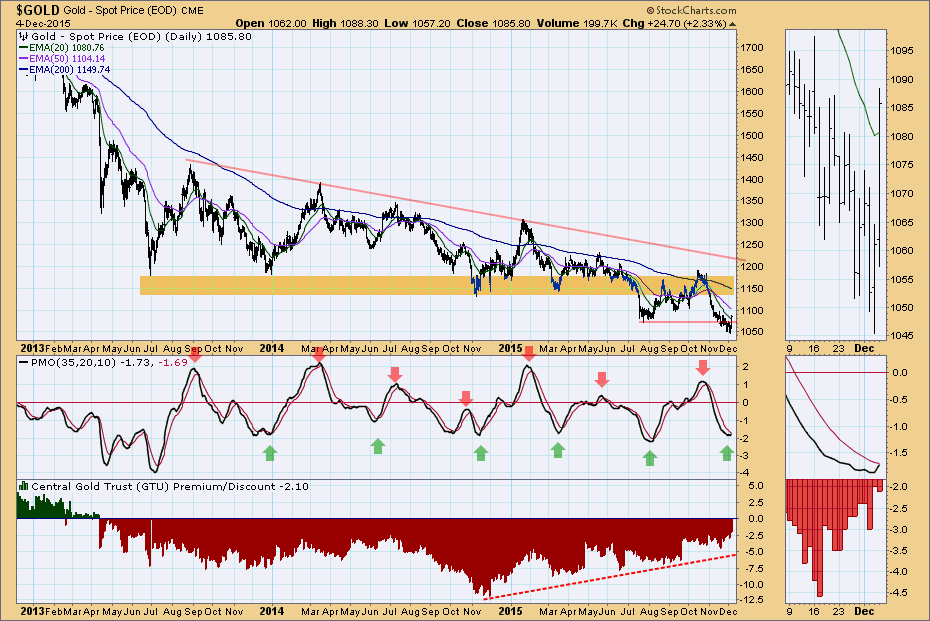
On Friday $GOLD made a strong up move, seemingly ending a decline that has lasted almost two months. Price broke back above a line of resistance drawn from the July low, a line that will now serve as support.
The PMO has been helpful in identifying price tops and bottoms...
READ MORE
MEMBERS ONLY
Friday Jump Keeps Stocks in Uptrend
by John Murphy,
Chief Technical Analyst, StockCharts.com
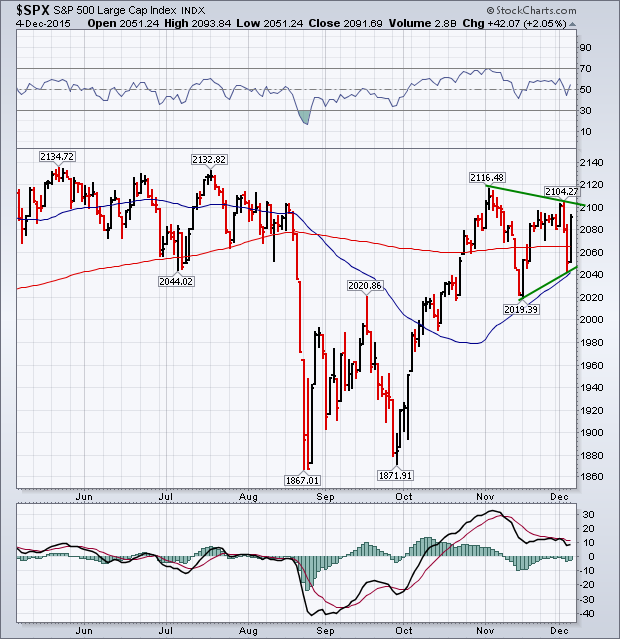
A strong rally on Friday more than erased losses from Thursday and left the market in much better shape. The chart below shows the S&P 500 ending the week back above its 200-day average after bouncing off its 50-day line on Thursday. Chartwatchers will now recognize the pattern...
READ MORE
MEMBERS ONLY
Trading in a Sideways Market

by John Hopkins,
President and Co-founder, EarningsBeats.com
On 12-3-14 the S&P closed at 2074. On 12-3-15 (Friday) the S&P closed at 2091. That's about as flat as you can get over a 12 month period and it helps explain why many traders have had a difficult time scoring big gains over...
READ MORE
MEMBERS ONLY

Did Friday's 370-Point Rally Change Anything For The Equity Market?
by Martin Pring,
President, Pring Research
* Friday’s rally fails to reel in new highs
* Guggenheim asset flows just above critical support
* 30-year yield caught between two converging trendlines
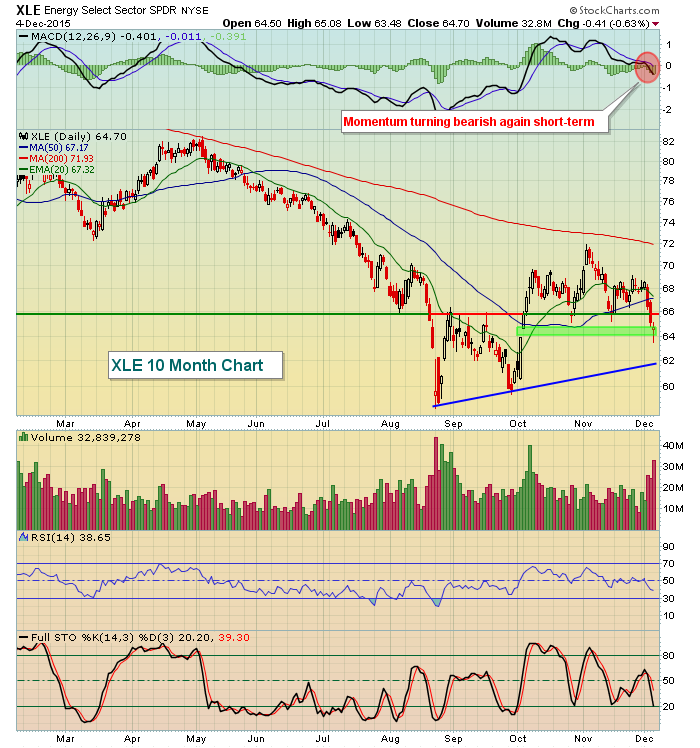
* Energy SPDR XLE completes a bearish head and shoulders
A couple of days ago I wrote that a bearish two-bar reversal that had developed in many averages...
READ MORE
MEMBERS ONLY
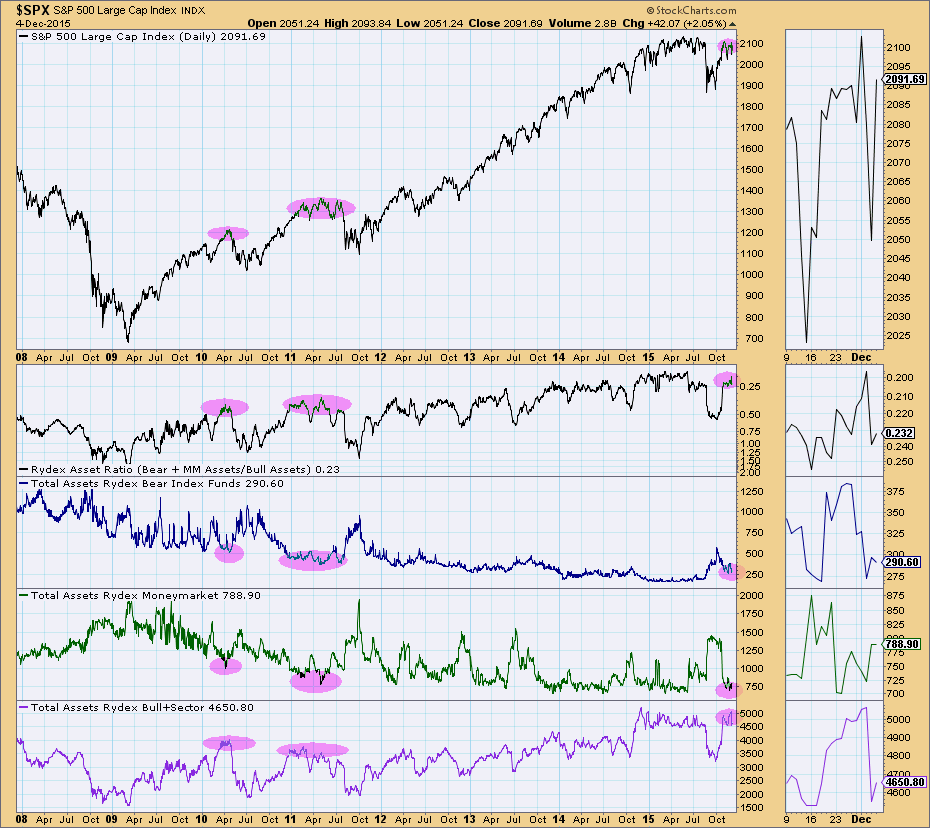
Rydex Assets Sentiment Suggests Topping Market
by Erin Swenlin,
Vice President, DecisionPoint.com
After the tug-o-war of the last two trading days, I decided it was time to look at sentiment based on the DecisionPoint Rydex Assets Analysis charts. There are two to look at and they are both available in the free DecisionPoint Rydex Funds ChartPack. You'll also find cashflow...
READ MORE
