MEMBERS ONLY
Prior Price Surges in $SPX -- ST Uptrends Hold -- Retail and Housing Challenge Resistance

by Arthur Hill,
Chief Technical Strategist, TrendInvestorPro.com
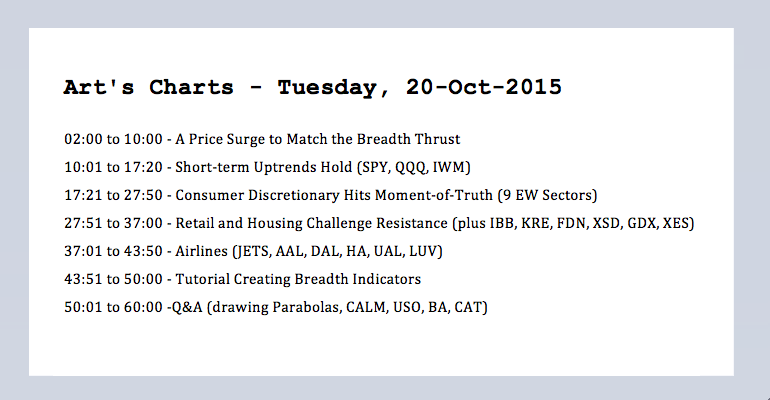
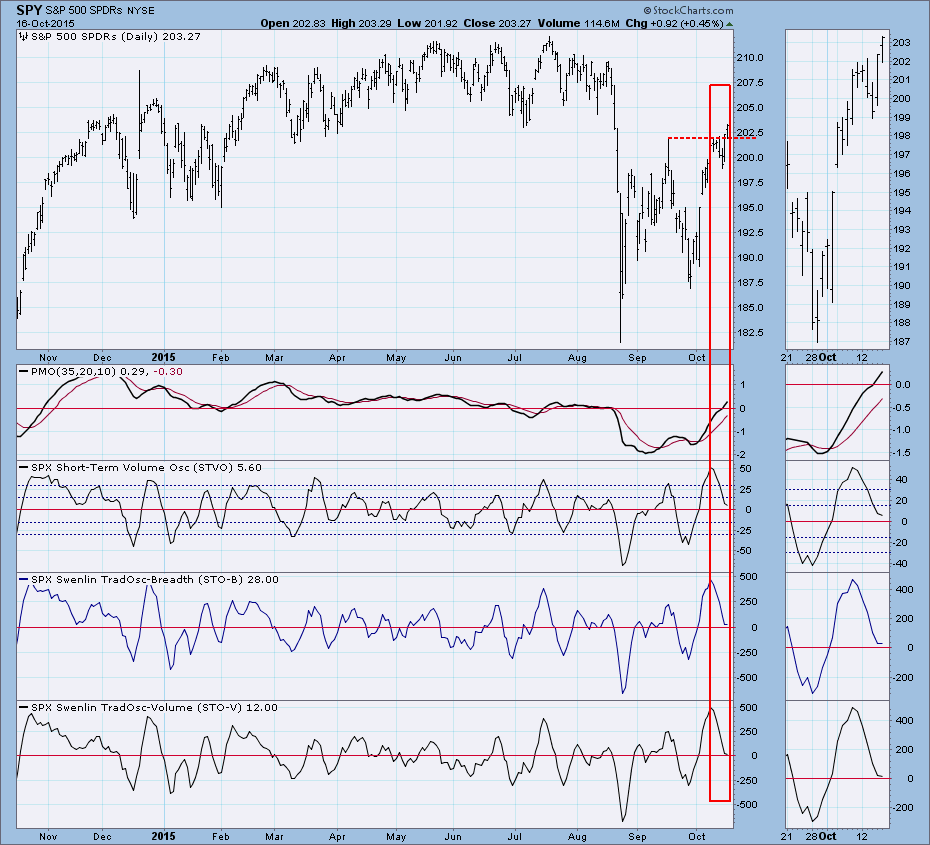
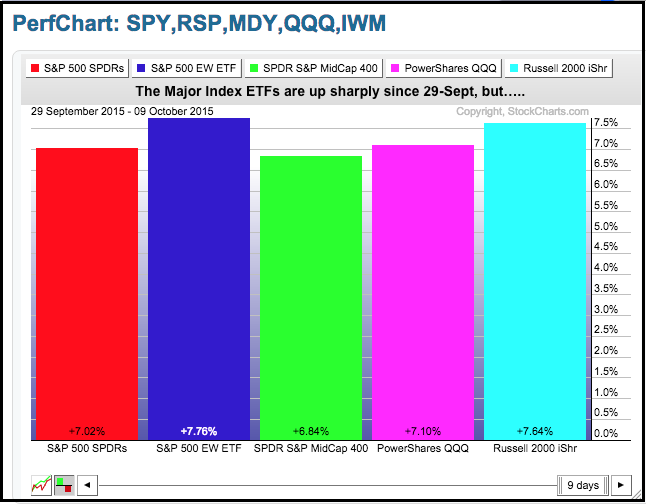
A Price Surge to Match the Breadth Thrust
It has been one heck of a three week period. SPY is up around 8%, QQQ is up around 9% and the Russell 2000 iShares (IWM) is up around 7.5%. There are, of course, two ways to interpret these price surges....
READ MORE
MEMBERS ONLY
Market Stalling Near Those Pivotal 20 Week EMAs

by Tom Bowley,
Chief Market Strategist, EarningsBeats.com
Market Recap for Monday, October 19, 2015
It was mostly bifurcated action throughout Monday's session with the NASDAQ leading. The Dow Jones and S&P 500 did manage to finish with gains after rallying in the final two hours. Among sectors, consumer stocks resumed their leadership role...
READ MORE
MEMBERS ONLY
Small-caps and Retailers Lag, but Semis Take the Lead
by Arthur Hill,
Chief Technical Strategist, TrendInvestorPro.com
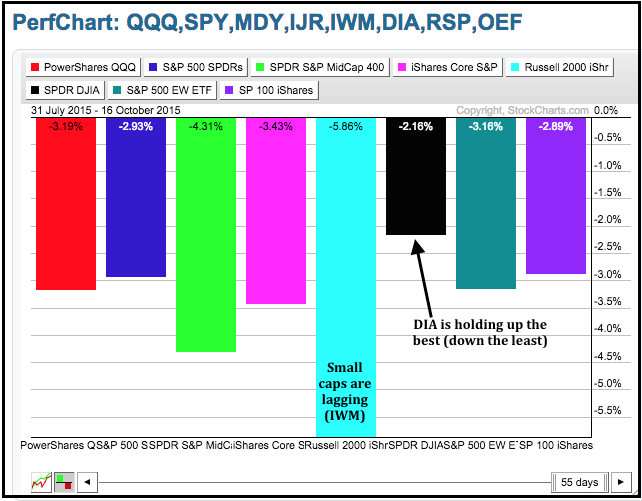
It has been a rough two and a half months for the stock market with a major segment underperforming and one key industry group lagging. Semiconductors, however, are emerging as leaders within the technology sector. The major index ETFs are all down since the end of July with the S&...
READ MORE
MEMBERS ONLY
QQQ and SPY Maintain Uptrends -- Can we Ignore Breadth and Volume Thrusts?
by Arthur Hill,
Chief Technical Strategist, TrendInvestorPro.com
I am starting to entertain the idea that the surge from late September to mid October was strong enough to negate the August breakdowns in SPY and QQQ. The bounce over the last few weeks contained strong breadth and strong upside volume. Also notice that SPY broke above the mid...
READ MORE
MEMBERS ONLY
Option Expiration Day Provides No Answers
by Tom Bowley,
Chief Market Strategist, EarningsBeats.com
Market Recap for Friday, October 16, 2015
Friday's action was fairly calm for an option expiration day, especially given that there's so much at stake technically. We did see a sudden drop in the early part of the afternoon session only to be followed by a...
READ MORE
MEMBERS ONLY
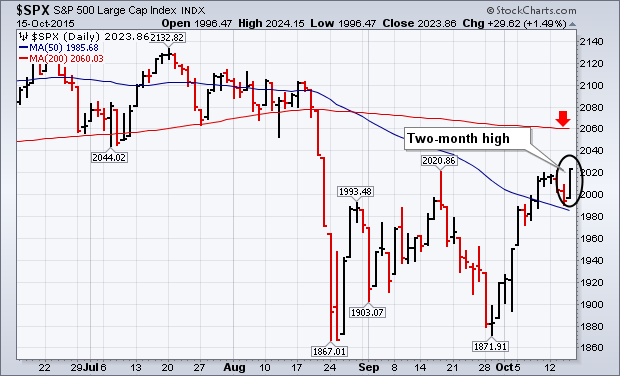
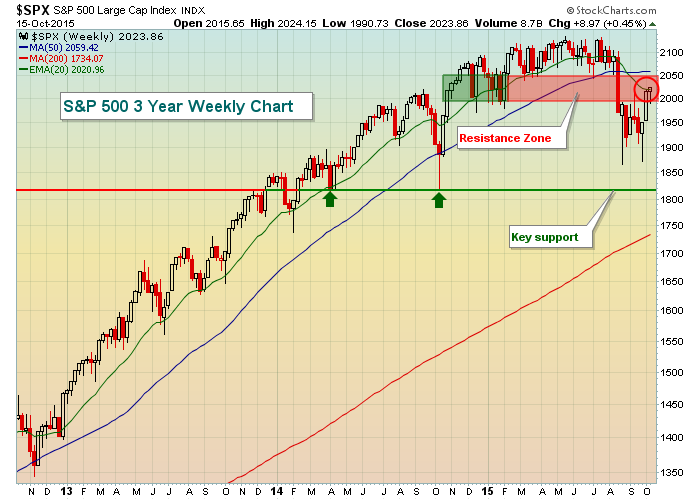
S&P 500 Hits Two Month High

by John Murphy,
Chief Technical Analyst, StockCharts.com
U.S. stocks continued the rally that started in late September. On Thursday, the Dow Industrials gained 217 points (1.2%) to extend its rally. The first chart below shows the S&P 500 gaining an even stronger 1.5%. More importantly, the SPX closed at 2023 which exceeded...
READ MORE
MEMBERS ONLY
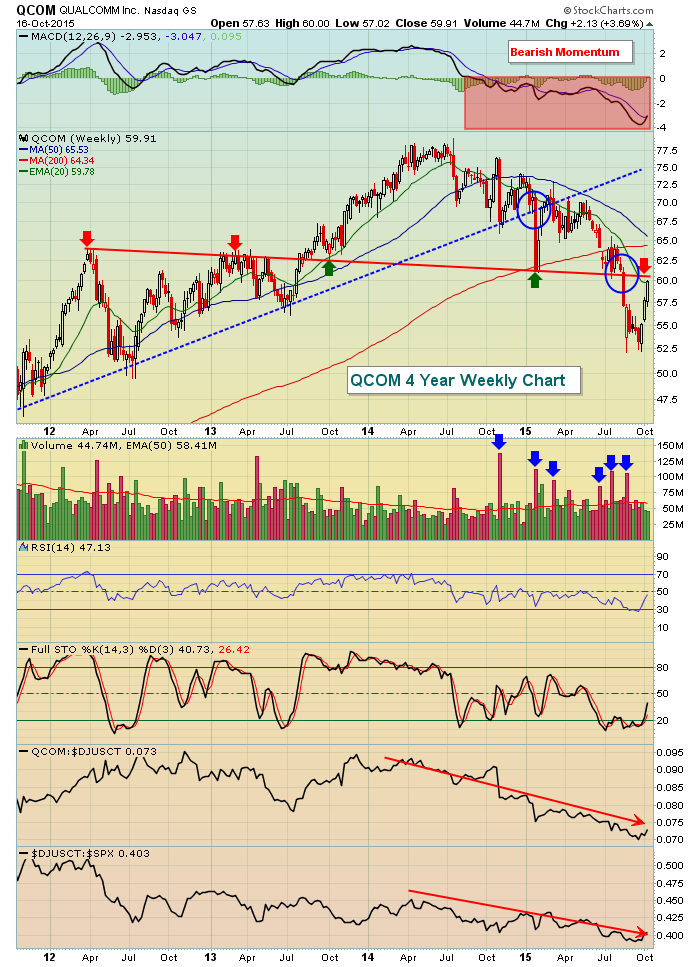
QCOM Rally Sets Up Shorting Opportunity
by Tom Bowley,
Chief Market Strategist, EarningsBeats.com
Over the past three weeks, Qualcomm (QCOM) has rallied from a low of 52.17 to Friday's close at 59.91 - barely eclipsing the falling 20 week EMA currently at 59.78. Has that 15% recovery signaled that the worst is over? Or is this just the...
READ MORE
MEMBERS ONLY
Bear Market, Bullish Behavior

by Carl Swenlin,
President and Founder, DecisionPoint.com
Based upon the fact that the 50EMA is below the 200EMA, I consider that we are in a bear market, and that we should expect negative outcomes more often than positive ones; however, we should remember that positive outcomes are also possible some of the time. Case in point, the...
READ MORE
MEMBERS ONLY
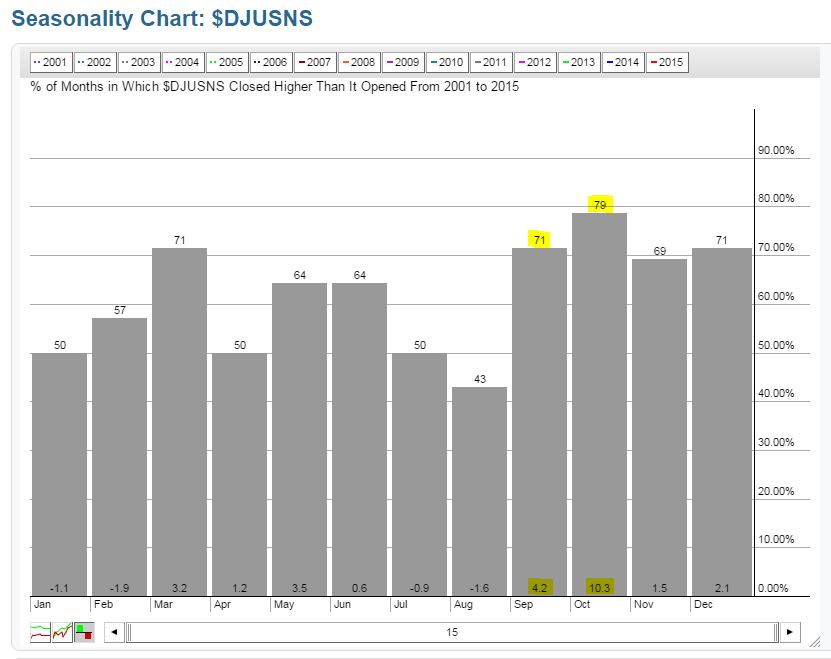
Seasonality Favors Precious Metals And Travel Stocks In November
by Tom Bowley,
Chief Market Strategist, EarningsBeats.com
In prior months, I've used the seasonality tool here at StockCharts.com to identify industry groups poised to perform well. In September, internet ($DJUSNS), footwear ($DJUSFT), recreational services ($DJUSRQ), and reinsurance ($DJUSIU) stocks were shown to outperform the benchmark S&P 500 and all four either held...
READ MORE
MEMBERS ONLY
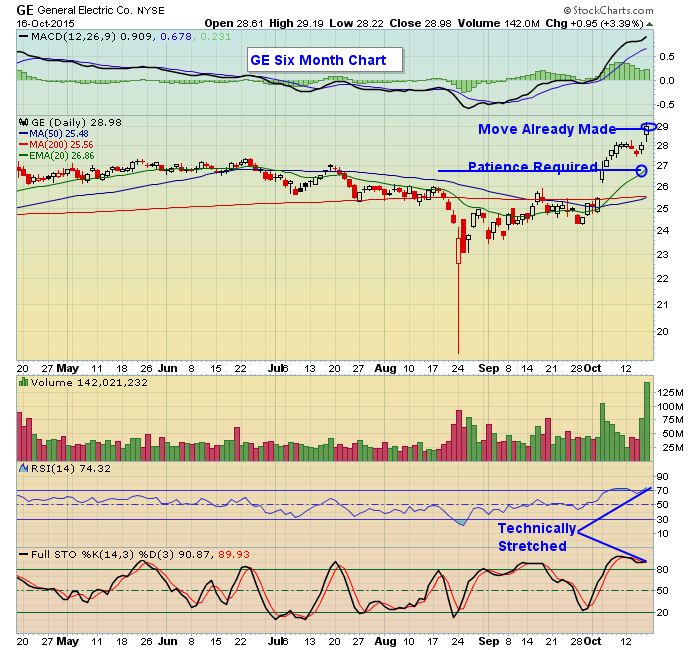
When it Comes to Earnings, Patience is Required

by John Hopkins,
President and Co-founder, EarningsBeats.com
The earnings season is in high gear now with some very visible companies already reporting their numbers and thousands more about to report over the course of the next several weeks. Already we've seen example of stocks that have performed well after reporting and others that have taken...
READ MORE
MEMBERS ONLY
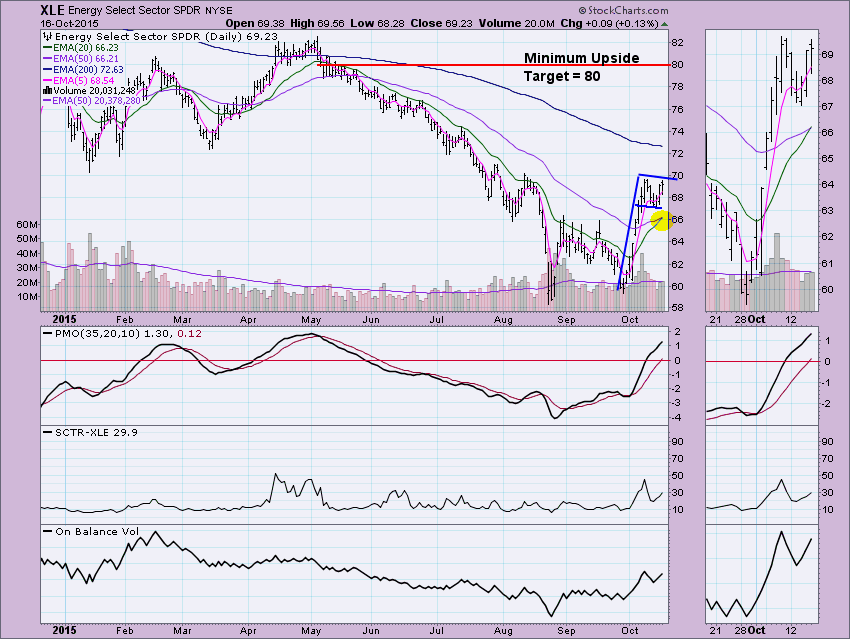
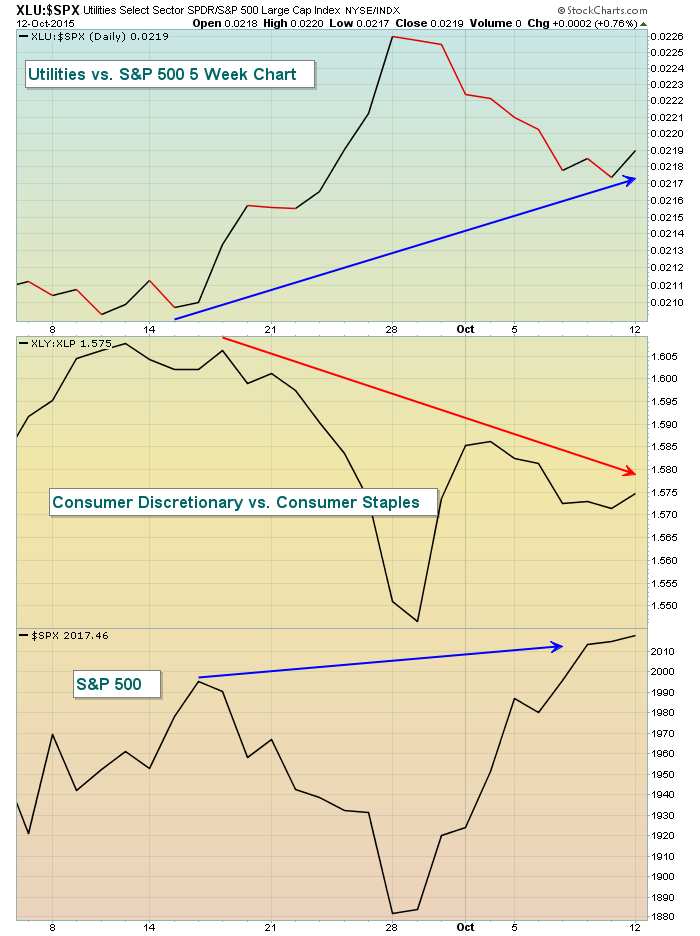
Energy and Utilities Spark Interest

by Erin Swenlin,
Vice President, DecisionPoint.com
Energy and Utilities have both recently sparked my curiosity. It started with the Energy sector on our DecisionPoint Daily/Market Summary which flipped from Intermediate-Term Trend Model SELL signals to BUY signals. After that, I received a Technical Alert from a scan I have that notifies me when the 50/...
READ MORE
MEMBERS ONLY
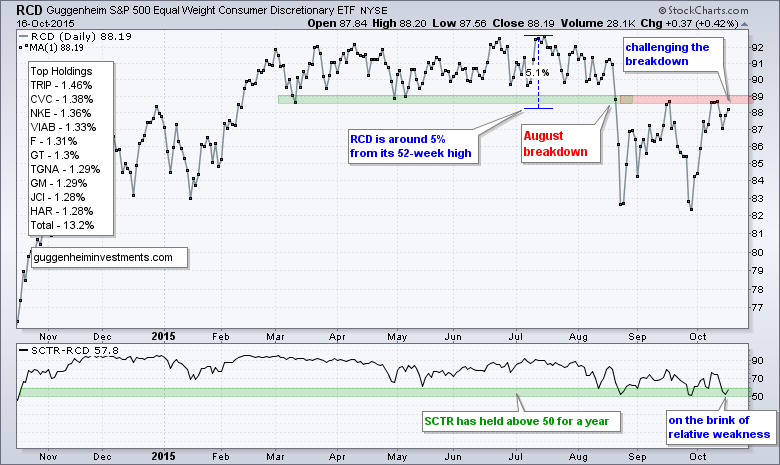
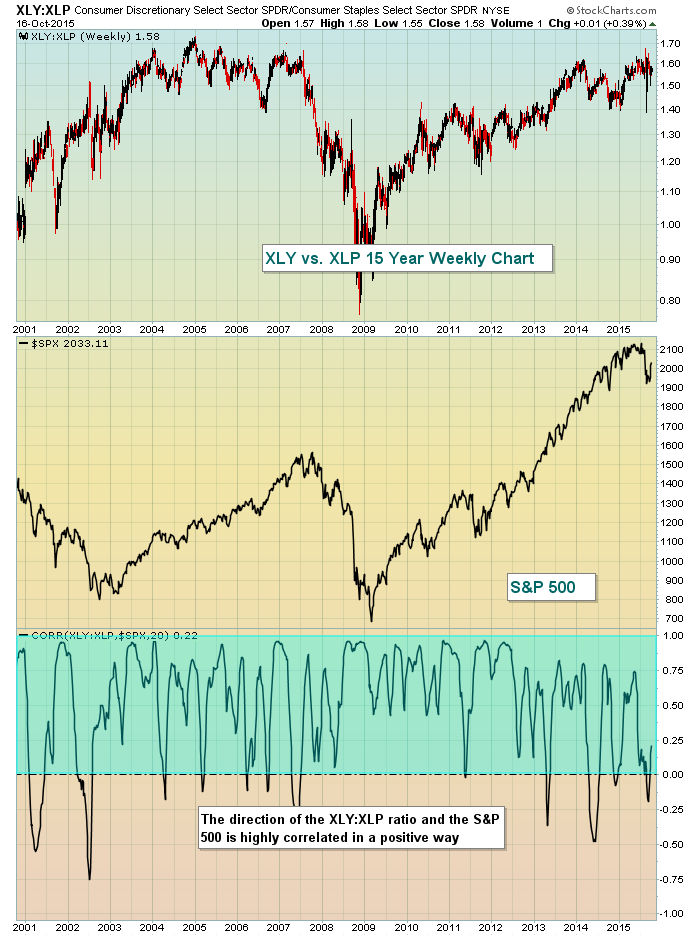
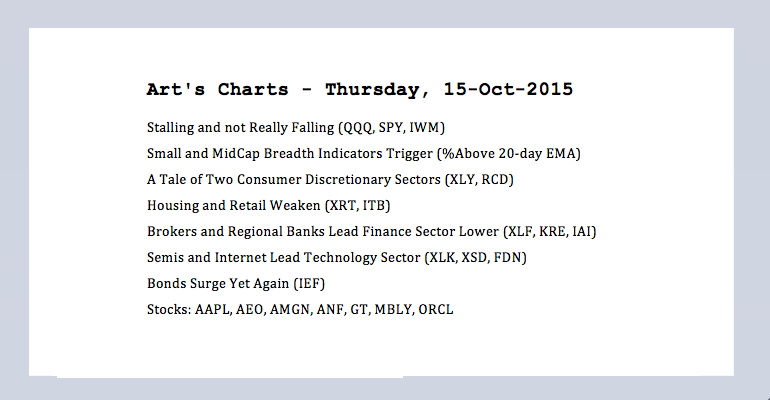
A Tale of Two Consumer Discretionary Sectors
by Arthur Hill,
Chief Technical Strategist, TrendInvestorPro.com
Large caps continue to outperform "other" caps and this has created a performance discrepancy within the consumer discretionary sector. I am highlighting this sector because it is the most economically sensitive sector and includes many domestically focused industry groups, including retail, restaurant, media and home construction. The first...
READ MORE
MEMBERS ONLY

Lots Of Markets Are At Crucial Juncture Points

by Martin Pring,
President, Pring Research
* US Equities remain short-term overbought
* Yield curves starting to steepen (decline)
* All bond maturities are at critical trendlines
* Dollar about to break down?
* Gold about to break out?
US Equities
Earlier in the week I indicated that several short-term indicators such as the Price Percentage Oscillator(PPO) using an 8/...
READ MORE
MEMBERS ONLY

Selling Methodology: 1 + 1 = 3

by Gatis Roze,
Author, "Tensile Trading"
I’ve been teaching investors about Stage 9 – The Selling Stage – of the Tensile Trading methodology for over 15 years. My observation is that novice investors need a simple selling routine as a fist step. Once they are able to embrace the necessity and validity of deploying a selling strategy,...
READ MORE
MEMBERS ONLY
Defining the Trend -- $SPX Challenges Downtrend -- $NDX Never Reversed -- $RUT Lags -- About That Breadth Surge
by Arthur Hill,
Chief Technical Strategist, TrendInvestorPro.com
Today I will start with weekly charts for the S&P 500, Nasdaq 100 and Russell 2000, or the big three as I call these major stock indices. One remains in an uptrend, one is close to reversing its downtrend and one remains in a clear downtrend. I am...
READ MORE
MEMBERS ONLY
Bears Had Their Two Day Glory
by Tom Bowley,
Chief Market Strategist, EarningsBeats.com
Market Recap for Thursday, October 15, 2015
On the surface, the big gains yesterday appear quite bullish - and they may turn out to be. There are definitely positives and negatives. On the plus side, volume really accelerated in the final hour or two to support the buying. We saw...
READ MORE
MEMBERS ONLY
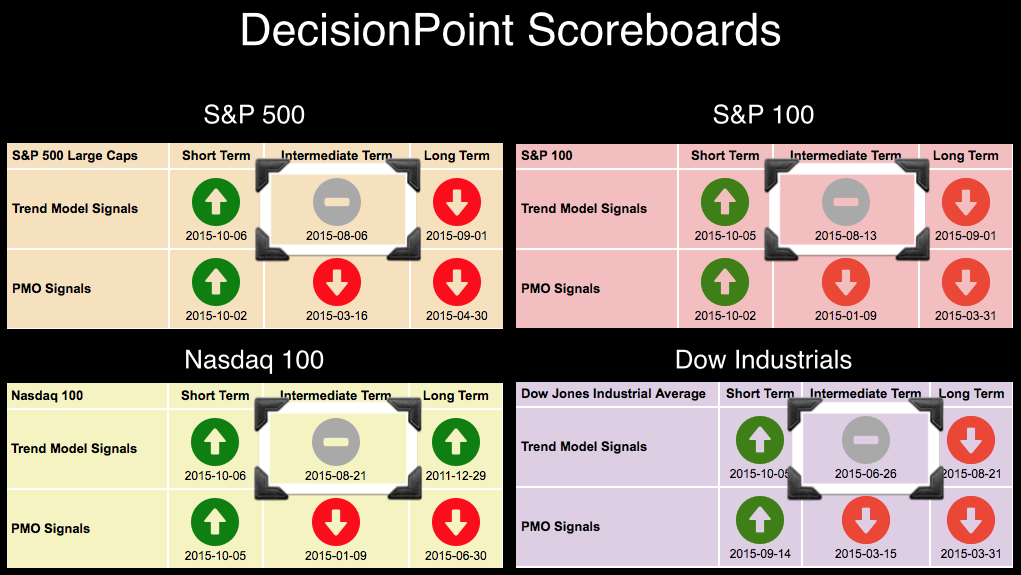
Why Are Neutral Signals Not Turning Into Sell Signals?
by Erin Swenlin,
Vice President, DecisionPoint.com
I recently received an email from a reader who asked me why the neutral signals on the had not turned to red Sell signals. First there is the technical reason and then there are the charts. The technical reason is that our DecisionPoint Trend Model only changes on crossovers. Once...
READ MORE
MEMBERS ONLY
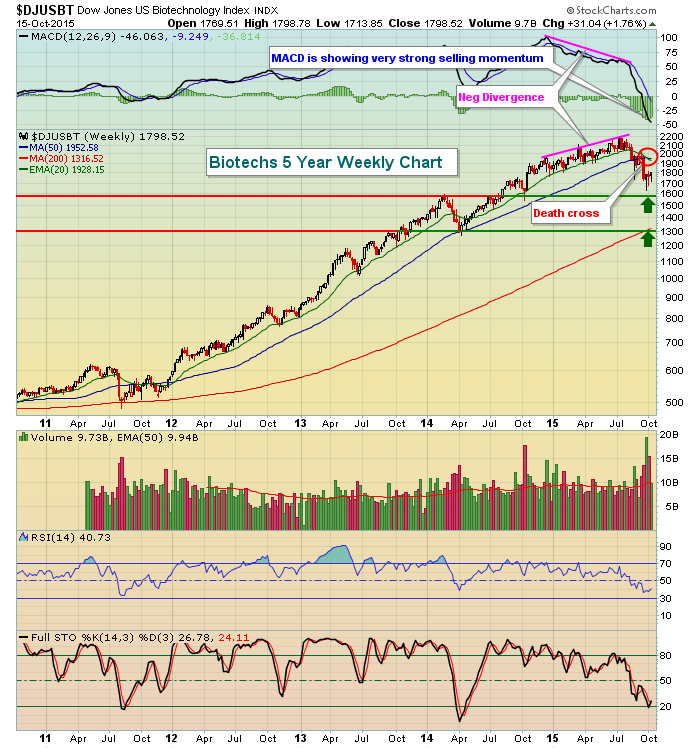
Biotech Rallies But Resistance Ahead
by Tom Bowley,
Chief Market Strategist, EarningsBeats.com
The technical conditions surrounding biotechs ($DJUSBT) are bad, no sugar-coating here. It's not pictured below but the DJUSBT did manage to clear 20 day EMA resistance on today's close. However, I'm more concerned with the longer-term weekly charts where we've seen heavy...
READ MORE
MEMBERS ONLY

FINANCIALS LEAD MARKET HIGHER -- BANK OF AMERICA, CITIGROUP, AND GOLDMAN SACHS LEAD -- EMERGING MARKETS LEAD FOREIGN STOCKS HIGHER -- S&P 500 CLOSES AT TWO-MONTH HIGH AS NASDAQ CLOSES ABOVE 50-DAY LINE -- VIX FALLS 10% TO TWO-MONTH LOW
by John Murphy,
Chief Technical Analyst, StockCharts.com
BANK STOCKS HAVE STRONG DAY ... Financial stocks led a strong day in stocks. Several big bank stocks had big chart days. The daily bars in Chart 1 show Bank of America (BAC) surging more than 3% in heavy trading. It's also testing its 50- and 200-day moving averages....
READ MORE
MEMBERS ONLY

DOLLARS WEAKENS AS TWO-YEAR TREASURY YIELD FALLS TO THREE MONTH LOW -- THAT COMBINATION IS PUSHING PRECIOUS METALS HIGHER -- GOLD HAS RETRACED 50% OF ITS PREVIOUS BULL MARKET WHICH PUTS IT IN A POTENTIAL SUPPORT ZONE
by John Murphy,
Chief Technical Analyst, StockCharts.com
DOLLAR FALLS WITH U.S. RATES... U.S. interest rates have been dropping on reduced expectations for a Fed rate hike this year. Chart 1 shows the 2-Year Treasury Yield falling yesterday to the lowest level in three months. That's important because that shorter term yield is more...
READ MORE
MEMBERS ONLY
New High, New Low Indicators (CGMBI - Chap 7)

by Greg Morris,
Veteran Technical Analyst, Investor, and Author
Please remember, these articles that cover various chapters in the upcoming book are not the complete chapter, only highlights that I have selected. The book is nearing completion.
CH 7 New High New Low Indicators
This Chapter contains all the indicators that are dedicated to using New Highs and/or...
READ MORE
MEMBERS ONLY
Futures Up, New Battle Begins
by Tom Bowley,
Chief Market Strategist, EarningsBeats.com
Market Recap for Wednesday, October 14, 2015
Materials and energy managed to eke out fractional gains, while utilities were flat. Unfortunately, as I evaluate the strength of the stock market, those are not the sectors that heavily influence me. Instead, the other six sectors were lower with consumer stocks being...
READ MORE
MEMBERS ONLY
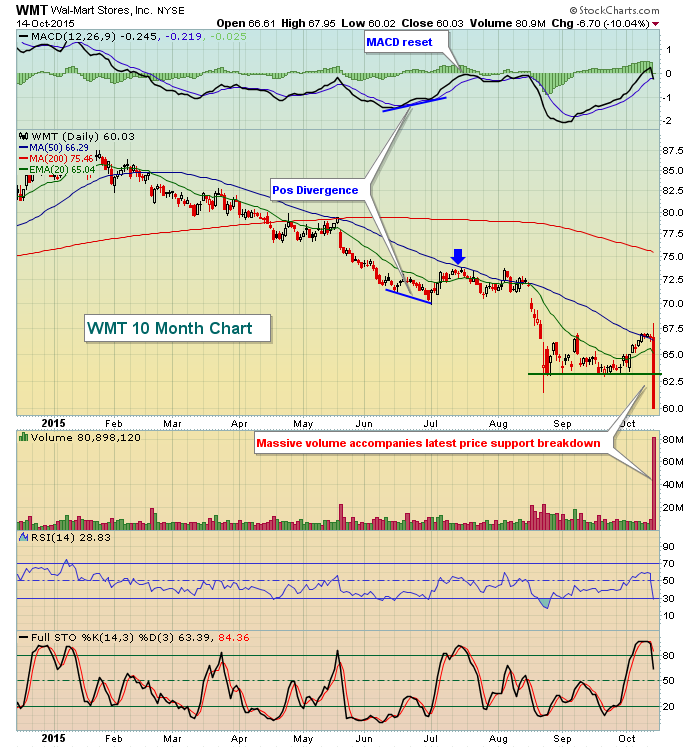
QQQ Holds Gap -- Small Cap Breadth Triggers -- Retail-Housing Weaken -- Banks-Brokers Break -- XSD, AAPL and more
by Arthur Hill,
Chief Technical Strategist, TrendInvestorPro.com
Stalling and not Really Falling (Yet)
Looking at the big three major index ETFs, two of the three are still short-term bullish and have yet to break down. QQQ stalled with some serious indecision the last four days. SPY is down about 1% the last two days, but remains above...
READ MORE
MEMBERS ONLY
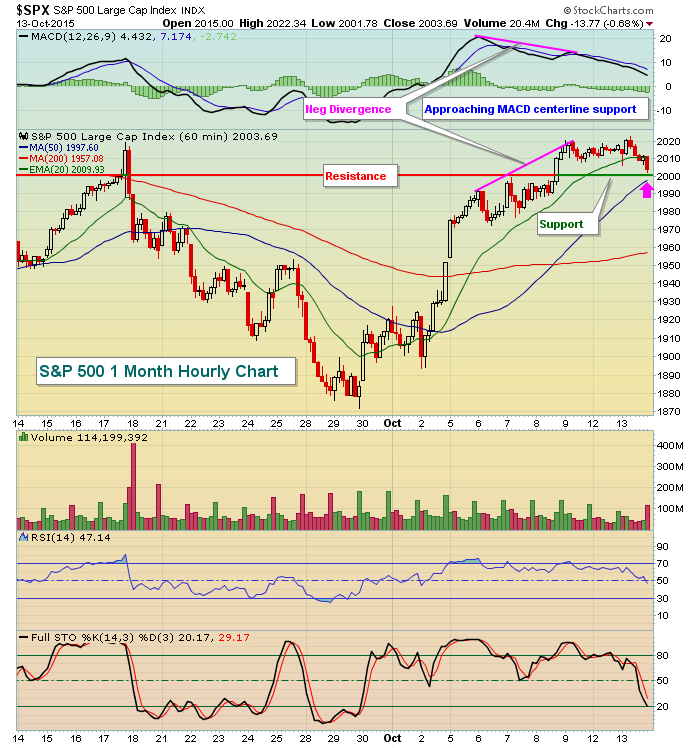
Short-Term Signs Pointing To Weakness Ahead
by Tom Bowley,
Chief Market Strategist, EarningsBeats.com
Market Recap for Tuesday, October 13, 2015
One piece of good news on Tuesday was that technology was the leading sector. However, all nine sectors moved lower and the action was probably the most bearish over the past 2-3 weeks. Serious short-term technical ramifications quickly surfaced. In no particular order:...
READ MORE
MEMBERS ONLY
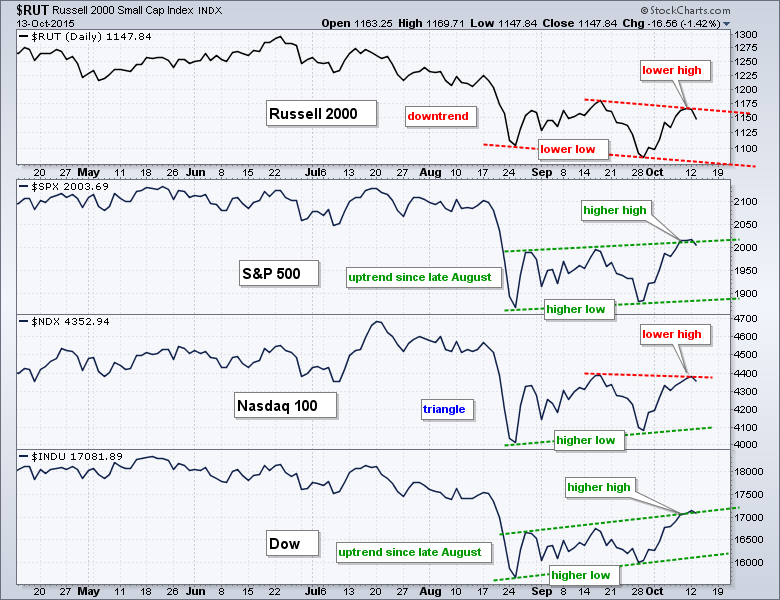
Small Caps and Large Techs Are Lagging
by Arthur Hill,
Chief Technical Strategist, TrendInvestorPro.com
Price action has been rather volatile since the August breakdown, but some performance discrepancies are emerging in October and these could foreshadow broad market weakness. The chart below shows the Russell 2000, S&P 500, Nasdaq 100 and Dow Industrials, all on one chart for easy comparison. First, notice...
READ MORE
MEMBERS ONLY
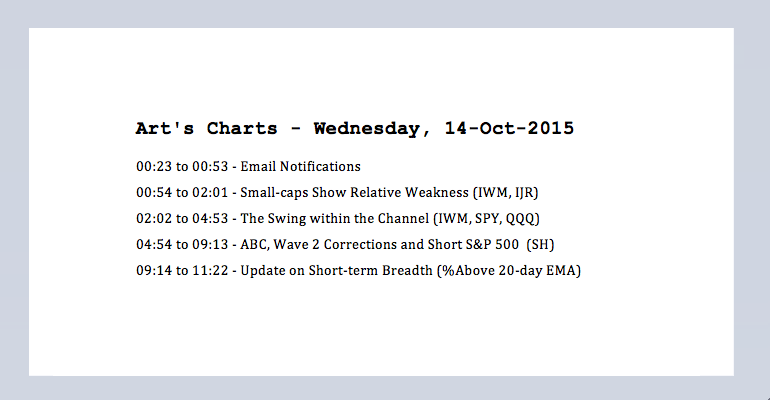
Small-caps Show Weakness -- Swing within the Channel -- ABC, Wave 2 and Short SPX -- Short-term Breadth
by Arthur Hill,
Chief Technical Strategist, TrendInvestorPro.com
Small-caps Show Relative Weakness
After stalling for two days, the major index ETFs moved lower on Tuesday with the Russell 2000 iShares (IWM) leading the way. Small-caps were lagging in September and they continue to lag in October. While SPY and QQQ managed to exceed their mid September highs, IWM...
READ MORE
MEMBERS ONLY
The Unfriendly Trend

by Bruce Fraser,
Industry-leading "Wyckoffian"
Once Distribution is complete, the Markdown Phase begins. Declining prices after the completion of Distribution can cause a ruckus. Sponsorship (of a stock, bond, commodity, ETF, etc.) by large and informed interests is necessary to drive prices higher and higher. Eventually large sponsors abandon ship, which they do through the...
READ MORE
MEMBERS ONLY
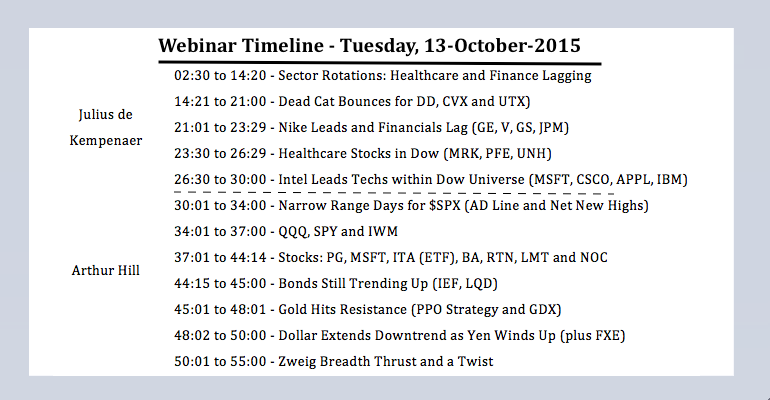
Narrow Ranges -- QQQ Gap -- Gold Resistance -- Zweig Breadth Thrust
by Arthur Hill,
Chief Technical Strategist, TrendInvestorPro.com
Stymied Indexes Form Narrow Range Days
Stocks stalled on Monday with mixed action in the major index ETFs. Stalling or sideways price action reflects a stand-off between bulls and bears (buying pressure and selling pressure). Note that the price range over the last two trading days has also been extremely...
READ MORE
MEMBERS ONLY
What Makes A Bear Market?
by Tom Bowley,
Chief Market Strategist, EarningsBeats.com
Market Recap for Monday, October 12, 2015
It was a relatively quiet session as many market participants shied away from action in observance of Columbus Day. NASDAQ volume was only 1.33 billion shares, extremely light compared to recent sessions. Still, the bulls managed to remain in control of the...
READ MORE
MEMBERS ONLY

Is it Time for a Digestion of Recent Equity Gains?
by Martin Pring,
President, Pring Research
* The 8/16 PPO for the SPX is overbought
* Nasdaq is running into major resistance
* The HYG experiences a false upside breakout and a bearish shooting star
The week before last, I drew your attention to the fact that since the August sell-off recent market gyrations had been truncated in...
READ MORE
MEMBERS ONLY
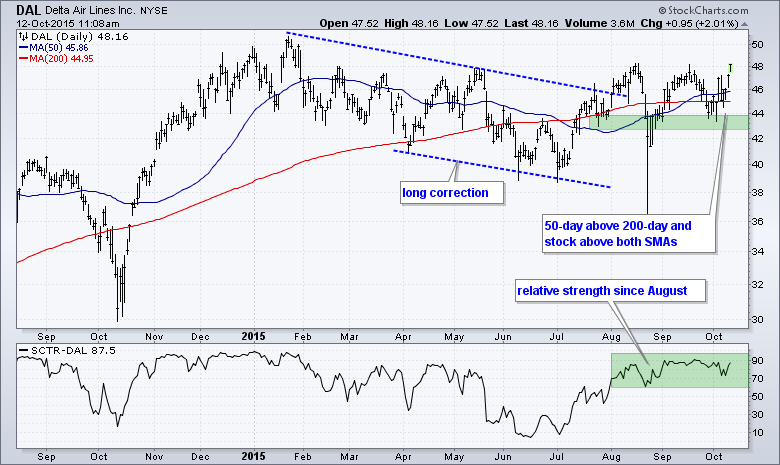
Delta and SouthWest Go For Breakouts
by Arthur Hill,
Chief Technical Strategist, TrendInvestorPro.com
Airline stocks are on the move Monday with nice gains across the board. Hawaiian Airlines (HA) and Skywest (SKYW) are leading the way with breakouts and 52-week highs today. These two have the highest StockCharts Technical Rank (SCTR) of the group and are clearly the strongest of the pack. There...
READ MORE
MEMBERS ONLY
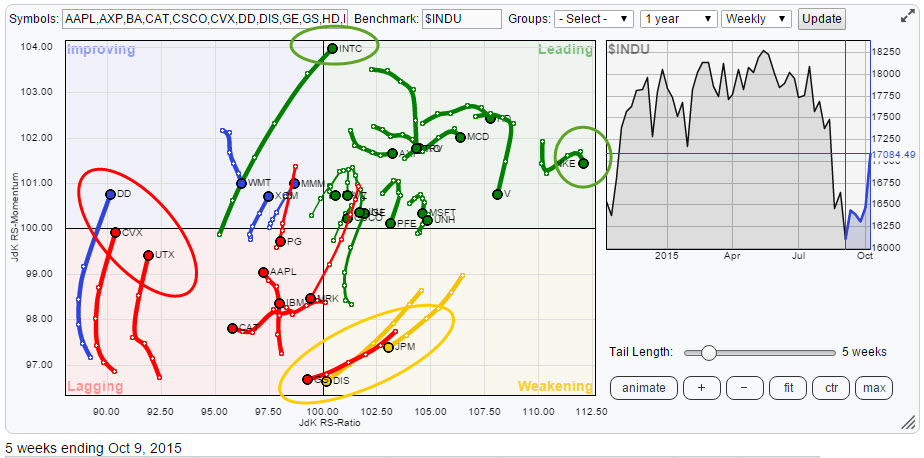
Intel (INTC) power inside!

by Julius de Kempenaer,
Senior Technical Analyst, StockCharts.com
In my recurring cycle of blog subjects, it is time to take a look at the components of the Dow Jones Industrials index again.
Once again there is a lot to see on the Relative Rotation Graph for this universe. We have GS, JPM and DIS nose-diving into the lagging...
READ MORE
MEMBERS ONLY
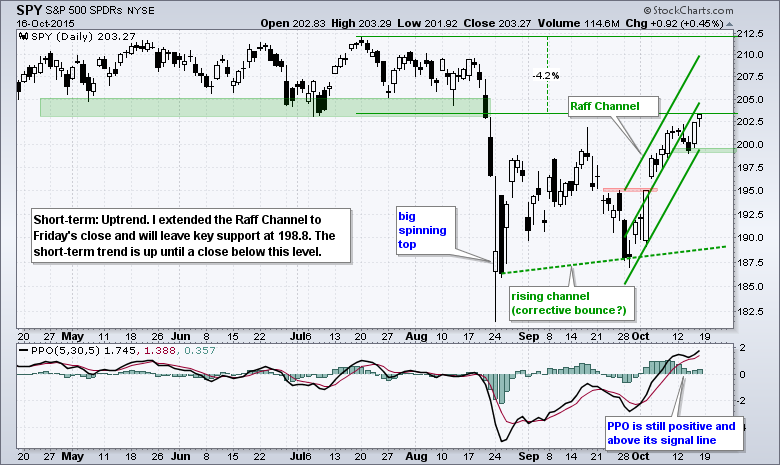
Up Big, but Still Down -- Raff Channels Define Trend -- Finance and Utilities Lag -- Banking ETFs Form Bearish Candles
by Arthur Hill,
Chief Technical Strategist, TrendInvestorPro.com
The major index ETFs are nearing their moment-of-truth as the smaller uptrends start to challenge the bigger downtrends. I am still assuming that the August breakdowns signaled the start of a bigger downtrend. While I do not know how long this downtrend will last, I have yet to get a...
READ MORE
MEMBERS ONLY
Key Long-Term Moving Averages Being Tested
by Tom Bowley,
Chief Market Strategist, EarningsBeats.com
Market Recap for Friday, October 9, 2015
There wasn't much news out towards the end of last week so all eyes were on overseas action and technical developments here in the U.S. Of course, earnings season is kicking into gear and that now becomes more of a...
READ MORE
MEMBERS ONLY
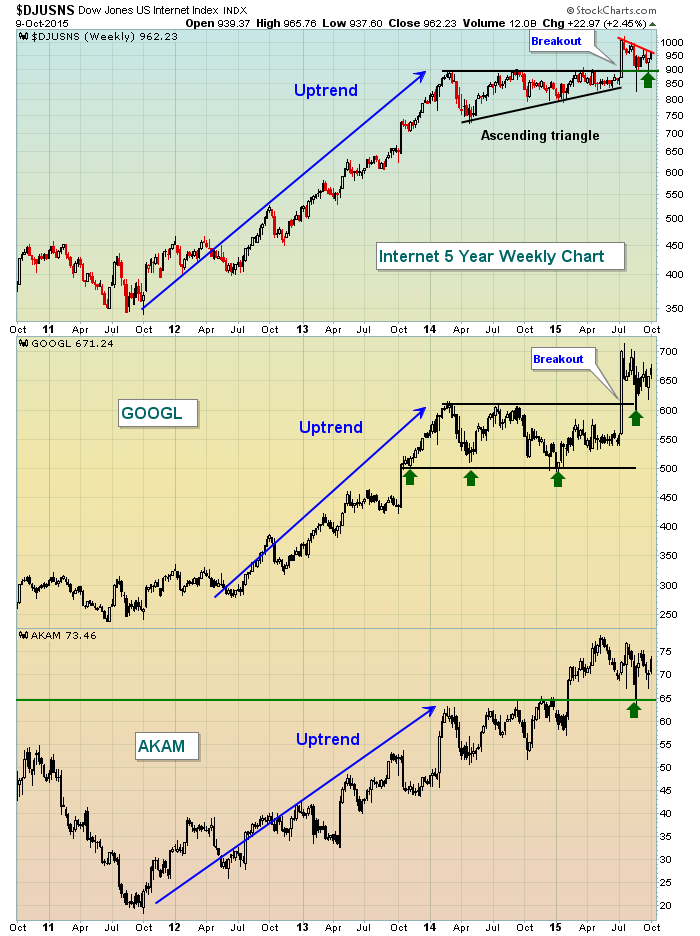
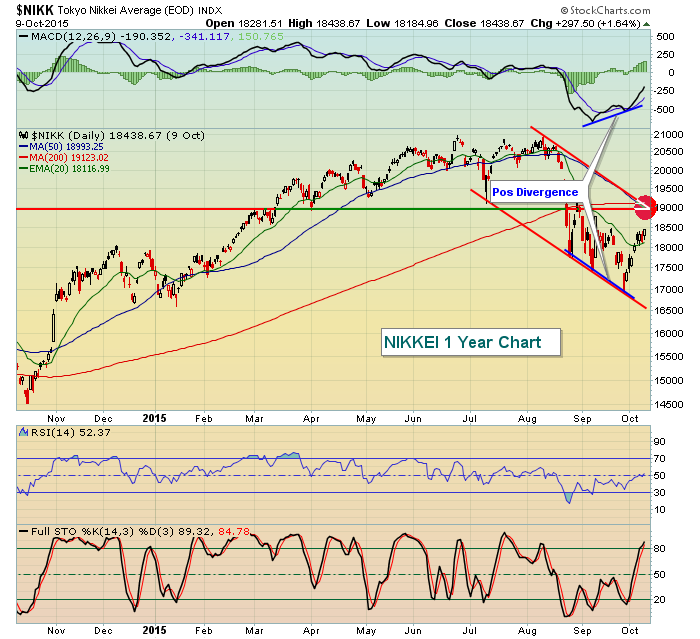
Internet Group Poised For Higher Prices
by Tom Bowley,
Chief Market Strategist, EarningsBeats.com
The long-term pattern is bullish. Short-term technical conditions are improving. And the season is right as October is the best calendar month of the year in terms of historical performance for internet stocks. The Dow Jones U.S. Internet Index ($DJUSNS) looks poised for another explosion to the upside. We&...
READ MORE
MEMBERS ONLY
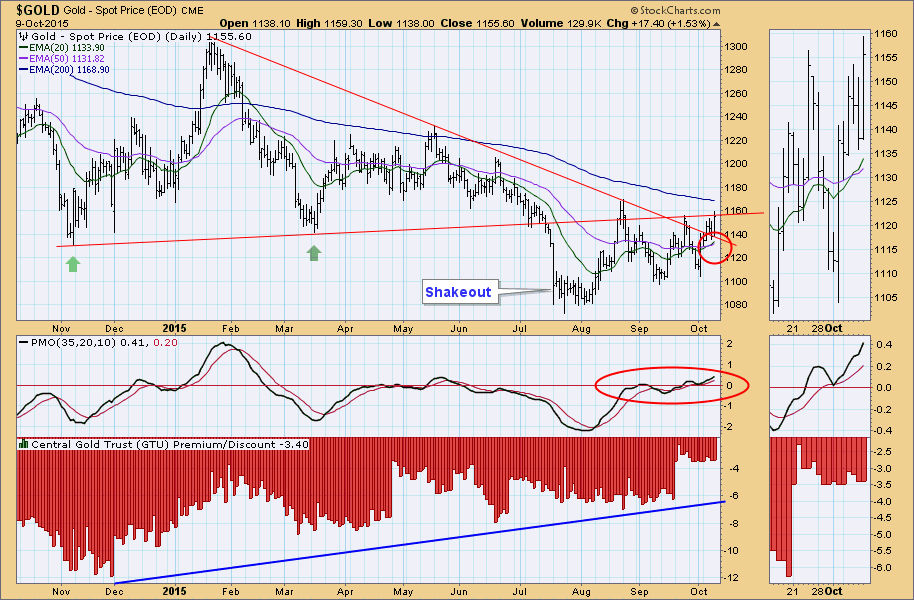
Gold: New BUY Signal
by Carl Swenlin,
President and Founder, DecisionPoint.com
On Wednesday of last week $GOLD generated a DecisionPoint Trend Model BUY signal when the 20EMA crossed up through the 50EMA. As we frequently stress, these signals are intended to be information flags, not action flags. They should prompt investigation, not blind response.
Looking at the one-year chart above we...
READ MORE
MEMBERS ONLY

This is How to Maximize Your Investor Benefits
by Gatis Roze,
Author, "Tensile Trading"
After writing this column for over three years, I was recently asked by a reader what he should expect to get out of my weekly blog. In other words, he asked me for a users manual to The Traders Journal. No kidding – I looked on Amazon and found manuals for...
READ MORE
MEMBERS ONLY
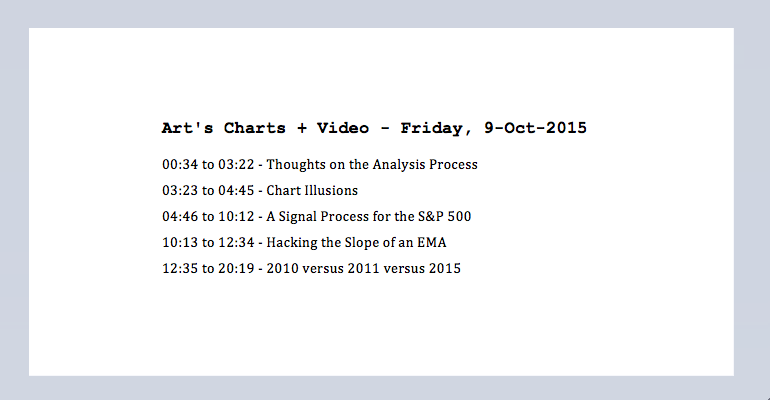
Thoughts on the Analysis Process -- A Signal Process for the S&P 500 -- Hacking the Slope of an EMA -- 2010 versus 2011 versus 2015
by Arthur Hill,
Chief Technical Strategist, TrendInvestorPro.com
Before looking at some charts to establish the bigger trend, I would like to philosophize a little on the analysis process and my approach. I use basic chart analysis and some simple trend-following indicators to define the trend and trade accordingly. My main goal is to be as OBJECTIVE as...
READ MORE
MEMBERS ONLY

BREADTH INDICATORS TURN UP -- DOLLAR WEAKNESS SHOULD START TO HELP EARNINGS -- SO SHOULD A REBOUND IN ENERGY AND MATERIALS -- AND A REBOUND IN EMERGING MARKETS -- UPTURN IN EM CURRENCIES SUPPORTS EM STOCK ADVANCE
by John Murphy,
Chief Technical Analyst, StockCharts.com
PERCENT OF STOCKS ABOVE MOVING AVERAGE LINES TURNS UP ... Breadth indicators continue to show marked improvement. My Wednesday message showed the percent of NYSE stocks above their 50-day average turning up. I stated that it needed to climb above 50% to turn its trend higher. The blue line in Chart...
READ MORE
MEMBERS ONLY
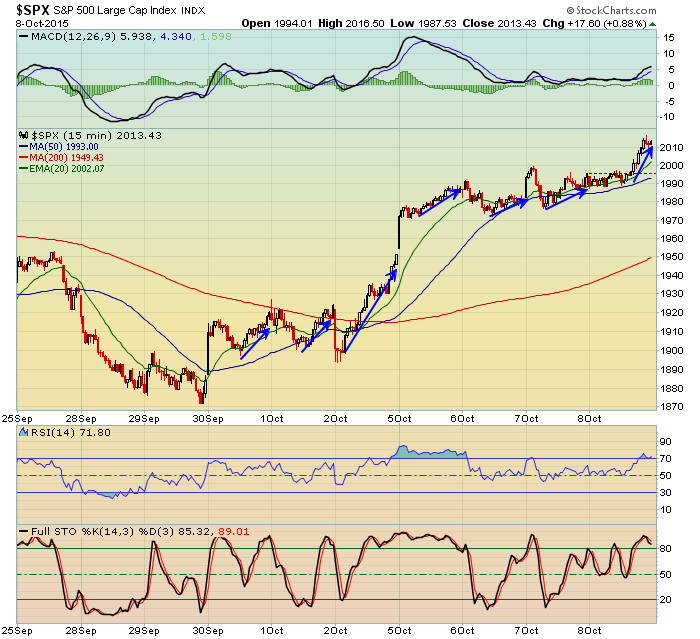
Selling Of Treasuries Helps To Fuel Market Rally
by Tom Bowley,
Chief Market Strategist, EarningsBeats.com
Market Recap for Thursday, October 8, 2015
One very good thing has emerged lately with respect to the U.S. stock market. It trends higher into the close and afternoon buying is generally healthy market action. The S&P 500 has now finished higher 7 of the last 8...
READ MORE