MEMBERS ONLY
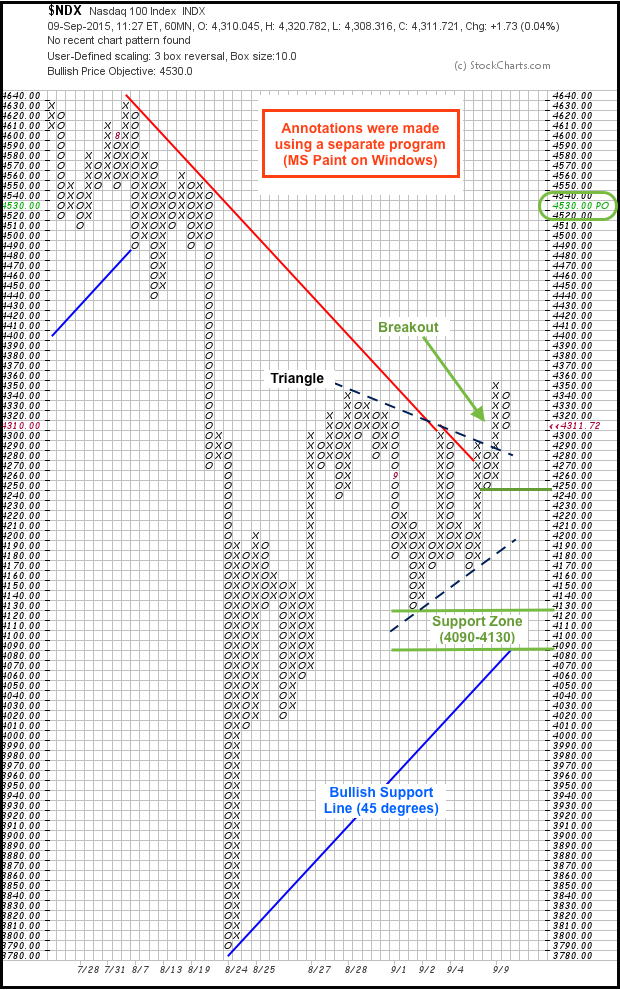
Plotting the Nasdaq 100 Breakout on an Intraday Point & Figure Chart

by Arthur Hill,
Chief Technical Strategist, TrendInvestorPro.com
StockCharts users can create intraday P&F charts to shorten their time horizon and identify key levels to watch. The chart below is a 60-minute P&F chart with 10 points per box and a classic 3-box reversal. After plunging to 3790 in mid August, the Nasdaq 100...
READ MORE
MEMBERS ONLY
Another Test of Critical Resistance

by Tom Bowley,
Chief Market Strategist, EarningsBeats.com
Market Recap for Tuesday, September 8, 2015
As we've seen often of late, the U.S. equity markets surged at the open but failed to add to those opening gains until the final 90 minutes of trading. At that point, buying resumed and all of our major indices...
READ MORE
MEMBERS ONLY
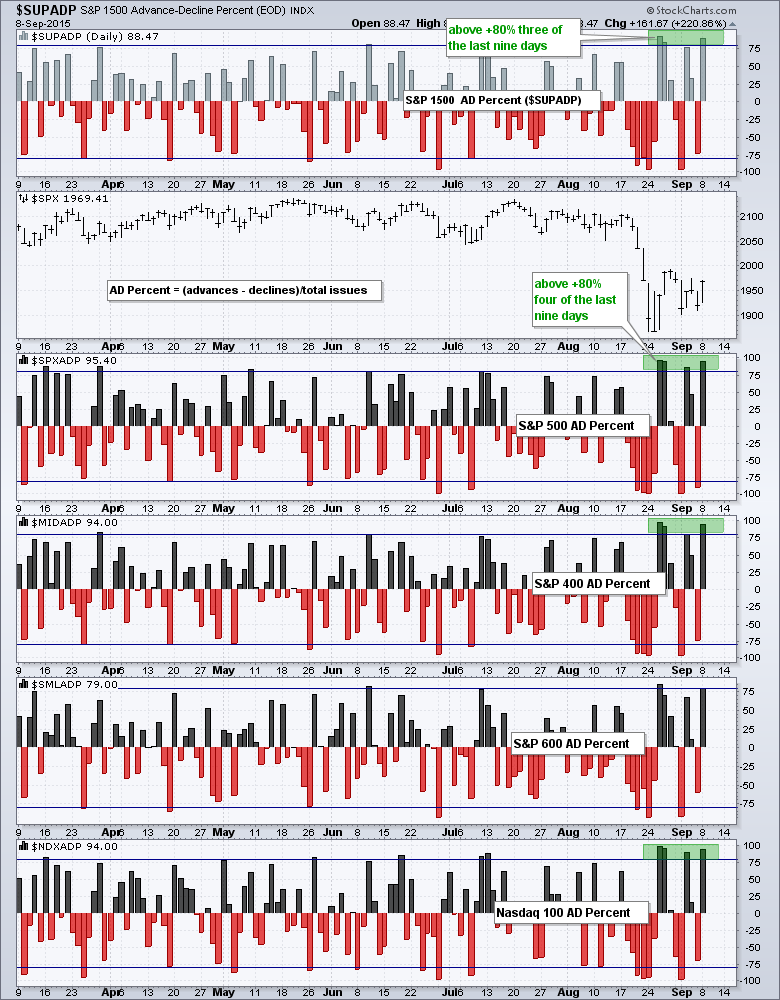
A Bullish Breadth Thrust in the Making - Index and Sector Breadth Overview
by Arthur Hill,
Chief Technical Strategist, TrendInvestorPro.com
Breadth was exceptionally strong the last two weeks and the broad market indices are on the verge of a bullish breadth thrust. Despite a couple big down days last week, AD Percent for the major index ETFs put in four strong readings in the last nine trading days. Note that...
READ MORE
MEMBERS ONLY
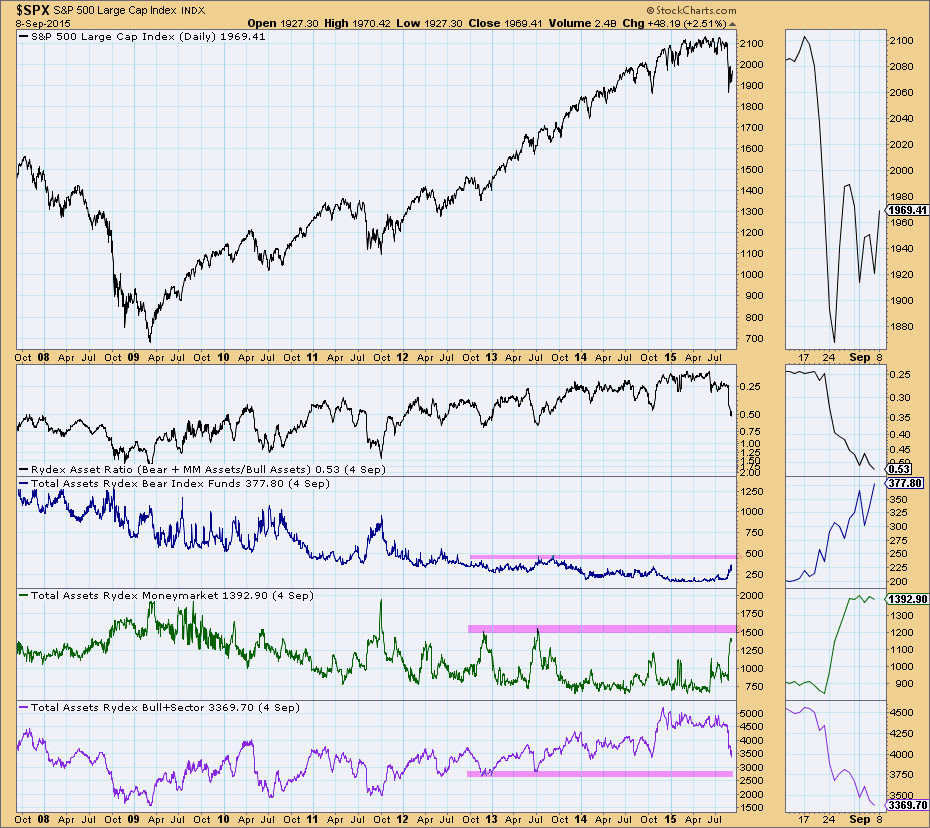
Rydex Assets and Sentiment Offer Insight

by Erin Swenlin,
Vice President, DecisionPoint.com
As part of a comment on Friday's DecisionPoint Alert, I was asked to review the DecisionPoint sentiment charts. Significant market tops and bottoms are normally accompanied by extremes of sentiment in one direction, and that is a strong indication that the market is about to head in the...
READ MORE
MEMBERS ONLY

EEM ISHARES BOUNCE OFF 2011 LOW -- EAFE ISHARES ALSO HOLD SUPPORT -- OVERSOLD CANADIAN STOCKS REBOUND -- U.S. STOCKS HAVE STRONG DAY TO STAY WITHIN RECENT TRADING RANGE -- BOND YIELDS BOUNCE AS MONEY LEAVES BONDS FOR STOCKS -- VIX RETREATS ANOTHER 10%

by John Murphy,
Chief Technical Analyst, StockCharts.com
EMERGING MARKETS BOUNCE OFF CHART SUPPORT... Within the exception of Japan, global stocks are bouncing nicely today. It started in Asia with a rebound in Chinese stocks. That gave a much needed boost to emerging markets. And it may be coming just in time. The monthly bars in Chart 1...
READ MORE
MEMBERS ONLY
Which Way Is The U.S. Stock Market Headed?
by Tom Bowley,
Chief Market Strategist, EarningsBeats.com
Market Recap for Friday, September 4, 2015
Volatility remains the key for traders. A Volatility Index (VIX) in the 20s and 30s suggests that we not only could wake up to anything, but that we also should expect to see wild swings both higher and lower during the trading day....
READ MORE
MEMBERS ONLY
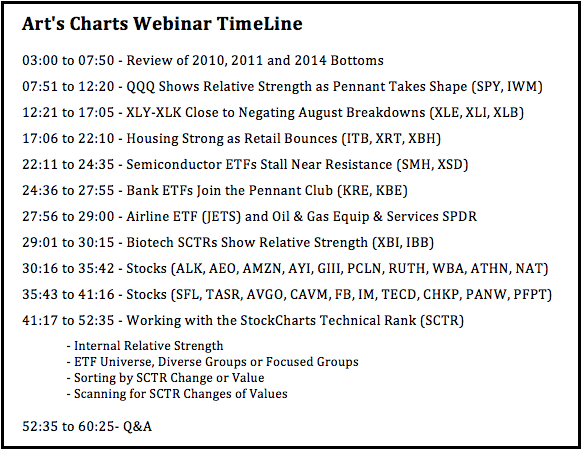
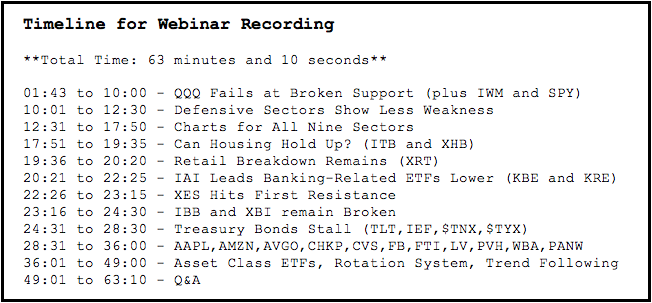
August Break Downs Rule Medium-Term, but Bullish Pennants Shake Up the Short-Term - Webinar Recording
by Arthur Hill,
Chief Technical Strategist, TrendInvestorPro.com
Click here for the recording
QQQ Shows Relative Strength as Pennant Takes Shape
There are two narratives at work in the stock market and these are reflected on the charts for QQQ, SPY and IWM. First, we have a big support break in August and this break down is medium-term...
READ MORE
MEMBERS ONLY
August 25th - the Birth of a New Market?
Hello Fellow ChartWatchers!
We have lots to talk about since our last newsletter! For those of you who have been watching the "ChartWatchers LIVE" webinar, you know that for almost three months prior to the recent market collapse on August 19th, we had been expressing concerns over the...
READ MORE
MEMBERS ONLY
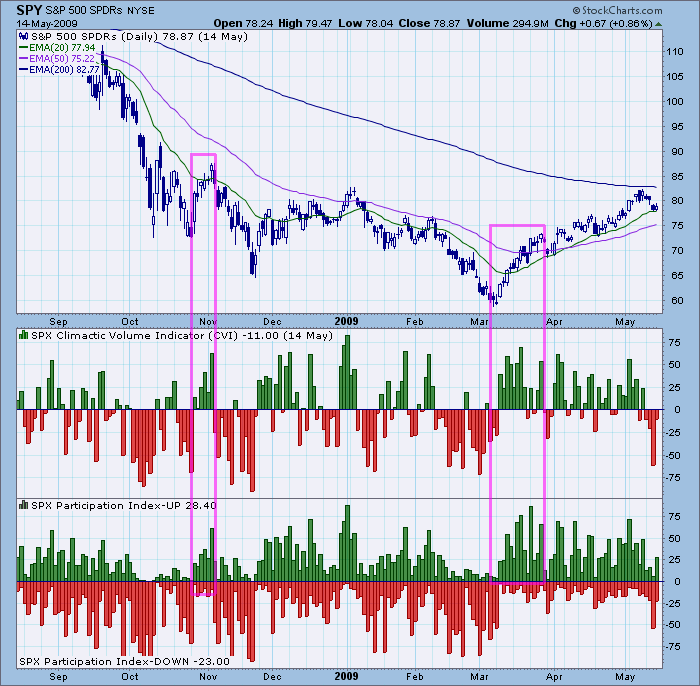
Big Rally, Anti-Climax

by Carl Swenlin,
President and Founder, DecisionPoint.com
In the last two weeks I observed something I don't recall ever seeing before. Two market indicators, that I never fail to review at the end of every trading day, are the Climactic Volume Indicator (CVI) and the UP and DOWN Participation Indexes (PI). The CVI is based...
READ MORE
MEMBERS ONLY
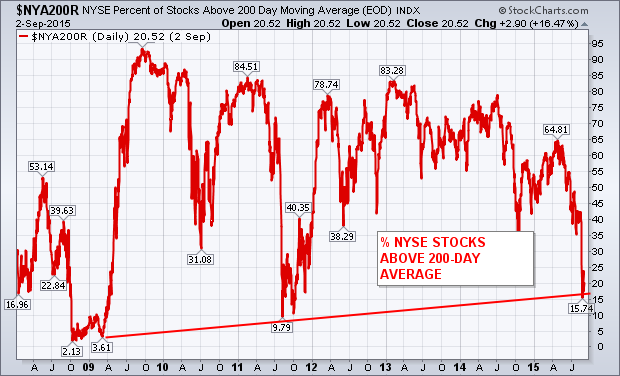
NYSE Percent of Stocks Above 200-Day Average Stabilizes
by John Murphy,
Chief Technical Analyst, StockCharts.com
One of the warnings that I wrote about over the summer was the drop in the percent of NYSE stocks trading over their 200-day average. I pointed out over the summer (before the August plunge) that a stock market couldn't maintain an uptrend while two-thirds of its stocks...
READ MORE
MEMBERS ONLY
It's True...The Only Thing We Have to Fear is Fear Itself

by John Hopkins,
President and Co-founder, EarningsBeats.com
We've all heard that famous quote from Franklin D. Roosevelt in his first inaugural address. It's a saying that has had staying power for over 80 years. And it's something that rings true today in the current and volatile market environment.
It starts with...
READ MORE
MEMBERS ONLY
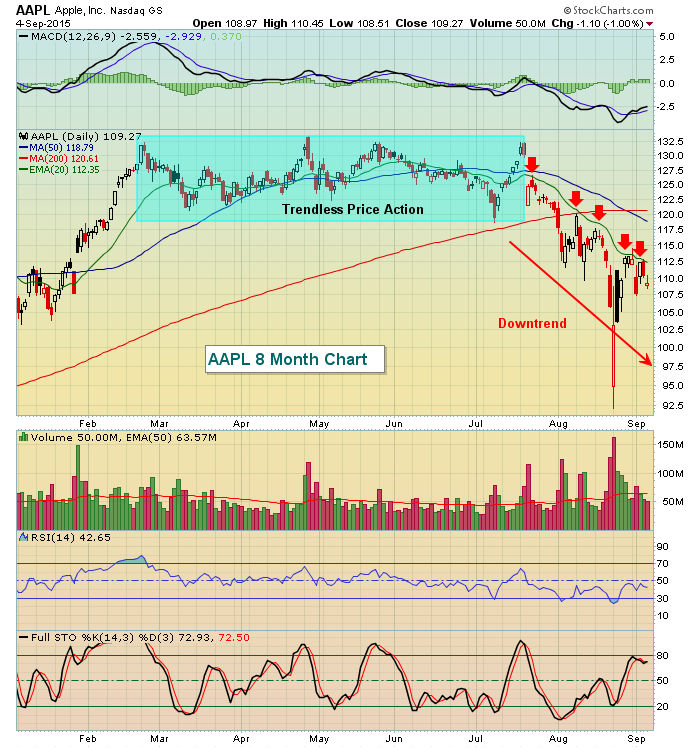
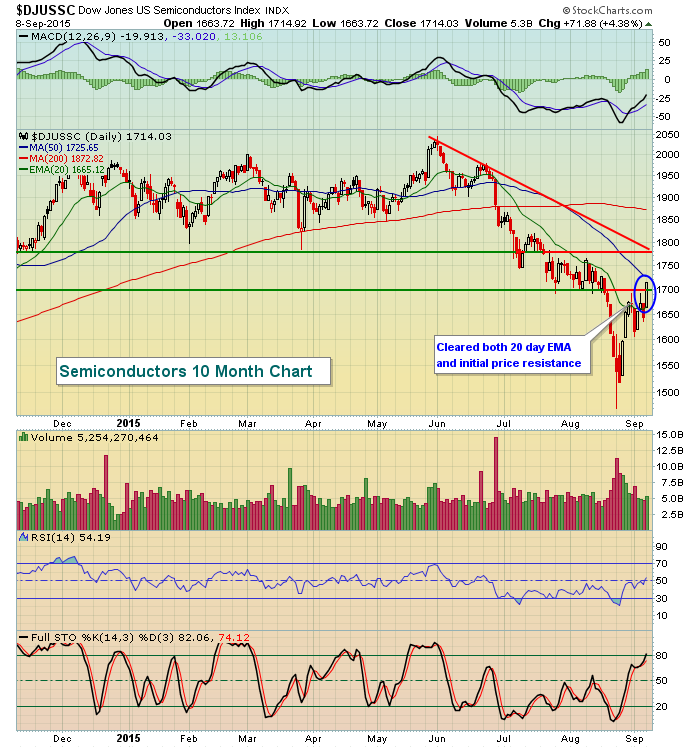
20 Day EMAs Are Huge Technical Weapons
by Tom Bowley,
Chief Market Strategist, EarningsBeats.com
Moving averages are lagging overlays by definition as we use historical data to determine their position on a price chart. But many traders use moving averages as support during periods of trending prices. Personally, my favorite is the 20 period EMA. Obviously, it can't guarantee us support in...
READ MORE
MEMBERS ONLY
This Bearish Story Might Be Fiction
by Tom Bowley,
Chief Market Strategist, EarningsBeats.com
There are plenty of technical analysts calling for the beginning of a bear market after the past couple weeks of heavy volume selling. I'm certainly open to that possibility as I always respect price support breakdowns with accelerating volume. But the story behind the scenes isn't...
READ MORE
MEMBERS ONLY
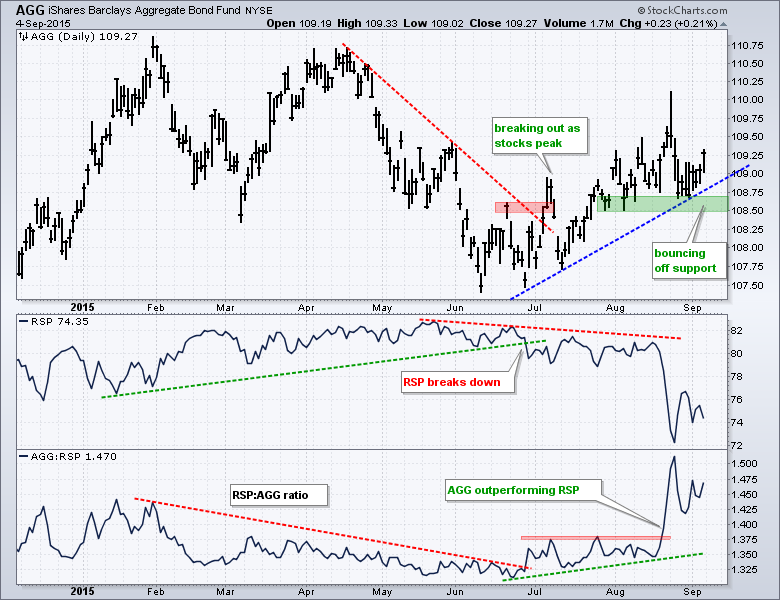
Bonds Hold Trend and Outperform Stocks
by Arthur Hill,
Chief Technical Strategist, TrendInvestorPro.com
Bonds are outperforming stocks as money flows into relative safety and shuns risk. Overall, relative strength in bonds reflects risk aversion in the financial markets. Relative strength in bonds also indicates that investors should prefer bonds over stocks right now. Like all market dynamics, it is subject to change, but...
READ MORE
MEMBERS ONLY
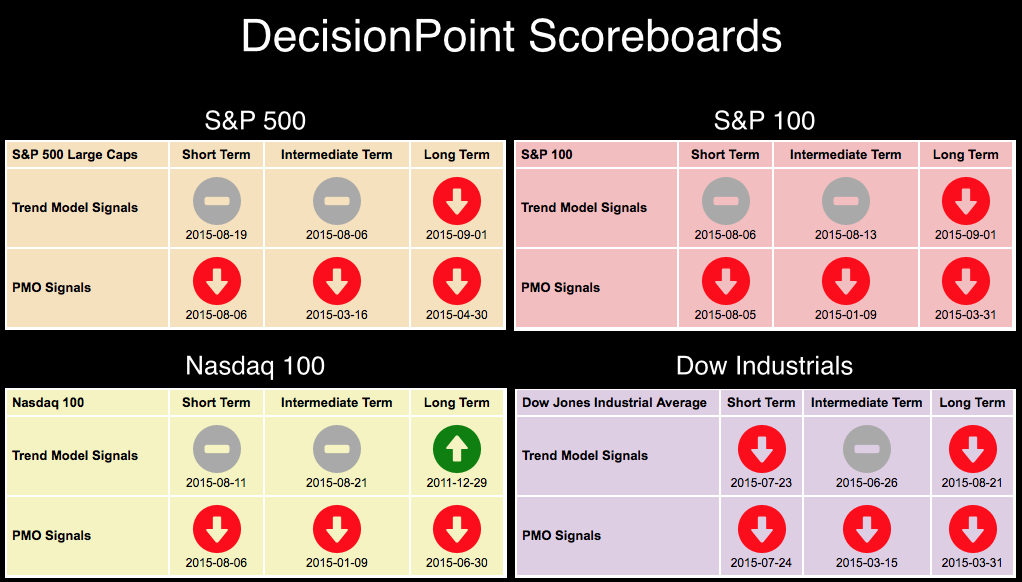
Dollar and Commodities Only Issues in DP Market/Sector Summary with Rising 20-EMAs
by Erin Swenlin,
Vice President, DecisionPoint.com
Take a look at the DecisionPoint Scoreboard for last week. (You'll find the Scoreboards in the DecisionPoint Chart Gallery. The link is on the homepage). If you've read any of my articles this week, you'll know that the new Long-Term Trend Model (LTTM) 50/...
READ MORE
MEMBERS ONLY

Compare Your Traders Journal to Mine

by Gatis Roze,
Author, "Tensile Trading"
I’ll show you mine, if you show me yours! What were you thinking? We are talking journals here. During periods of extreme market volatility – such as we presently have – no action can be the right action to achieve your long term goals. Understand that periodic corrections are to be...
READ MORE
MEMBERS ONLY
Just Charts

by Bruce Fraser,
Industry-leading "Wyckoffian"
A chart is worth a thousand words. So let’s study some charts. We continue our discussion of Distribution and review some additional examples. Our goal is chart reading mastery. The ability to see changing price conditions, in real time, is an important long term goal. This takes time, practice...
READ MORE
MEMBERS ONLY
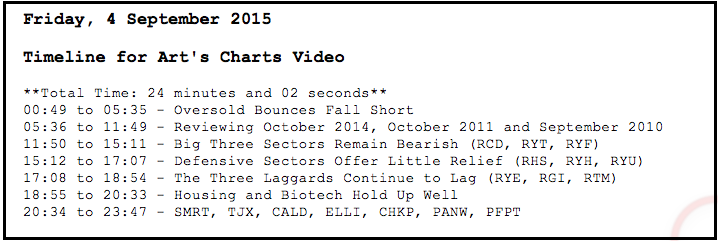
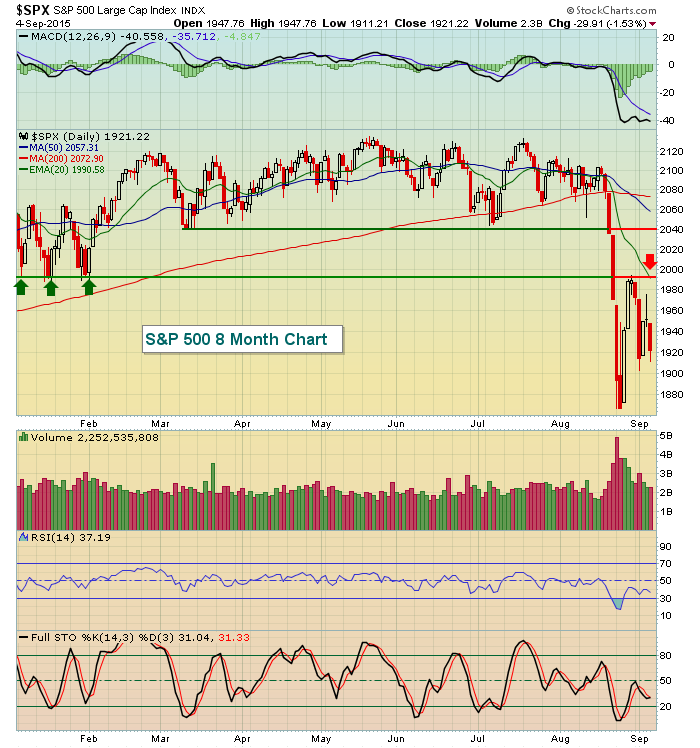
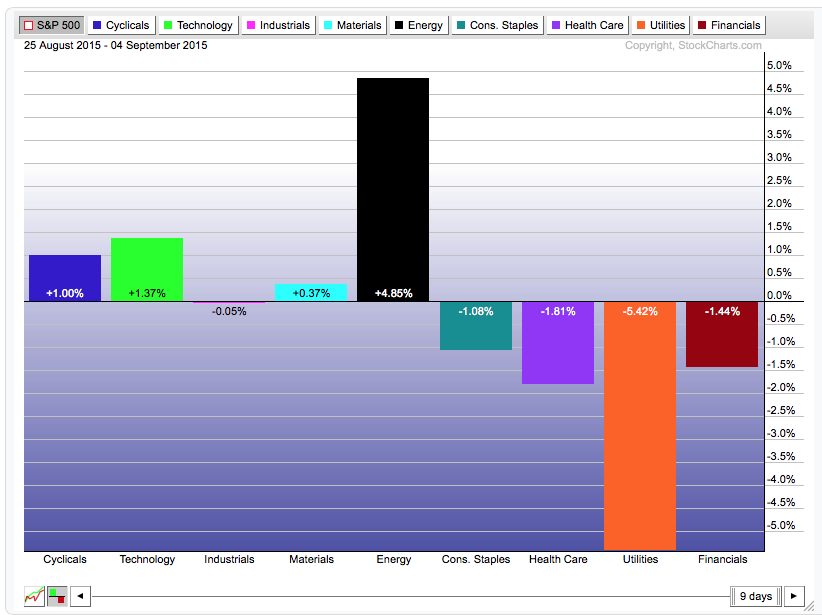
Oversold Bounces Fall Short, Reviewing Bottoms in 2014, 2011 and 2010, Big Three Sectors Remain Bearish, Defensive Sectors Offer Little Relief, Housing and Biotech Hold Up
by Arthur Hill,
Chief Technical Strategist, TrendInvestorPro.com
Oversold Bounces Fall Short
The overall trend remains down for the major index ETFs (QQQ, SPY and IWM). Trading turned volatile with the mid August breakdowns, but the breakdowns remain and these are the dominant feature on most stock-related charts. Current volatility makes it hard to determine what will happen...
READ MORE
MEMBERS ONLY
Will We See September 4th Fireworks?
by Tom Bowley,
Chief Market Strategist, EarningsBeats.com
Market Recap for Thursday, September 3, 2015
First, if you're available, be sure to join me at noon EST today for my Trading Places LIVE webinar. It's free and you can register HERE. Also, you can "subscribe" to my blog and have this morning...
READ MORE
MEMBERS ONLY

TLT is the Only (Somewhat) Bright Spot on the Market/Sector Summary
by Erin Swenlin,
Vice President, DecisionPoint.com
Every day, we publish a complete Market/Sector Summary in the DP Reports Blog. Not many are aware of its usefulness or even its existence! I publish an excerpt from that report every day in the DecisionPoint Alert day's analysis blog. Something very interesting has been happening on...
READ MORE
MEMBERS ONLY
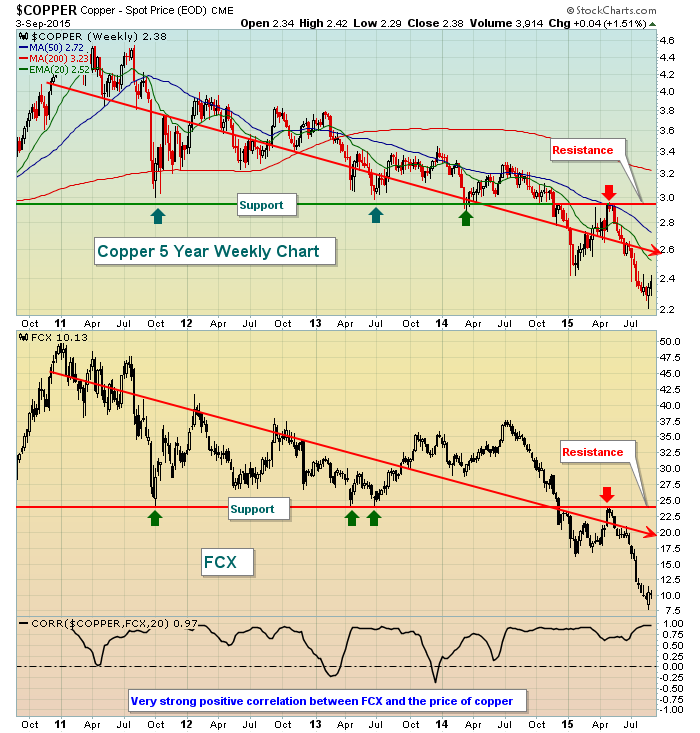
Has Carl Icahn Timed His FCX Investment Correctly?
by Tom Bowley,
Chief Market Strategist, EarningsBeats.com
One week ago activist investor Carl Icahn disclosed that a group he belongs to owns nearly an 8.5% stake in Freeport-McMoran (FCX). Rumors suggest Icahn may seek representation on FCX's board of directors and is calling for changes in some of the Company's business practices....
READ MORE
MEMBERS ONLY

BANKS AND SEMICONDUCTORS BOUNCE OFF MAJOR SUPPORT LEVELS -- LONGER RANGE CHARTS SUGGEST CURRENT PULLBACK IS A CORRECTION IN A LONGER RANGE UPTREND -- HOMEBUILDERS SHOW RELATIVE STRENGTH -- DR HORTON IS HOMEBUILDING AND MARKET LEADER
by John Murphy,
Chief Technical Analyst, StockCharts.com
BANKS BOUNCE OFF CHART SUPPORT... I've explained in previous messages that I lean toward the view that the stock market is in the midst of an overdue correction. It's been four years since the market saw a correction of more than 10%. That's much...
READ MORE
MEMBERS ONLY
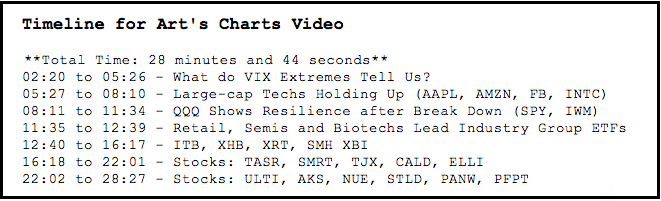
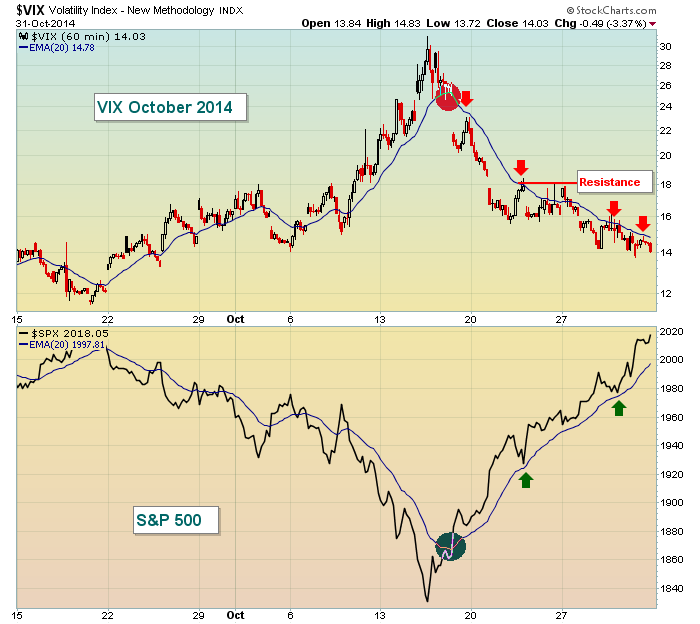
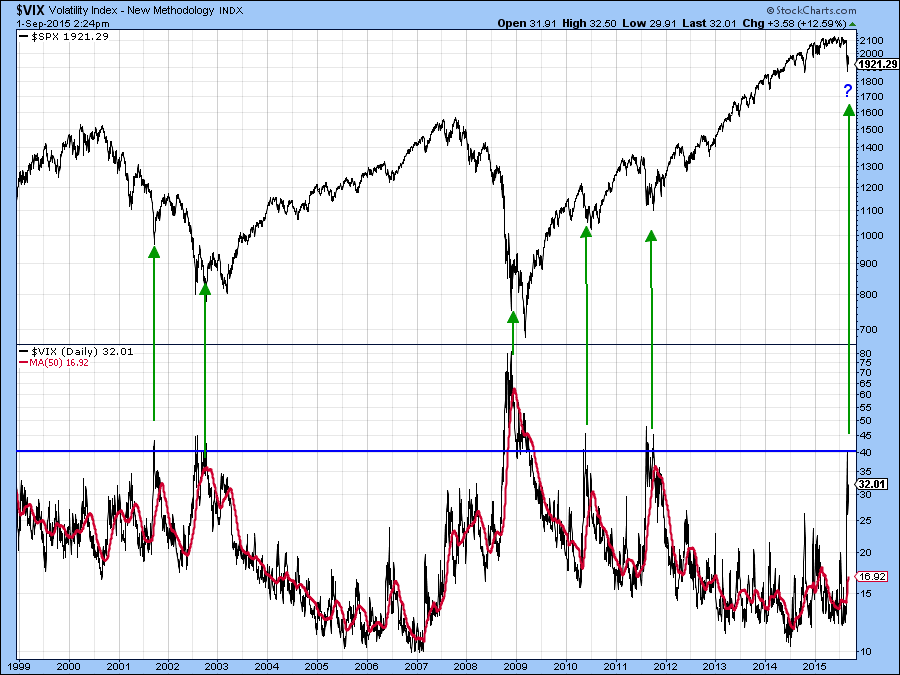
Trading VIX Extremes, Big Techs Hold Up Well, QQQ Rebounds, Housing Holds, XRT Finishes Strong, Semis Surge and 11 Stocks to Watch
by Arthur Hill,
Chief Technical Strategist, TrendInvestorPro.com
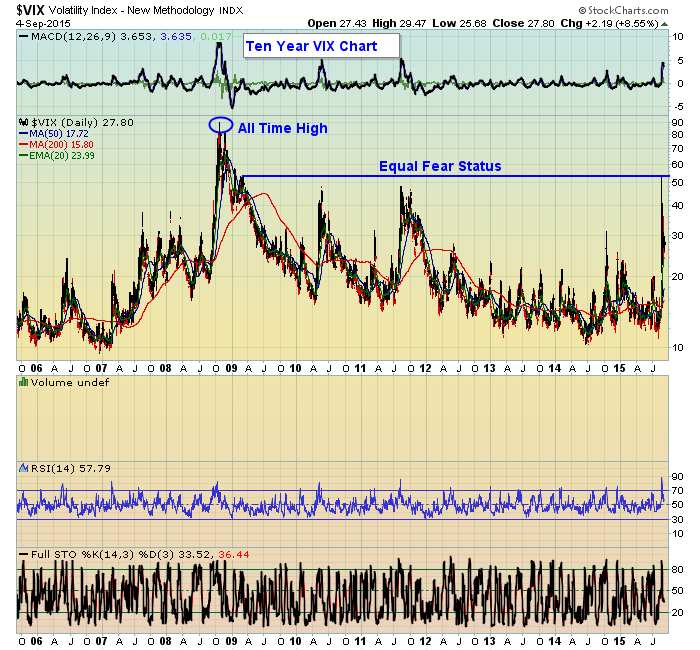
What do VIX Extremes Tell Us?
Even though it can be difficult to trade based on extremes, note that the volatility indices are at extremes that suggest plenty of fear and this could foreshadow a bounce. The first chart shows daily closing values for the S&P 500 Volatility...
READ MORE
MEMBERS ONLY
Final 30 Minute Rally Sets Up Thursday Test
by Tom Bowley,
Chief Market Strategist, EarningsBeats.com
Market Recap for Wednesday, September 2, 2015
The bulls did not crumble on Wednesday. After a big gap down on Tuesday with the market closing at or near its lows of the day, there was the opportunity for the bears of another serious gap lower and rout on Wednesday, but...
READ MORE
MEMBERS ONLY
Get a burger at MCD and help the stock stand out from the crowd

by Julius de Kempenaer,
Senior Technical Analyst, StockCharts.com
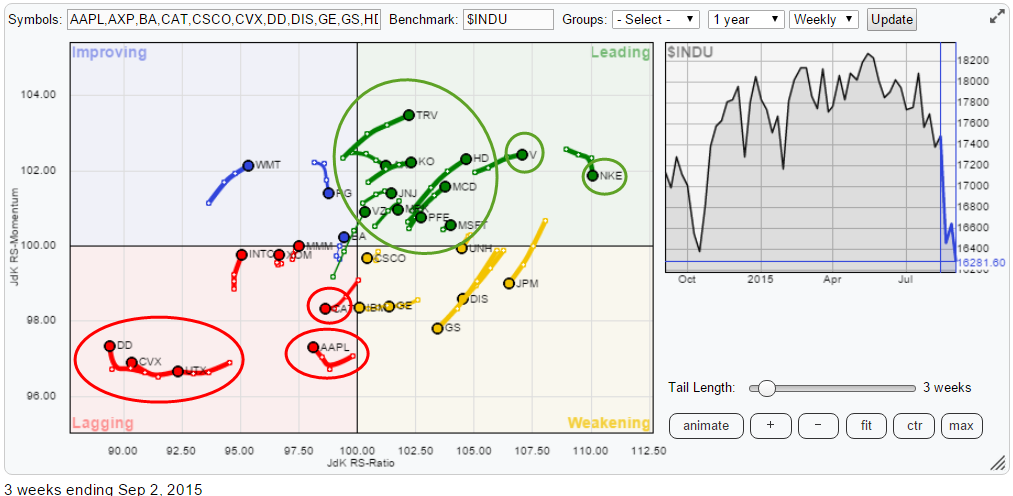
This article takes a look at the relative rotation of the members of the Dow Jones Industrials ($INDU) index. On the relative rotation graph below all members are plotted against $INDU. I will highlight and discuss some of the charts that show up on the RRG as "worth having...
READ MORE
MEMBERS ONLY
5 Airline Stocks with Strong SCTRs and 6 Charts worth Watching
by Arthur Hill,
Chief Technical Strategist, TrendInvestorPro.com
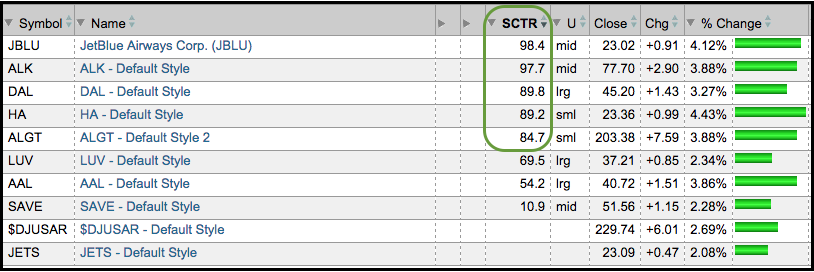
This is just a quick and dirty note regarding today's strength in airline stocks. The table below shows eight airline stocks, the Airline ETF (JETS) and the DJ US Airline Index ($DJUSAR). Notice that the StockCharts Technical Rank (SCTR) for two stocks is above 90 (JBLU and ALK)...
READ MORE
MEMBERS ONLY

WHAT'S THE DIFFERENCE BETWEEN A CORRECTION AND A BEAR MARKET? -- LONG-TERM SUPPORT LEVELS FOR S&P 500 -- STOCKS REMAIN IN TRADING RANGE WHICH IS LIKELY TO CONTINUE -- VIX RETREATS
by John Murphy,
Chief Technical Analyst, StockCharts.com
WHAT'S THE DIFFERENCE? ... There's a debate in professional circles as to whether the stock market is in a correction or a bear market. It makes a difference. Let's define what they are. A stock market "correction" is a drop of more than...
READ MORE
MEMBERS ONLY
One Group and 3 Stocks Showing Relative Strength on Tuesday
by Arthur Hill,
Chief Technical Strategist, TrendInvestorPro.com
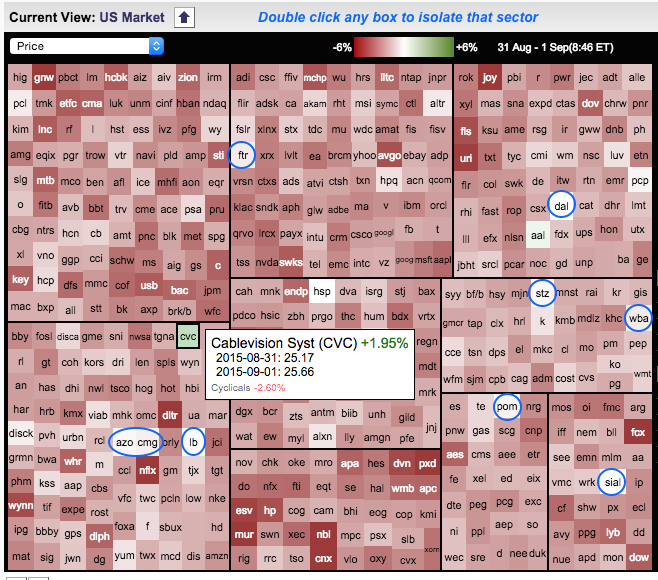
Selling pressure was quite intense on Tuesday as some 497 stocks in the S&P 500 declined on the day. This means there were only three winners on the day: CableVision (CVC), American Airlines (AAL) and Sigma-Aldrich (SIAL), which is going to be acquired by Merck. Cablevision, which is...
READ MORE
MEMBERS ONLY
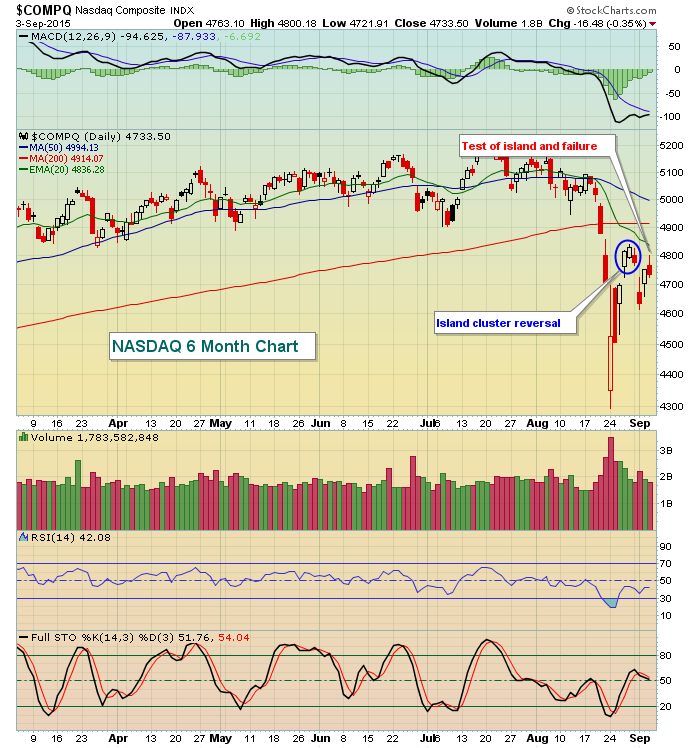
Island Cluster Reversal Confirmed By Tuesday's Action
by Tom Bowley,
Chief Market Strategist, EarningsBeats.com
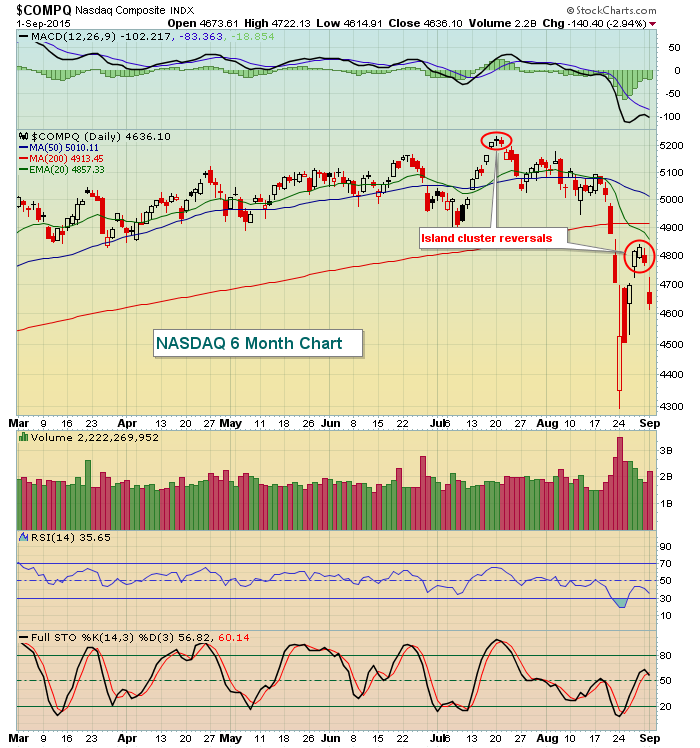
Market Recap for Tuesday, September 1, 2015
Off of the significant rally last week, a topping island cluster reversal pattern printed and was confirmed on Tuesday's open. This pattern, by itself, is simply a short-term reversing pattern and does not suggest a bear market is at hand. Now...
READ MORE
MEMBERS ONLY

Why is this Different from October? - OEX and SPX NEW Long-Term SELL Signals
by Erin Swenlin,
Vice President, DecisionPoint.com
We had two VERY important signal changes today! Both the S&P 500 and S&P 100 generated Long-Term Trend Model SELL signals. This is very serious, especially given that the Dow Industrials already received a LT SELL signal on August 21st. I've gotten many emails...
READ MORE
MEMBERS ONLY
Long-term Indicators Signal A Primary Bear Market But Last Monday's Panic Low Ought To Hold For A While

by Martin Pring,
President, Pring Research
* Right shoulder rally is a work in progress.
* Dollar Index showing some technical cracks.
* Gold breaks out against stocks.
Last week I pointed out that the S&P 500 ($SPX), along with several other averages, had experienced a bullish exhaustion day. That fact, along with an excessively high reading...
READ MORE
MEMBERS ONLY
QQQ Fails at Support Break, Defensive Sectors Less Weak, Housing Holds, Retail and Banking Break and Biotechs Weigh
by Arthur Hill,
Chief Technical Strategist, TrendInvestorPro.com
Stock futures are sharply lower on Tuesday morning and this means the oversold bounce is failing below the support break for the major index ETFs, sector ETFs and most industry group ETFs. Stocks became very oversold in mid August and then rebounded with sharp rallies last week. The deeper the...
READ MORE
MEMBERS ONLY
Energy Strong But Resistance Prevails On Major Indices
by Tom Bowley,
Chief Market Strategist, EarningsBeats.com
Market Recap for Monday, August 31, 2015
Technical sellers returned on Monday as our major indices approached key resistance areas. The NASDAQ, in particular, had penetrated into its 4800-4900 resistance area and the bulls were initially rebuffed there. Eight of the nine sectors fell on Monday with energy the only...
READ MORE
MEMBERS ONLY
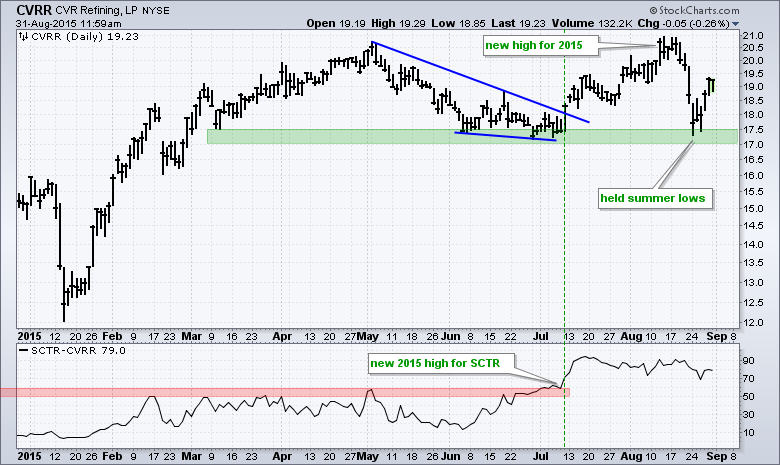
CVR Refining Shows Relative Strength and Chart Strength
by Arthur Hill,
Chief Technical Strategist, TrendInvestorPro.com
Stocks were hit hard in mid August with the S&P 500 and many stocks plunging below their spring-summer lows. This means stocks that held their summer lows are by definition showing relative chart strength because they did not break a key level. The chart below shows CVR Refining...
READ MORE
MEMBERS ONLY

S&P 500 STALLS BELOW BREAK, SMALL-CAPS SHOW RELATIVE STRENGTH, UTILITIES SPDR BREAKS DOWN, TREASURY BONDS FORMS BIG ENGULFING, 10-YR YIELD BOUNCES WITHIN DOWNSWING, GOLD AND SILVER BACK OFF BROKEN SUPPORT ZONES
by John Murphy,
Chief Technical Analyst, StockCharts.com
S&P 500 STALLS WELL BELOW SUPPORT BREAK... Chart 1 shows the S&P 500 with a big support break at 2040 and some serious volatility over the last two weeks. Notice that the index fell over 10% and then bounced with a 5+ percent surge back to...
READ MORE
MEMBERS ONLY

The Misnamed Indicator and More

by Greg Morris,
Veteran Technical Analyst, Investor, and Author
My good friend George Schade, the lawyer, the excellent technical analyst, the market historian, the superb researcher, and the one who has dampened a few of my brusque writings into less offensive prose has given me permission to reproduce an article he wrote in 2011 about an indicator I had...
READ MORE
MEMBERS ONLY
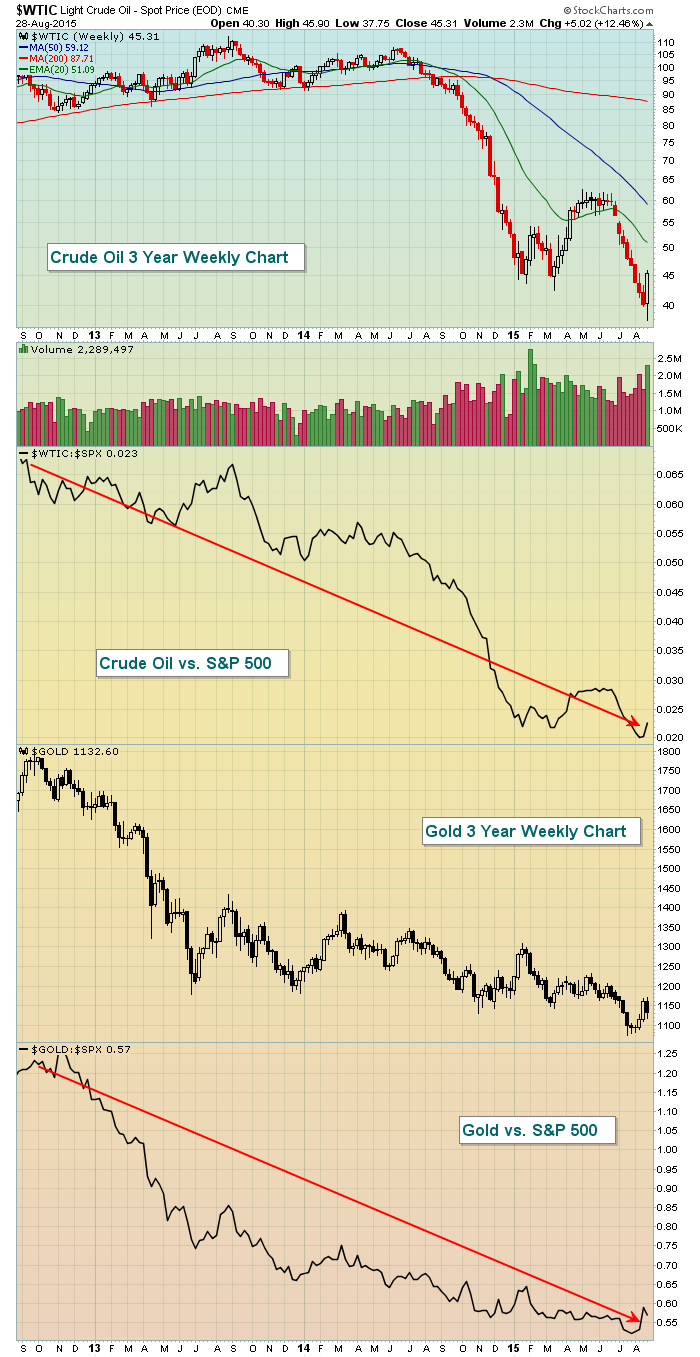
Bulls Rebound Last Week With A Vengeance
by Tom Bowley,
Chief Market Strategist, EarningsBeats.com
Monday, August 31, 2015
Market Recap for Friday, August 28, 2015
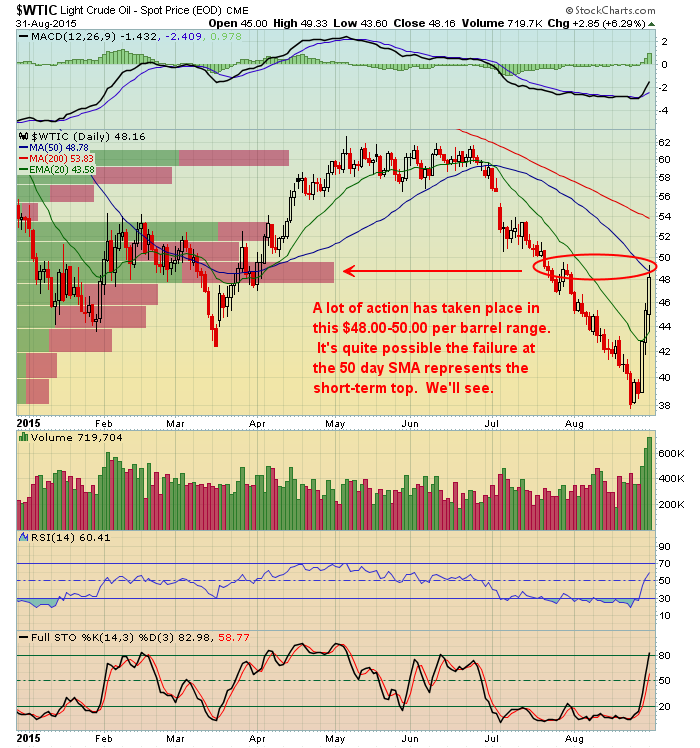
Global markets were mixed on Friday, although most of the action here in the U.S. was positive, albeit on lighter Friday volume. Commodities were particularly strong, especially crude oil ($WTIC) and gold ($GOLD), but both have been long-term...
READ MORE
MEMBERS ONLY
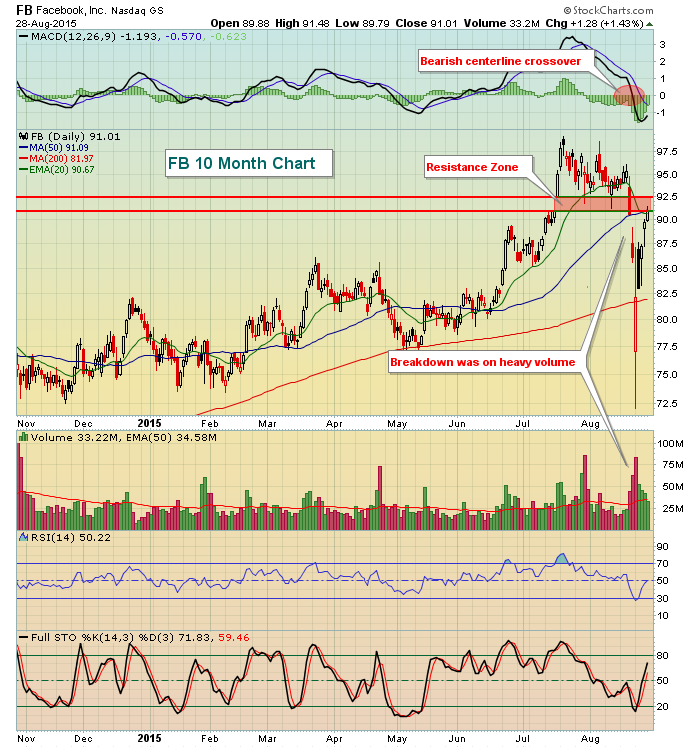
Facebook (FB) One To Watch This Week
by Tom Bowley,
Chief Market Strategist, EarningsBeats.com
Facebook (FB), like so many internet stocks, performs its best during the month of September. There's not much of a sample size with FB since it went public just a little more than 3 years ago. However, during its last 3 Septembers, FB has averaged gaining 15.7%...
READ MORE
MEMBERS ONLY

Taking the Technical Temperature
by Carl Swenlin,
President and Founder, DecisionPoint.com
In the last two weeks the stock market put on quite a show. Many months of sideways boredom was finally ended with a dramatic breakdown and a scary drop of -14.4% (intraday for SPY) from the all-time high in July. From that low, SPY then rebounded nearly +10%. On...
READ MORE
MEMBERS ONLY

Follow the Bouncing Ball
by Bruce Fraser,
Industry-leading "Wyckoffian"
In 1965 Wham-O came out with the Super Ball. About the size of a plum, this hard rubber ball was simply amazing. When dropped on a solid surface it was advertised to bounce back 92%. When slammed down it could be made to bounce over a two story building. For...
READ MORE
