MEMBERS ONLY

FIVE WEAK SECTORS ARE PULLING MARKET LOWER -- ENERGY AND MATERIALS ARE BEING HURT BY FALLING COMMODITIES -- UTILITIES, TELECOM, AND REITS ARE BEING HURT BY FALLING BOND PRICES -- CATERPILLAR AND 3M LEAD INDUSTRIALS LOWER

by John Murphy,
Chief Technical Analyst, StockCharts.com
FIVE SECTORS PULLING S&P 500 LOWER... There are ten major sectors in the S&P 500. Although five of them have held up relatively well, five others are in downtrends and dragging the market lower. Two of the worst sectors are tied to falling commodity prices. Chart...
READ MORE
MEMBERS ONLY
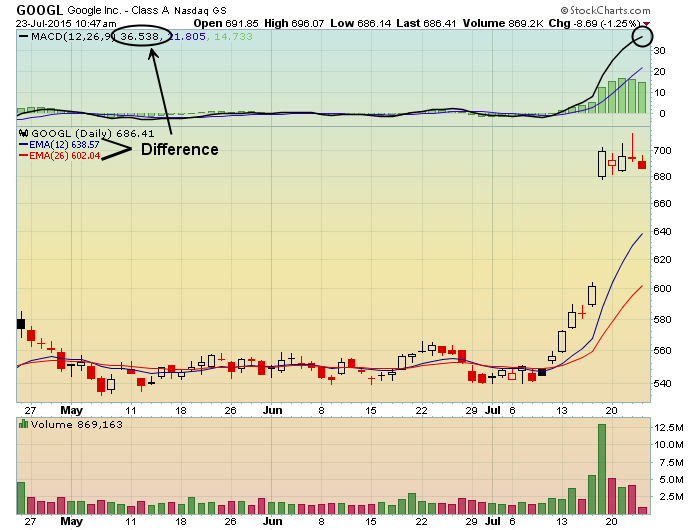
The Power Of The MACD

by Tom Bowley,
Chief Market Strategist, EarningsBeats.com
For me, the Moving Average Convergence Divergence (MACD) trails only the combination of price and volume in my hierarchy of trading tools and indicators. It's THAT good. But it has one major limitation in that it only considers price action, not volume. Hence, it cannot be trusted as...
READ MORE
MEMBERS ONLY
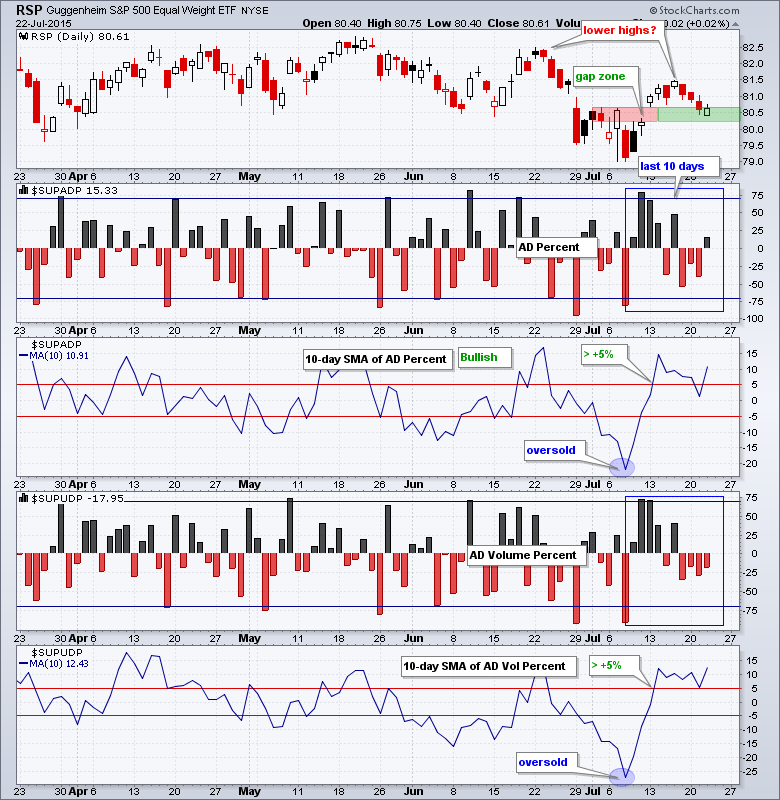
Finance Leads, IWM Hits Gap Zone and TLT Nears Resistance

by Arthur Hill,
Chief Technical Strategist, TrendInvestorPro.com
Stocks were mixed on Wednesday with QQQ taking a big hit and IWM getting a small bounce. The S&P 500 SPDR (SPY) finished modestly lower and the S&P MidCap SPDR (MDY) managed a small gain. It is pretty amazing that small and mid caps were lagging...
READ MORE
MEMBERS ONLY

APPLE, MICROSOFT, AND CHIP STOCKS PULL TECHNOLOGY SECTOR LOWER -- EQUAL WEIGHTED NASDAQ AND TECHNOLOGY ETFS ARE NOT CONFIRMING RECENT ADVANCES -- EQUAL WEIGHTED S&P 500 ETF ALSO SHOWS RELATIVE WEAKNESS
by John Murphy,
Chief Technical Analyst, StockCharts.com
APPLE AND MICROSOFT PULL TECHNOLOGY SECTOR LOWER... Heavy selling in Apple and Microsoft is pulling the technology sector lower today. Chart 1 shows Apple (AAPL) gapping down in morning trading. Chart 2 shows Microsoft (MSFT) trading lower as well. Since those two are among the biggest stocks in the technology...
READ MORE
MEMBERS ONLY

The Market May Rally But Take Note, It's Getting Pretty Selective Out There

by Martin Pring,
President, Pring Research
* Dow diffusion indicator still on a buy signal.
* Dow Jones Composite Index facing important technical challenge.
* The reflation gold rallies in Euro and Yen are over.
Long-term Background
Last week at the webinar I came to the conclusion that enough short-term indicators were reversing from oversold readings to justify a...
READ MORE
MEMBERS ONLY
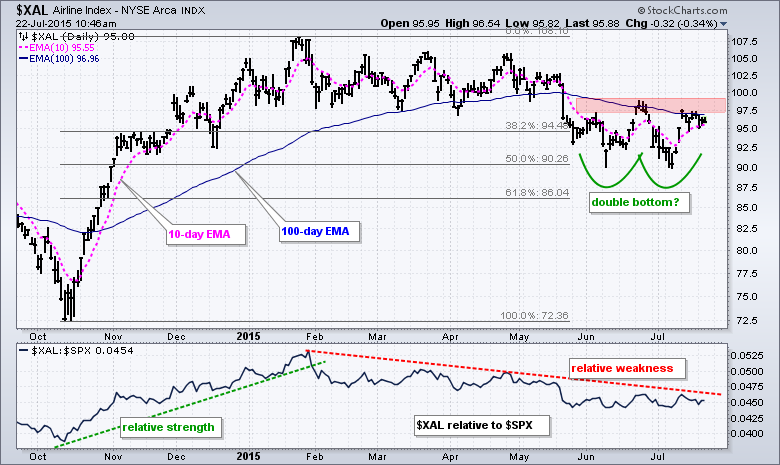
Airline Index Perks Up with a Reversal Pattern
by Arthur Hill,
Chief Technical Strategist, TrendInvestorPro.com
The Airline Index ($XAL) has been a real dog in 2015, but the index is showing signs of support and a double bottom could be emerging. The chart below shows $XAL peaking in January and moving lower the last six months. The 10-day EMA is below the 100-day EMA and...
READ MORE
MEMBERS ONLY
IWM Tests the Gap and RGI Weakens
by Arthur Hill,
Chief Technical Strategist, TrendInvestorPro.com
Stocks were weak across the board with the Dow Industrials leading the way lower. Big declines in IBM and UTX weighed on the senior Average. Both stocks are above $100 and the Dow is a price weighted average. This means the stocks with the highest price carry the most weight....
READ MORE
MEMBERS ONLY

MAJOR INDICES BIFURCATE, EW S&P 500 STALLS IN TREND, IWM REMAINS IN UPTREND, MINDING THE GAPS, WEAKNESS WITHIN TECHNOLOGY, SEMIS WEIGH, HACK LOOKS VULNERABLE, WEBINAR FEATURES
by John Murphy,
Chief Technical Analyst, StockCharts.com
MAJOR STOCK INDICES BIFURCATE ... Click here for the webinar recording. The stock market is still positive year-to-date, but we are starting to see some bifurcation in the major indices over the last few months. It is still not clear if these divergences will lead to a significant decline or if...
READ MORE
MEMBERS ONLY
Is This Rally Sustainable?
by Tom Bowley,
Chief Market Strategist, EarningsBeats.com
Funny how the stock market does a complete turnaround in two weeks, isn't it? If you haven't already read my July 7th article, "Today Smells Like A Short-Term Bottom.....Maybe", go back and check it out. If you're going to short-term trade...
READ MORE
MEMBERS ONLY
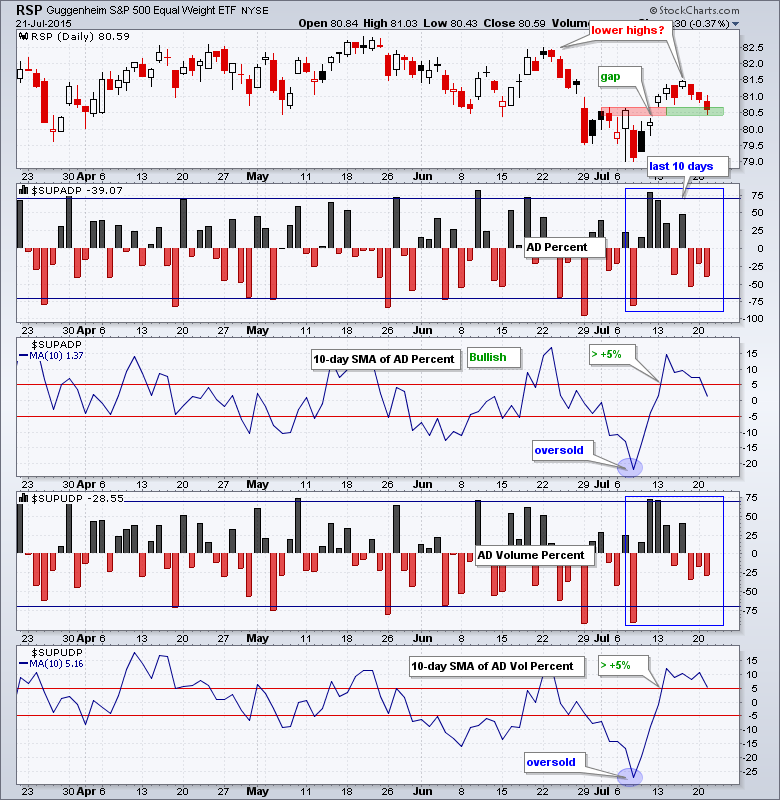
IWM and RSP Lag, USO and GLD Extend Downtrends
by Arthur Hill,
Chief Technical Strategist, TrendInvestorPro.com
Stocks were mixed on Monday with small gains and small losses in the major index ETFs. DIA and QQQ edged higher, while IWM and MDY edged lower. Small-caps and mid-caps continue to show relative weakness. Note that QQQ hit a new high and SPY is challenging its May high, but...
READ MORE
MEMBERS ONLY
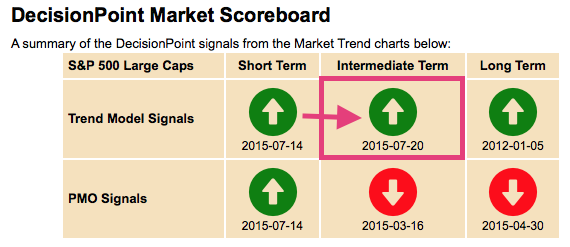
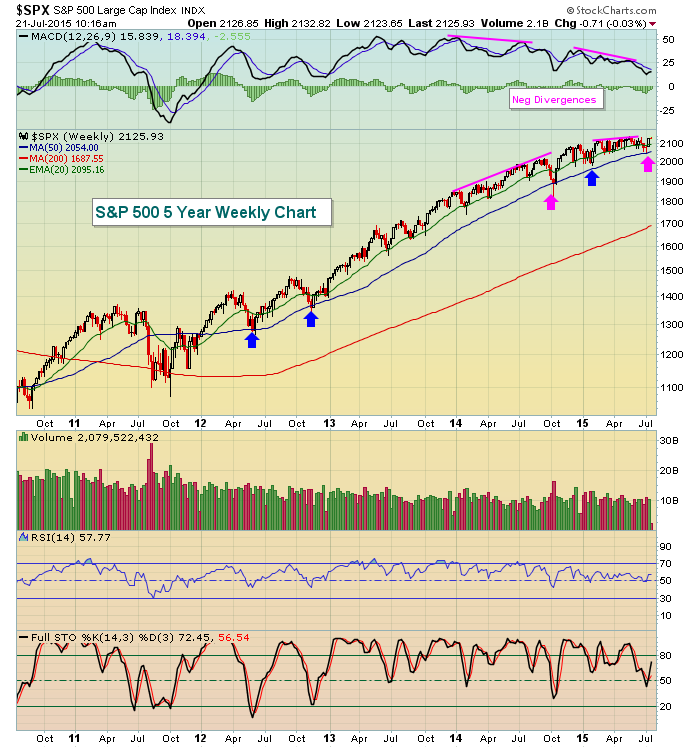
$SPX Puts New ITTM BUY Signal on DecisionPoint Scoreboard

by Erin Swenlin,
Vice President, DecisionPoint.com
It's nice to be back from vacation (if you call driving your daughter from Auburn, AL to California with a trailer attached to a small compact car in three days, a vacation) and see the market begin to make all-time highs again. Today we had a DecisionPoint Scoreboard...
READ MORE
MEMBERS ONLY
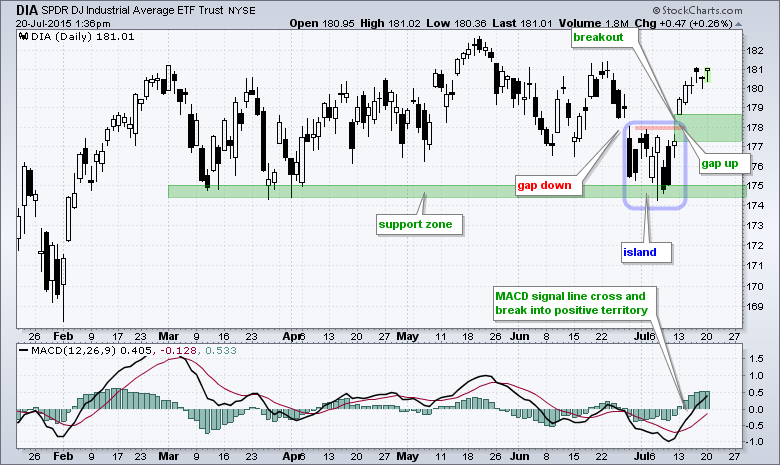
An Island Reversal for DIA
by Arthur Hill,
Chief Technical Strategist, TrendInvestorPro.com
With a gap and big surge, the Dow Diamonds (DIA) triggered a series of bullish signals that remain valid until proven otherwise. First, let's look at the bullish signals. DIA bounced off support in the 174-175 area in early July and broke resistance with a surge above 178....
READ MORE
MEMBERS ONLY

QQQ BREADTH LAGS, MEDIUM-TERM BREADTH WEAKENS, 55% OF MARKET REMAINS BULLISH, XLY AND XLV LEAD OVERSOLD BOUNCES, GOLD BREAKS TO NEW LOWS, XME AND XES PLUNGE TO NEW LOWS, BREADTH INDICATOR DETAILS AND CHART LINKS
by John Murphy,
Chief Technical Analyst, StockCharts.com
QQQ HITS NEW HIGH, BUT BREADTH LAGS... After a nice vacation and some time away from the market, I am going to start of with the indicator tables for the major index ETFs and sectors to get a broad overview. Before looking at these tables, let's look at...
READ MORE
MEMBERS ONLY
QQQ Leads, IWM Lags, USO and GLD Extend Downtrends
by Arthur Hill,
Chief Technical Strategist, TrendInvestorPro.com
Stocks surged last week with a rather lopsided advance. QQQ surged over 5% and SPY was up around 2.45%. IWM lagged with a 1.31% gain and MDY gained just .35%. Small-caps and mid-caps lagged as large-caps led. Among the sectors, technology and healthcare led as energy and materials...
READ MORE
MEMBERS ONLY
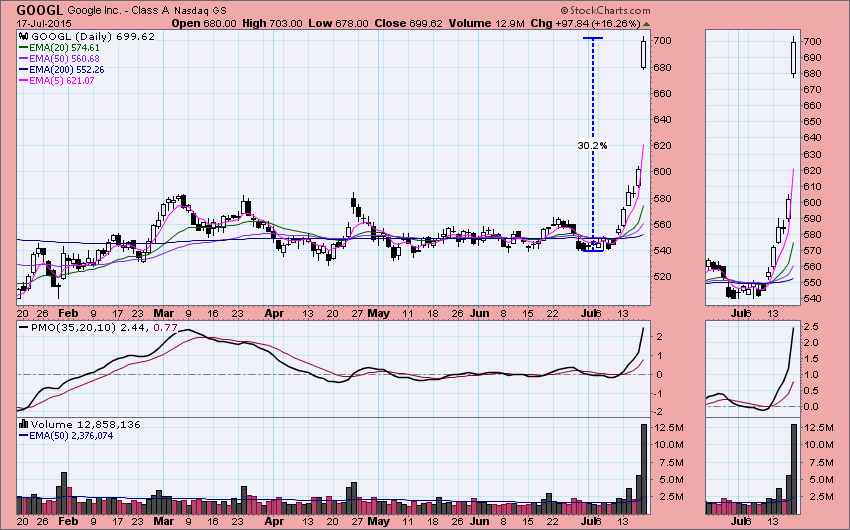
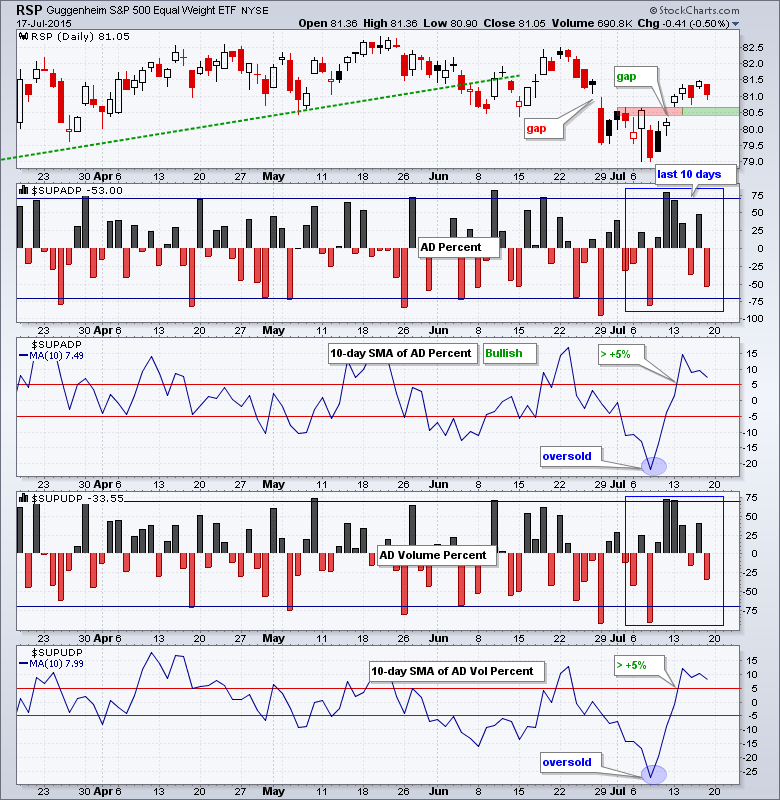
Google Warps Nasdaq 100 and S&P 500 Indexes

by Carl Swenlin,
President and Founder, DecisionPoint.com
Friday was a big day for Google (GOOG and GOOGL) with both the class "A" and class "C" stock up over +16% on earnings news. Actually, so far July has been a big month with GOOGL and GOOG being up about +30% since the July 7...
READ MORE
MEMBERS ONLY
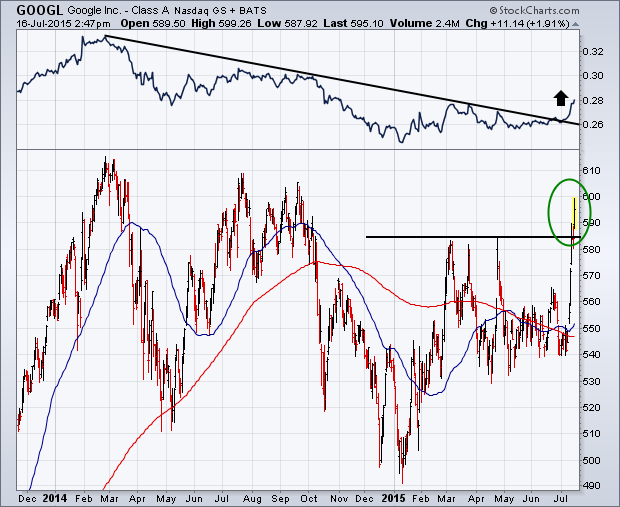
Google Leads the Internet Higher
by John Murphy,
Chief Technical Analyst, StockCharts.com
(Note: This article was originally published Thursday afternoon.)
The Internet group has been leading the technology sector higher this week. The standout performer in that group is Google. The chart below shows Google (GOOGL) surging through its spring high to the highest level since last October. Interesingly, the stock has...
READ MORE
MEMBERS ONLY
Why You Really Should Watch our Webinars
Hello Fellow ChartWatchers!
The stock market moved higher this week on good earnings news - but it is too early to conclude that the Bull are firmly back in charge. Why? One word - breadth. Breadth and momentum. OK, sorry, two, two words - breadth, momentum and seasonality. THREE! Three...
READ MORE
MEMBERS ONLY
Not Every Trade can be a Winner - But there are ways to Protect

by John Hopkins,
President and Co-founder, EarningsBeats.com
As traders, all of us hope that each new position we take on becomes a winner. Realistically, we all know that some trades will turn out to be losers. In fact, one could argue that there are really three things that are certain in life; death, taxes and losing trades!...
READ MORE
MEMBERS ONLY
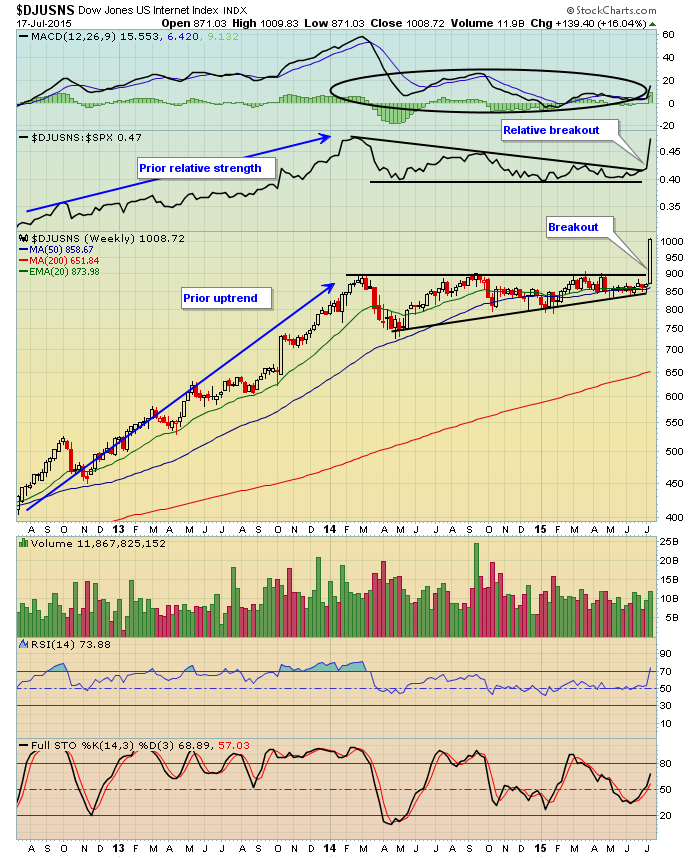
Internet Index Soars
by Tom Bowley,
Chief Market Strategist, EarningsBeats.com
There's a reason we watch chart patterns. Earlier this week in a DITC blog article, the internet index ($DJUSNS) finally cleared 900 resistance after failing at that level on a few occasions the past 18 months. This latest attempt was different, however. Many times it gets quite frustrating...
READ MORE
MEMBERS ONLY

Bulls-Eyes Are Great, but First Get the Arrow onto the Target
by Carl Swenlin,
President and Founder, DecisionPoint.com
If you've ever practiced archery, you know that your ultimate objective is to put the arrow in the bulls-eye, but just putting it on the target still feels pretty good. While we aim at perfection, we'll happily settle for competence. If you are good enough to...
READ MORE
MEMBERS ONLY

Combining AA and International equity markets

by Julius de Kempenaer,
Senior Technical Analyst, StockCharts.com
As I am writing this I am on holiday in Greece and overlooking the Ionian sea. A good time to clear the head and get some fresh thoughts. As it's also almost a year since I started writing my RRG-Blog here on StockCharts.com, and I still enjoy...
READ MORE
MEMBERS ONLY
How I Improved My Asset Allocation Profile by Using a Correlation Calculator

by Gatis Roze,
Author, "Tensile Trading"
Many investors would be shocked to learn that what they thought was their prudent well-diversified portfolio of five different asset classes might be effectively no different than owning the same car in five different colors. If you fail to understand asset correlations, most of your portfolio could be essentially the...
READ MORE
MEMBERS ONLY

Being a Chart Whisperer

by Bruce Fraser,
Industry-leading "Wyckoffian"
Trend analysis using trendlines (Wyckoff Method) is one of the most valuable skills of a Wyckoffian. The main idea is that a stock will advance at a set Stride, or rate of advance. Often (not always) the Stride can be detected early in the advance and this can help with...
READ MORE
MEMBERS ONLY

MARKET CONTINUES TO ADVANCE -- CITIGROUP BREAK OUT LEADS FINANCIAL SECTOR -- CELGENE, GILEAD, AND AMGEN LEAD BIOTECHS HIGHER -- GOOGLE BREAKOUT PACES INTERNET UPTURN -- TOBACCO STOCKS PUSH CONSUMER STAPLE SPDR TO NEW HIGH
by John Murphy,
Chief Technical Analyst, StockCharts.com
CITIGROUP PACES STRONG FINANCIAL GROUP... Financial stocks are having another good chart day. Chart 1 shows the Financials Sector SPDR (XLF) jumping to a new seven-year high today. Once again, banks are helping lead the way. Chart 2 shows the KBW Bank SPDR (KBE) nearing a new seven year high...
READ MORE
MEMBERS ONLY

PMO Time Frame Relationships?
by Carl Swenlin,
President and Founder, DecisionPoint.com
Webinar Question: Does a reversal in the daily PMO (Price Momentum Oscillator) have any effect on the PMO on weekly and monthly charts?
Carl's Answer: PMOs for the daily, weekly, and monthly time frames, while calculated with the same formula, are essentially different indicators. They are different because...
READ MORE
MEMBERS ONLY
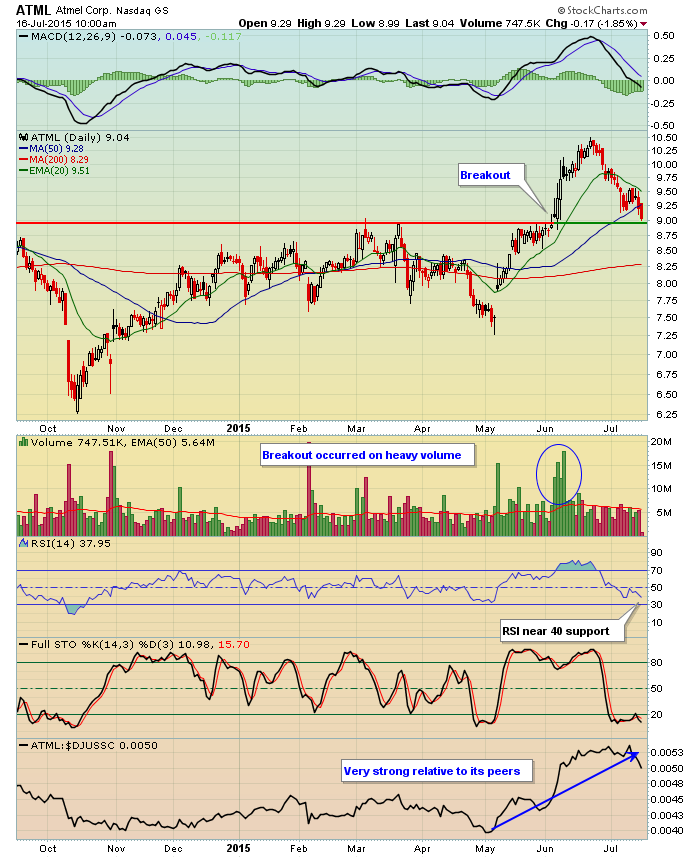
Atmel (ATML) Shows Relative Strength, Nears Support
by Tom Bowley,
Chief Market Strategist, EarningsBeats.com
Just a couple months ago in early May, ATML gapped higher on big volume and hasn't looked back since. Along the way, it cleared price resistance just below 9.00 on very heavy volume and subsequently surged to 10.50 before becoming violently overbought and in need of...
READ MORE
MEMBERS ONLY
Advance Decline Difference Indicators (Chapter 4, Part 2 - CGMBI)

by Greg Morris,
Veteran Technical Analyst, Investor, and Author
If you recall from the earlier article on Chapter 4, it is being presented in two parts because there are almost 50 charts in that chapter. Chapter 4, Part 1 is here. I selected the following indicators for this article, you can see by the Chart numbers below each chart...
READ MORE
MEMBERS ONLY

DOLLAR STRENGTHENS AS EURO FALLS -- CANADIAN DOLLAR DROPS TO SIX-YEAR LOW -- COMMODITY PRICES WEAKEN ON RISING DOLLAR -- ENERGY AND METAL STOCKS WEAKEN -- GOLD AND SILVER STOCKS THREATEN MAJOR SUPPORT LEVELS -- BANK OF AMERICA AND USB PACE BANK RALLY
by John Murphy,
Chief Technical Analyst, StockCharts.com
DOLLAR RISES AGAINST THE EURO -- CANADIAN DOLLAR HITS SIX-YEAR LOW... Chart 1 shows the Power Shares Dollar Bullish Fund (UUP) nearing the highest close in a month, after having broken a three-month falling ressistance line. The longer-range trend of the greenback remains up as shown by the rising 200-day...
READ MORE
MEMBERS ONLY
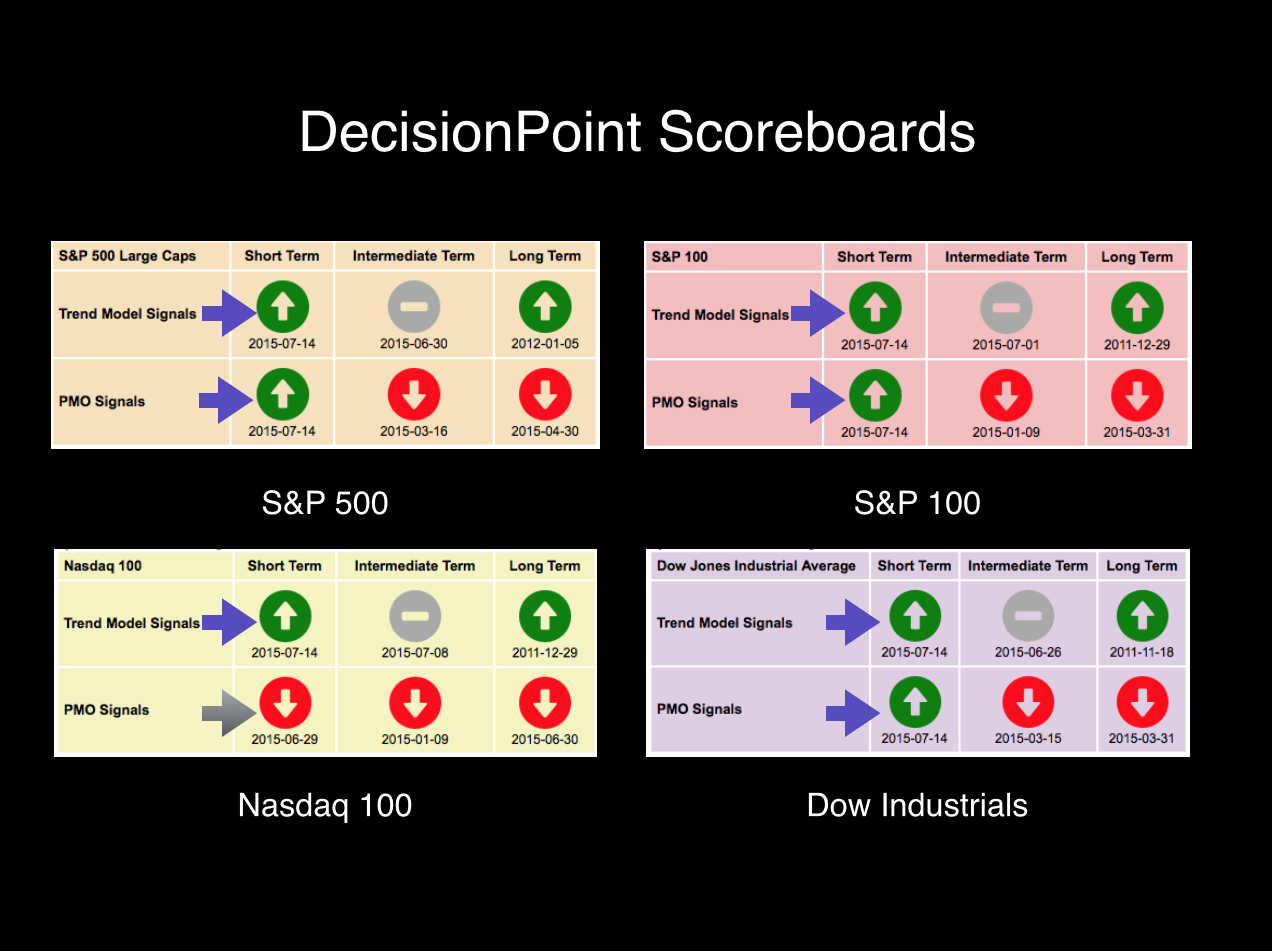
DP Scoreboard Flips Out!! Short-Term Signals Turn Bullish
by Erin Swenlin,
Vice President, DecisionPoint.com
I will admit to you that when I get the Technical Alert emails from the StockCharts.com ScanEngine regarding changes for all of the DP Sector ETFs and Indexes we follow in the DP Market/Sector Summary, I cringe a little. I'm excited to know the changes but...
READ MORE
MEMBERS ONLY

4 Earnings Reports (and Reactions) You NEED To Watch
by Tom Bowley,
Chief Market Strategist, EarningsBeats.com
Earnings season is always full of surprises. It's a time when we usher out the old (leaders) and welcome in the new. Companies that report better-than-expected results and are trading in bullish technical patterns typically have an advantage in the weeks ahead - at least that's...
READ MORE
MEMBERS ONLY
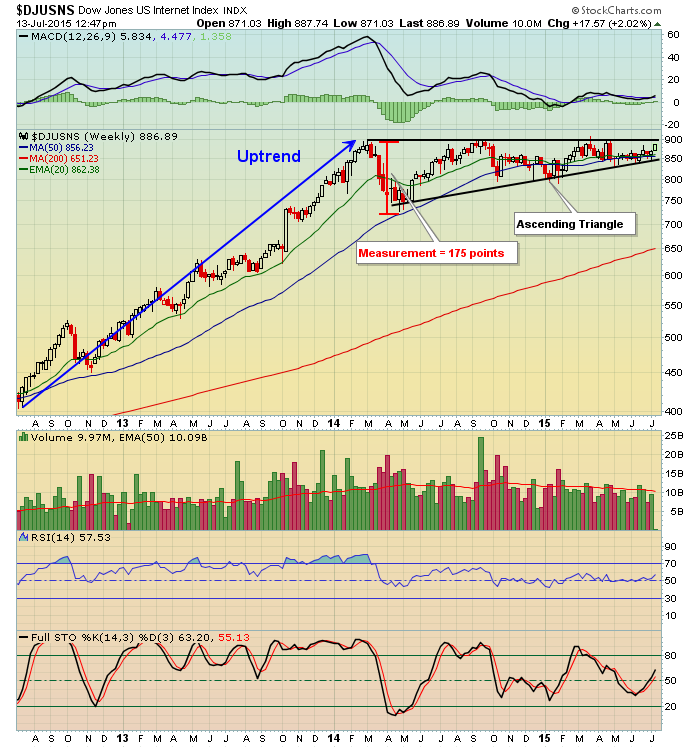
Technology And Internet Stocks Leading Today's Advance
by Tom Bowley,
Chief Market Strategist, EarningsBeats.com
Many traders are believing the Dow Jones U.S. Internet Index ($DJUSNS) is dead money and for the past 18 months or so, that's been mostly true. The DJUSNS has been unable to sustain a move above 900, testing that level in March 2014, September 2014, March 2015...
READ MORE
MEMBERS ONLY

Is The Chinese Equity Bull Market Over?
by Martin Pring,
President, Pring Research
* 25-day ROC experiences a mega oversold.
* Shanghai Composite rallies from 200-day MA.
* In 1929 in the US and 2007 in China, stocks retraced 50% of their first bear market decline. What does that say about today?
This week I am focusing on the Chinese equity market since events in China...
READ MORE
MEMBERS ONLY
Different Moving Averages for Different Time Frames
by Carl Swenlin,
President and Founder, DecisionPoint.com
QUESTION: In the StockCharts DecisionPoint documentation, it says that the weekly (17EMA and 43EMA) and monthly charts (6EMA and 10EMA) can be used to show long-term trends, but in the webinar, Erin said that they use only the daily chart.
CARL'S ANSWER: While the best way to determine...
READ MORE
MEMBERS ONLY
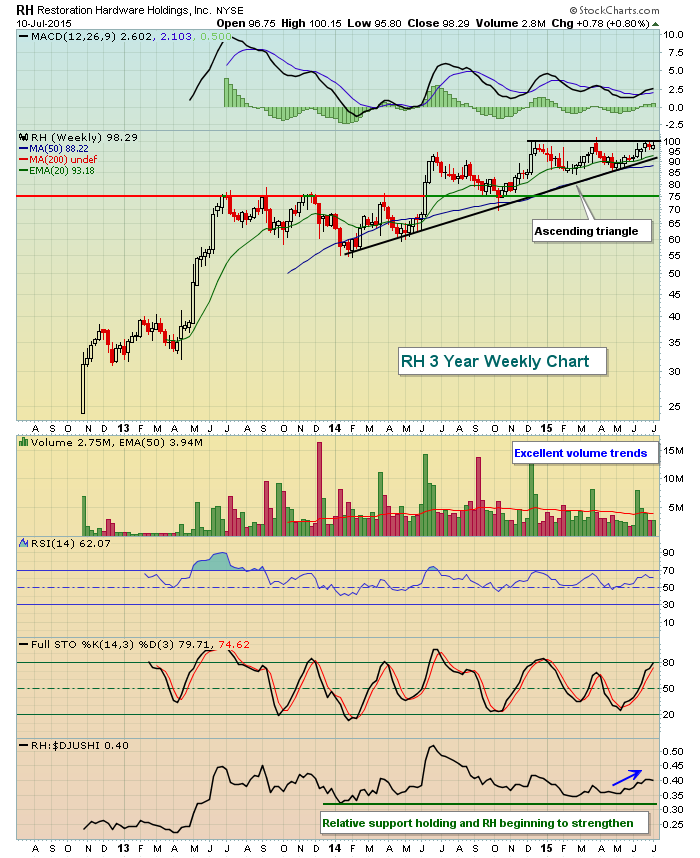
Restoration Hardware (RH) Poised For A Breakout
by Tom Bowley,
Chief Market Strategist, EarningsBeats.com
Restoration Hardware (RH) engages in the retail of home furnishings. Over the past three months, the home improvement retail index ($DJUSHI), to which RH belongs, is down more than 4% while RH consolidates ahead of what could be a triple top breakout. As a result, RH is showing solid relative...
READ MORE
MEMBERS ONLY

FRIDAY'S BOUNCE KEEPS STOCK INDEXES ABOVE 200-DAY LINES, BUT ON LIGHT VOLUME -- GREEK STOCK ETF RALLIES ON HOPES FOR A COMPROMISE -- GERMAN AND FRENCH STOCKS ALSO BOUNCE OFF 200-DAY LINES -- AS DOES A VERY OVERSOLD SHANGHAI MARKET
by John Murphy,
Chief Technical Analyst, StockCharts.com
DOW AND S&P 500 HOLD 200-DAY LINES... After a wild week, stocks closed high enough on Friday to hold their 200-day averages. Chart 1 shows the Dow Industrials climbing 211 points on Friday to end above its 200-day line. Chart 2 shows the S&P 500 doing...
READ MORE
MEMBERS ONLY

Your Biological Passport To Profits: Use It With Care!
by Gatis Roze,
Author, "Tensile Trading"
Most professional athletes these days have biological passports. I submit to you that investors should apply the same principle to their own trading.
A biological passport is an individual’s electronic record which profiles his or her personal genetic biological markers. The premise being that rather than testing for and...
READ MORE
MEMBERS ONLY

Making the Trend Your Friend
by Bruce Fraser,
Industry-leading "Wyckoffian"
The Wyckoff Method is primarily a trend following system. The orientation and goal is to discover and campaign the best leadership stocks for the biggest and best price moves. The jumping of the stock price out of the Accumulation and into an uptrend is an important event. Mr. Wyckoff developed...
READ MORE
MEMBERS ONLY

"Hangers-On" - The Last BUY Signals
by Erin Swenlin,
Vice President, DecisionPoint.com
As I perused the DecisionPoint Market/Sector Summary found in the DP Reports blog, I noticed that there are still some very old Intermediate-Term Trend Model (ITTM) BUY signals. I wrote in my last DecisionPoint blog article, "DP Scoreboard, Market/Sector Summary and Participation Suggest Internal Weakness", that...
READ MORE
MEMBERS ONLY
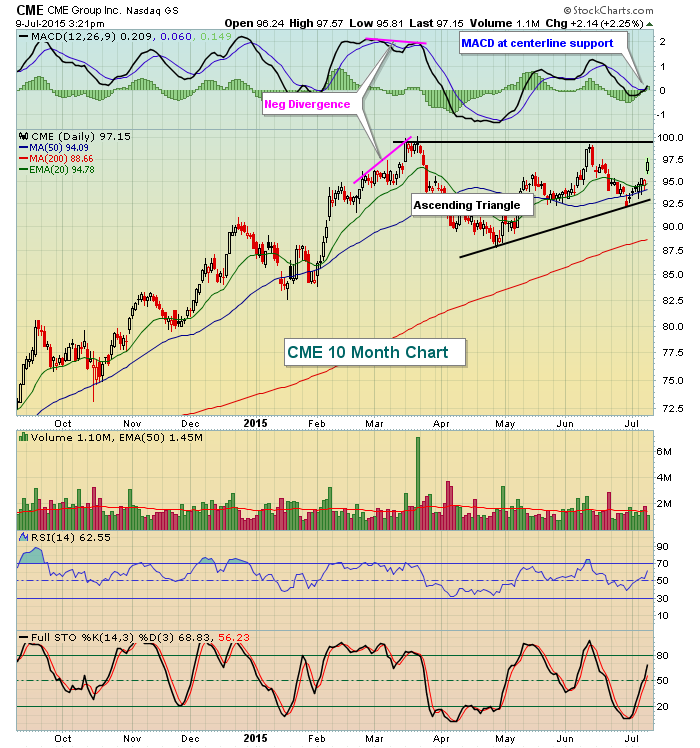
CME Group Consolidating in Bullish Ascending Triangle
by Tom Bowley,
Chief Market Strategist, EarningsBeats.com
The recent movement in CME shares back and forth is nothing but noise. The technical picture here is very solid with an uptrend in place that began in early 2013, preceding the current ascending triangle formation. During that span, CME more than doubled its stock price although its March high...
READ MORE
MEMBERS ONLY

THE FIVE WAVE ADVANCE IN THE NYSE COMPOSITE INDEX SINCE 2011 SUGGESTS THE COMPLETION OF THE THIRD WAVE IN A BULL MARKET -- THE MARKET APPEARS TO HAVE ENTERED A PERIOD OF CONSOLIDATION OR CORRECTION WITHIN ITS MAJOR UPTREND
by John Murphy,
Chief Technical Analyst, StockCharts.com
NYSE INDEX APPEARS TO HAVE COMPLETED A WAVE THREE... They say when you start to feel seasick you should focus on the horizon. Daily market swings are starting to make me feel seasick. So in line with that nautical theme, I'm going to focus on the market'...
READ MORE
