MEMBERS ONLY
Can Earnings Season Stem The Tide Of Selling?

by Tom Bowley,
Chief Market Strategist, EarningsBeats.com
I want to start this article from a historical perspective. I'm convinced there's much truth in the numbers. The 28th through the 6th and the 11th through the 18th are historically bullish periods of the calendar month. I believe much of this strength has to do...
READ MORE
MEMBERS ONLY

Driving vs. Investing

by Greg Morris,
Veteran Technical Analyst, Investor, and Author
Avoiding Potholes on the Investment Highway
While driving on a busy highway the other day it occurred to me that there are many similarities between driving an automobile and making investment decisions. I am a very careful driver and believe it or not have had only 2-3 flat tires since...
READ MORE
MEMBERS ONLY
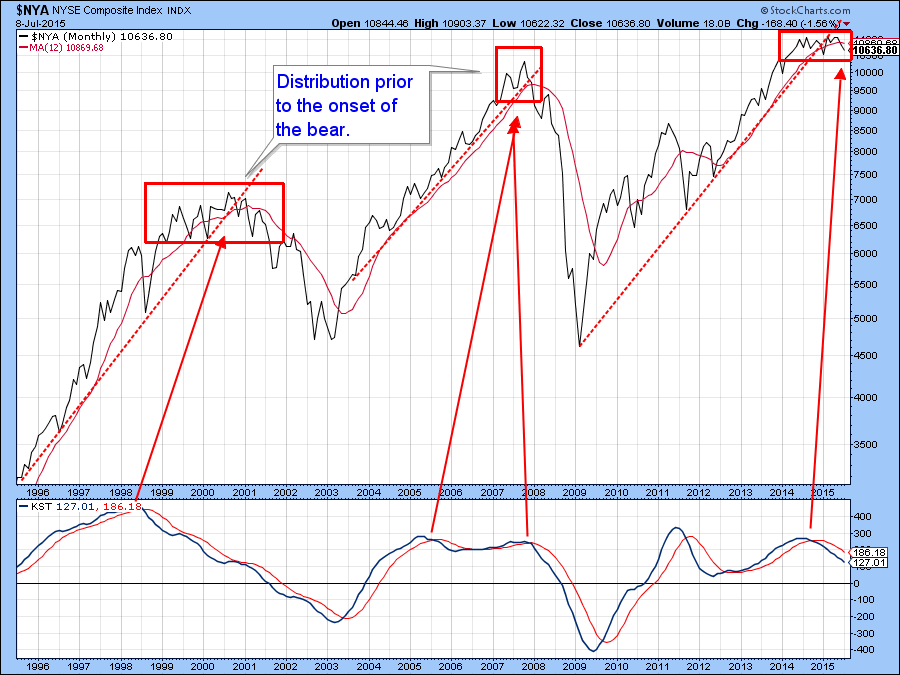
Longer-term Equity Charts Offering An Ominous Warning

by Martin Pring,
President, Pring Research
* Emerging markets are on the brink.
* The European IEV tentatively breaks its bull market trend line.
* Copper being driven down by weakness in China.
Equities
“Price action on Tuesday was quite remarkable since it seemed at the opening that the equity market was about to fall off a cliff but...
READ MORE
MEMBERS ONLY

PLUNGE IN CHINESE SHARES CONTINUES -- EMERGING MARKETS NEAR TEST OF 2015 LOW -- CANADA STOCKS ARE FALLING ON WEAKER COMMODITIES -- ENERGY SHARES ARE THREATENING SPRING LOW -- RISING VIX RAISES RISK LEVEL FOR STOCKS

by John Murphy,
Chief Technical Analyst, StockCharts.com
CHINESE FREE FALL CONTINUES ... The free fall in Chinese stocks continued again today. Chinese stocks trading on the mainland and Hong Kong lost -6%. Chart 1 shows the phenomenal drop in China iShares (FXI). The FXI has fallen well below is 200-day moving average, and trendline support drawn under its...
READ MORE
MEMBERS ONLY
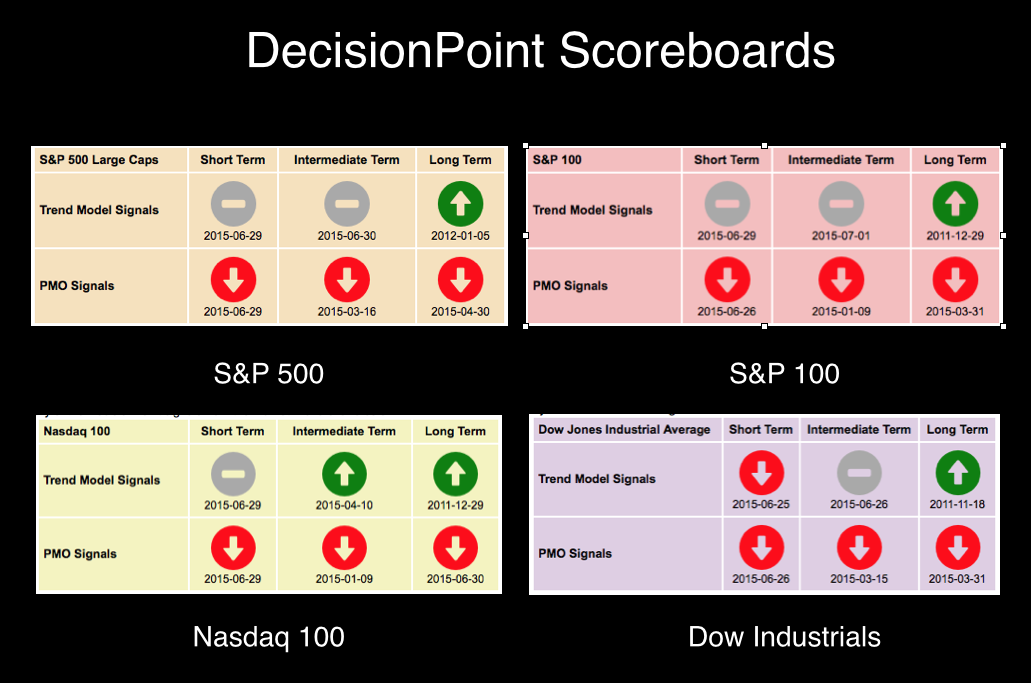
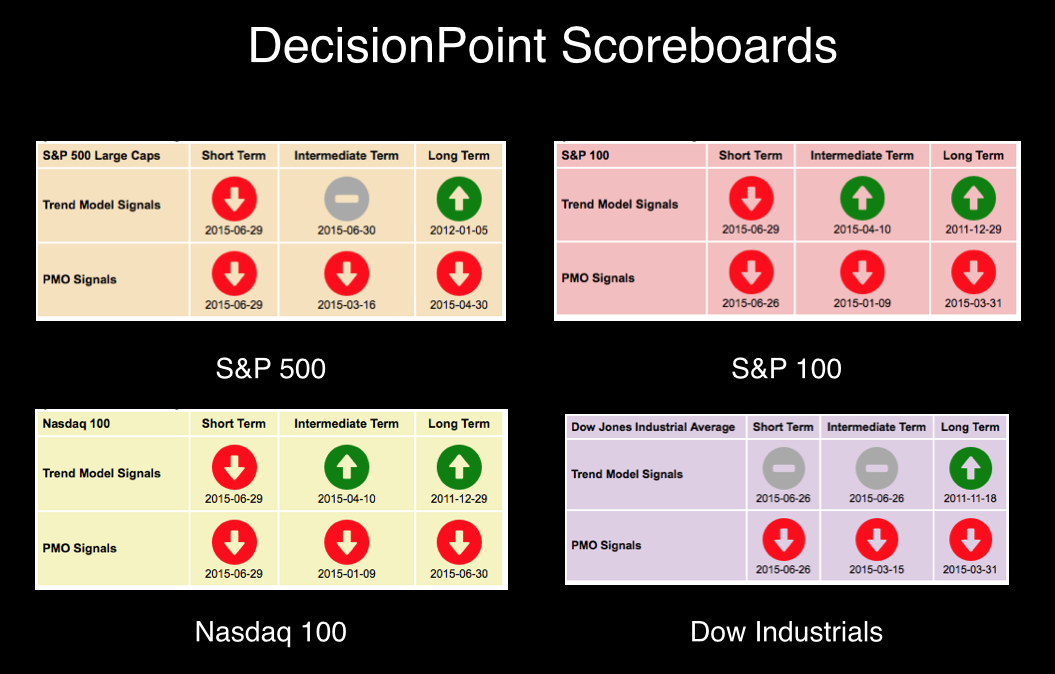
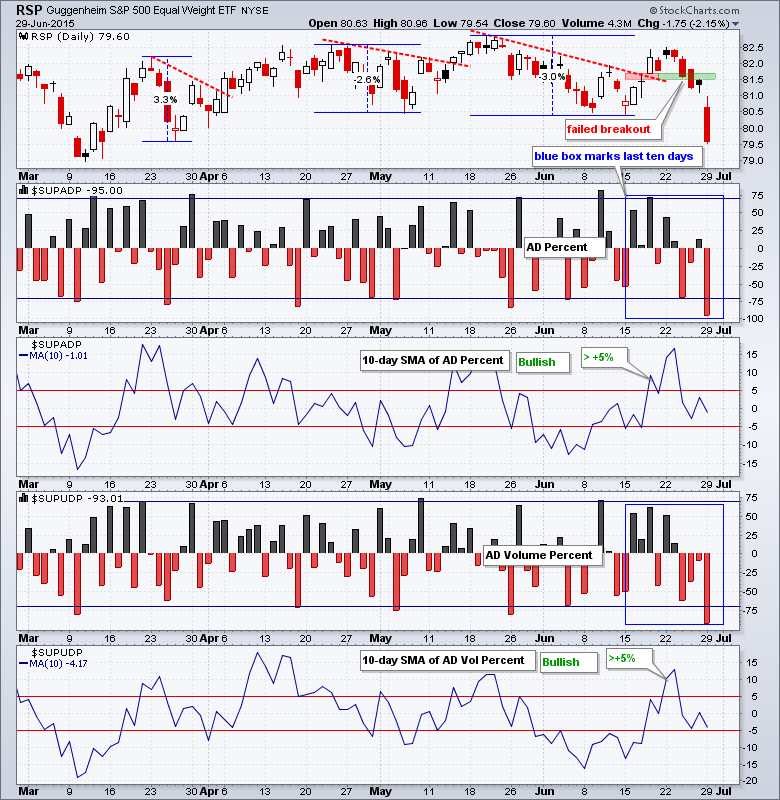
DP Scoreboard, Market/Sector Summary and Participation Suggest Internal Weakness

by Erin Swenlin,
Vice President, DecisionPoint.com
The DecisionPoint Scoreboard, located in the DP Chart Gallery, has been slowly flipping signals. Similarly we have seen a flip of Intermediate-Term Trend Model (ITTM) signals to Neutral or SELL. Typically when we see this type of movement of signals it is a sign of internal weakness in the market...
READ MORE
MEMBERS ONLY

ADDENDUM TO TODAY'S MESSAGE: UPSIDE TURNAROUND KEEPS STOCK INDEXES ABOVE 200-DAY LINES
by John Murphy,
Chief Technical Analyst, StockCharts.com
DOW AND SPX REGAIN 200-DAY LINE... An afternoon rally has the look of a potential upside reversal day that has allowed the Dow and the S&P 500 to regain their 200-day lines. Chart 1 shows the Dow Industrials trading higher after hitting a five-month low earlier today. That...
READ MORE
MEMBERS ONLY
Today Smells Like A Short-Term Bottom...Maybe
by Tom Bowley,
Chief Market Strategist, EarningsBeats.com
Possibly a long-term bottom. But I do respect bearish market behavior, especially during the summer months where history tells me "corrections happen".
I'm watching the action closely today, however, and we're seeing significant bounces off of steep drops that have a rather distinct market...
READ MORE
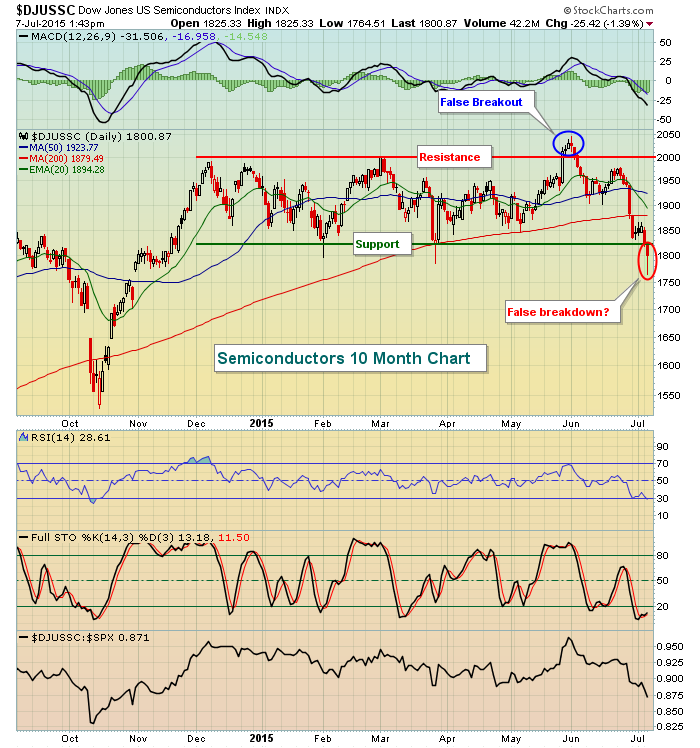
MEMBERS ONLY

STEEP FOREIGN LOSSES PULL U.S. STOCKS LOWER -- COPPER STOCKS LEAD MATERIALS LOWER -- SEMIS PLUNGE BELOW 200-DAY AVERAGE AND THREATEN TO DO SAME FOR TECHNOLOGY SPDR -- DOW FALLS TO FIVE-MONTH LOW AS SPX FALLS BELOW 200-DAY LINE
by John Murphy,
Chief Technical Analyst, StockCharts.com
DOW JONES GLOBAL INDEX CONTINUES TO PLUNGE ... Foreign losses continue to deepen. European stocks are down another -1%, while Chinese stocks are losing more ground. EAFE ishares are down -2%, while Emerging Markets iShares (EEM) are falling -3%. [A stronger dollar is hurting foreign stocks ETFs even more because they&...
READ MORE
MEMBERS ONLY

GREEK NO VOTE PULLS GLOBAL MARKETS LOWER AGAIN -- FOREIGN SHARES LEAD US LOWER -- FALLING ENERGY SHARES LEAD TO PLUNGE IN CRUDE -- FALLING CHINESE STOCKS HURT COPPER AND AUSSIE DOLLAR --
by John Murphy,
Chief Technical Analyst, StockCharts.com
FOREIGN STOCK ETFS TUMBLE ... Today's plunge in global stocks is reminiscent of what happened last Monday. Except the global downturn in getting more serious. Although U.S. stocks are falling, foreign markets are falling a lot more. Chart 1 shows EAFE iShares (EFA) falling more than 2% to...
READ MORE
MEMBERS ONLY
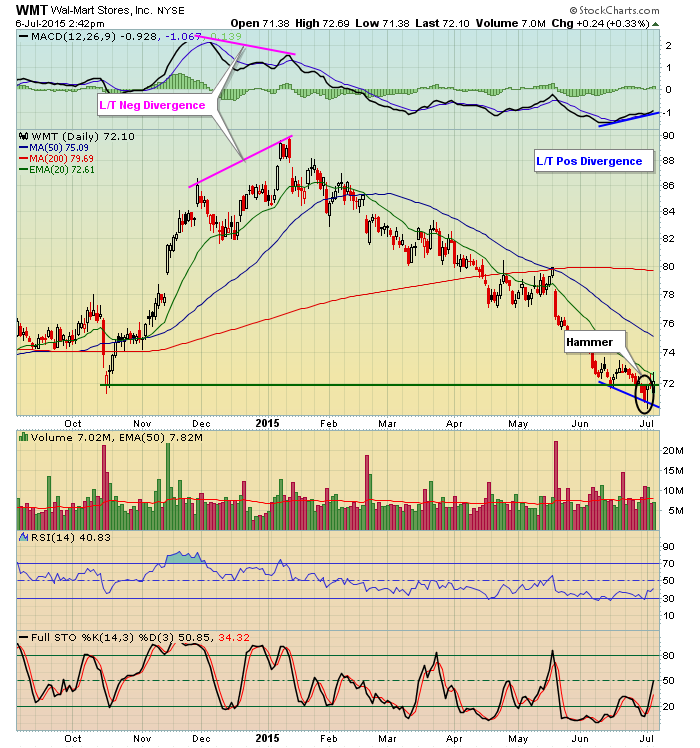
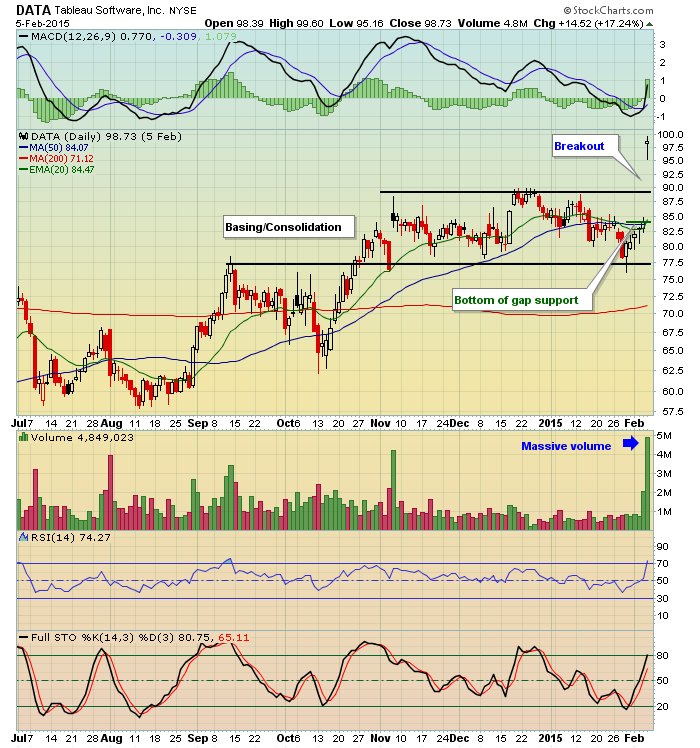
Attention Wal-Mart Shoppers!
by Tom Bowley,
Chief Market Strategist, EarningsBeats.com
Wal-Mart Stores (WMT) has been under tremendous selling pressure since it topped at an all-time high near 90 back in early 2015. The selling began after a long-term negative divergence printed during the second week of the year. That's a sign of slowing momentum on the buy side...
READ MORE
MEMBERS ONLY
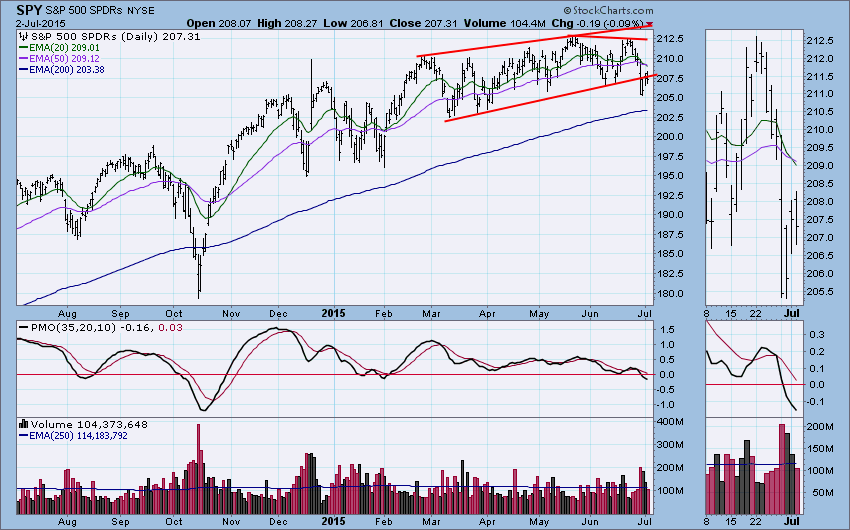
SPY: Longer-Term Internals Still Looking Bearish

by Carl Swenlin,
President and Founder, DecisionPoint.com
On Thursday the DP Trend Model for SPY changed from BUY (long the market) to NEUTRAL (in cash or fully hedged) when the 20EMA crossed down through the 50EMA. Why doesn't the model change from BUY to SELL (short the market)? Because the 50EMA is still above the...
READ MORE
MEMBERS ONLY
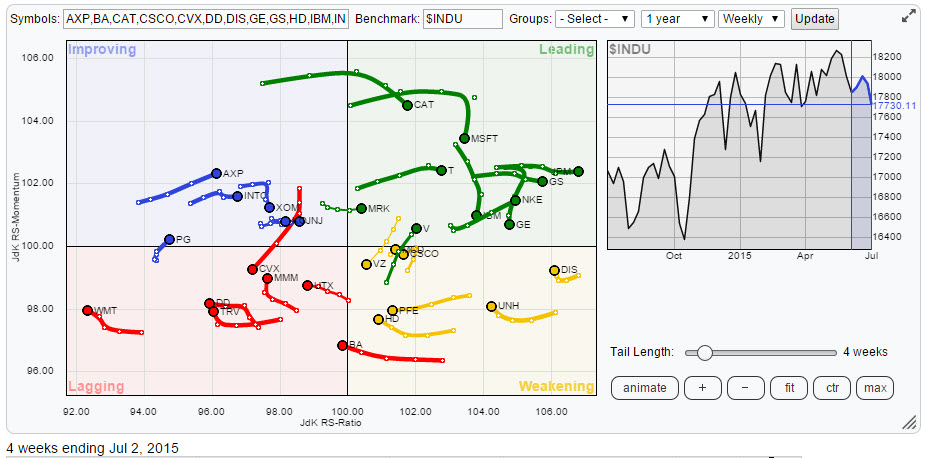
Tech & Energy are losing their power supply

by Julius de Kempenaer,
Senior Technical Analyst, StockCharts.com
As usual the 30 members of the Dow Industrials index are fairly evenly spread out over the Relative Rotation Graph, highlighting the good, the bad and the ugly ! Before moving into further detail I'll give you a bit of a head start saying that some technology stocks are...
READ MORE
MEMBERS ONLY
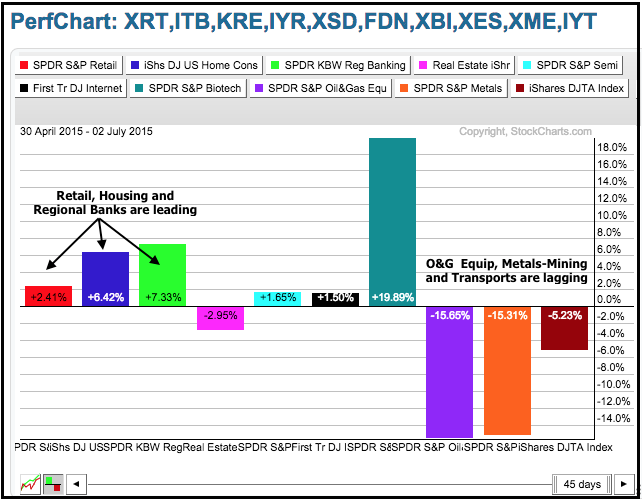
Home Construction ETF Leads and Holds Breakout

by Arthur Hill,
Chief Technical Strategist, TrendInvestorPro.com
The mixed performance of ten key industry group ETFs reflects the flat performance in the S&P 500 since early May. Note that the S&P 500 is virtually unchanged since April 30. As the PerfChart below shows, six of the industry group ETFs are up and four...
READ MORE
MEMBERS ONLY

Plunger Investing: A True Story

by Gatis Roze,
Author, "Tensile Trading"
To paraphrase P.J. O’Rourke, “Giving assets to a stock market plunger is like giving beer and car keys to teenage boys.” This is a true story. As you read this morality tale, you’ll recognize a person you know or investors you have known or possibly a person...
READ MORE
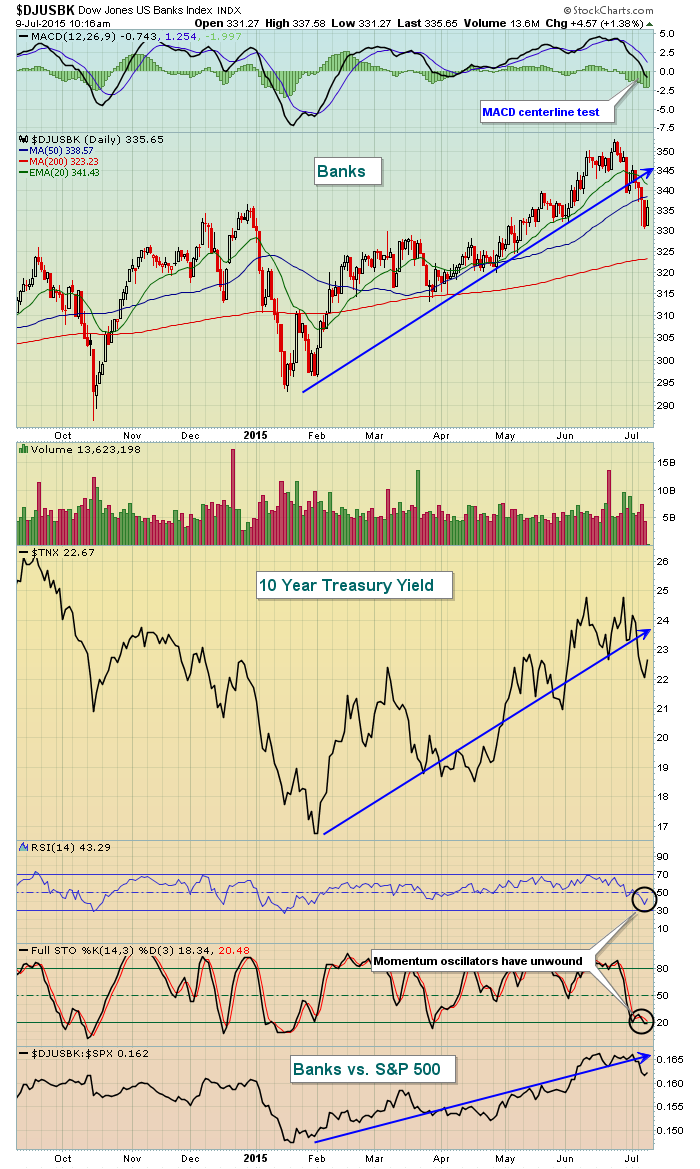
MEMBERS ONLY
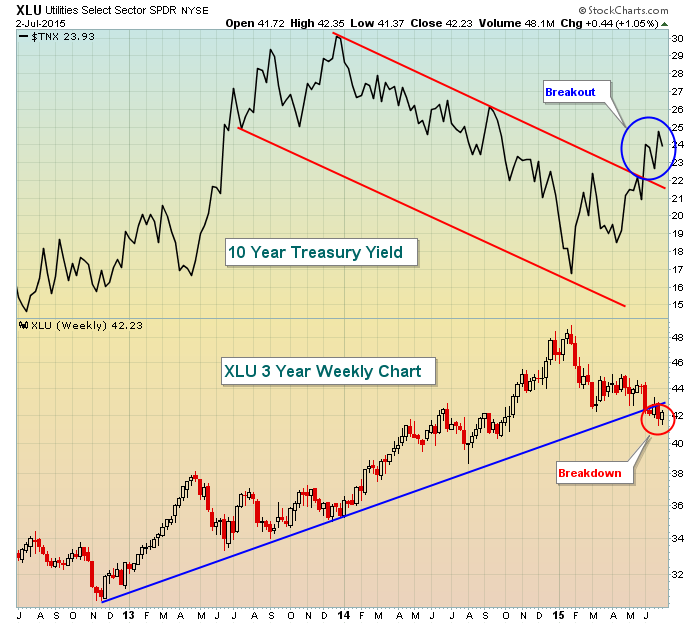
Higher Yields Mean Lower Utility Prices
by Tom Bowley,
Chief Market Strategist, EarningsBeats.com
Utility stocks benefited as much as any sector during the unprecedented drop in treasury yields. Those who seek income were forced out of treasuries the past several years because of historically low treasury yields and they found a home in utilities. The problem now is that treasuries are being sold...
READ MORE
MEMBERS ONLY
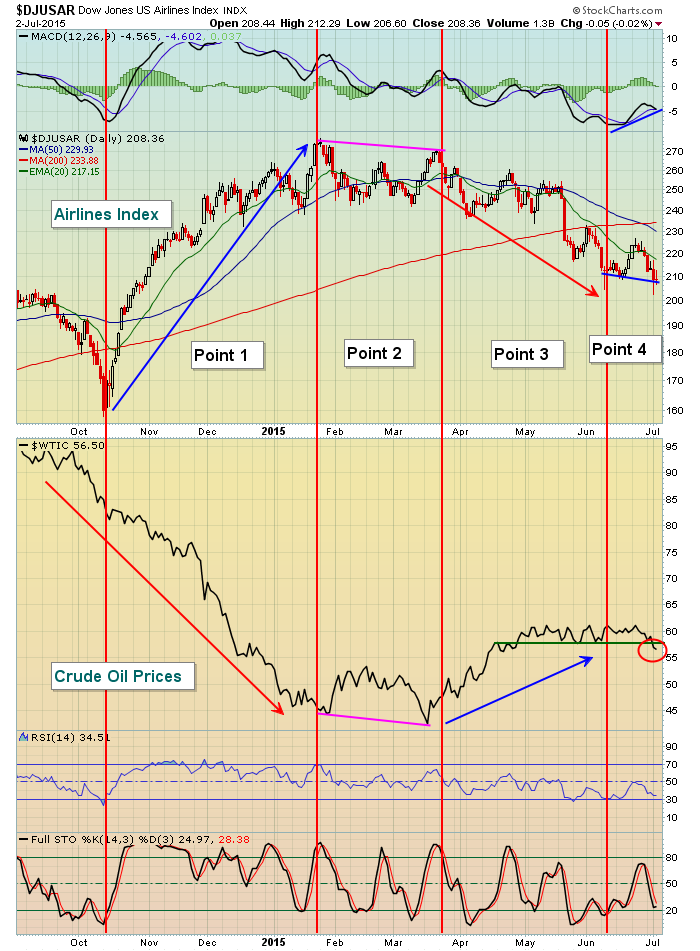
Been A Rocky 2015 Flight, But Airlines Hitting Support
by Tom Bowley,
Chief Market Strategist, EarningsBeats.com
Market rotation is the key during every bull market. Indices begin to fall apart when rotation fails and money leaves many aggressive areas and doesn't move to others. But our major indices stay on course so long as market rotation continues and thus far that's what...
READ MORE
MEMBERS ONLY

IS LOW VOLATILITY GOOD?, A LOOK AT THE 2008 BREAK DOWN, 2008 MARKET MESSAGE, $SPX AND THE CURRENT BBAND STATUS, CURRENT SMALL-CAP SIGNAL IS BULLISH, KEY SUPPORT FOR QQQ, CONTRACTIONS FOR HOUSING, SEMICONDUCTOR AND RETAIL SPDRS
by John Murphy,
Chief Technical Analyst, StockCharts.com
IS LOW VOLATILITY A GOOD THING?... Link for today's video. I am going to step back and look at some weekly charts using Bollinger Bands and the BandWidth indicator. As many of us are aware, volatility has declined over the last six months and trading ranges are quite...
READ MORE
MEMBERS ONLY
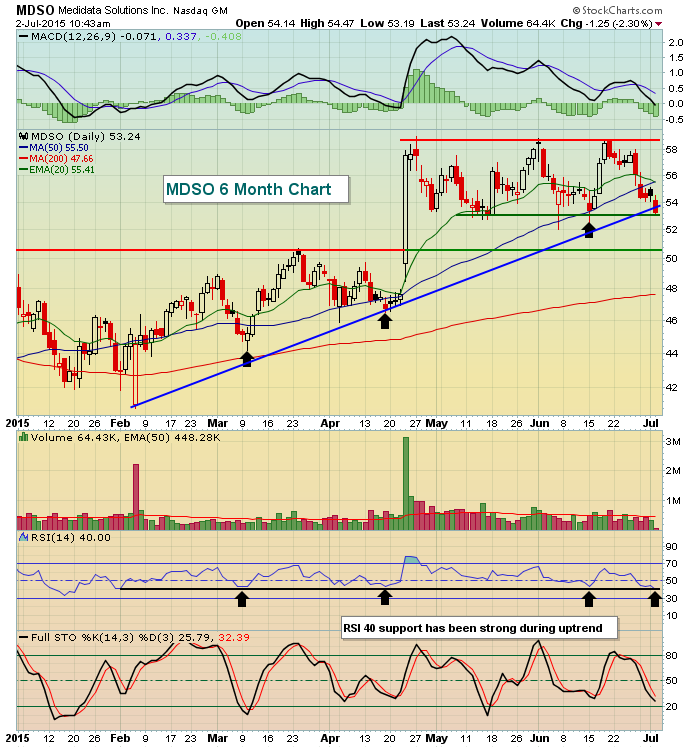
MDSO: Recent Weakness Presenting Opportunity?
by Tom Bowley,
Chief Market Strategist, EarningsBeats.com
Medidata Solutions (MDSO) posted better than expected revenues and EPS in late April and the stock exploded higher as a result. Since that time, MDSO hasn't been able to add to those gains, instead consolidating in rectangular fashion with its RSI dropping to 40. As you look at...
READ MORE
MEMBERS ONLY

Questions from Readers
by Greg Morris,
Veteran Technical Analyst, Investor, and Author
Over the past 6-7 months that I have been writing for StockCharts.com many truly great questions have been posed in the Comments area. I have questioned my policy of not participating in the Comments area a number of times because these questions and answers would benefit everyone or at...
READ MORE
MEMBERS ONLY

Wyckoff Power Charting. Let's Review

by Bruce Fraser,
Industry-leading "Wyckoffian"
Previous posts have been devoted to the process of Accumulation. What distinguishes Power Charting with the Wyckoff Method from other chart pattern recognition tools is our focus on tracking the footprints of the Composite Operator. A long term trend requires intelligent Accumulation of very large quantities of shares prior to...
READ MORE
MEMBERS ONLY

STOCKS BOUNCE ON HOPE FOR GREEK COMPROMISE -- LONGER RANGE INDICATORS, HOWEVER, SHOW NEGATIVE DIVERGENCES AND SUGGEST DETERIORATION BENEATH THE SURFACE -- DOW WEEKLY AND MONTHLY MACD LINES ARE NEGATIVE -- LESS THAN HALF OF NYSE STOCKS ARE IN UPTRENDS
by John Murphy,
Chief Technical Analyst, StockCharts.com
DOW JONES COMPOSITE AVERAGE HITS NEW LOW... I don't know about you, but I'm tired of hearing about Greece. It makes day-to-day market analysis a lot more difficult. Monday's global stock plunge followed reports of a Greek default. Stocks are now bouncing on reports...
READ MORE
MEMBERS ONLY
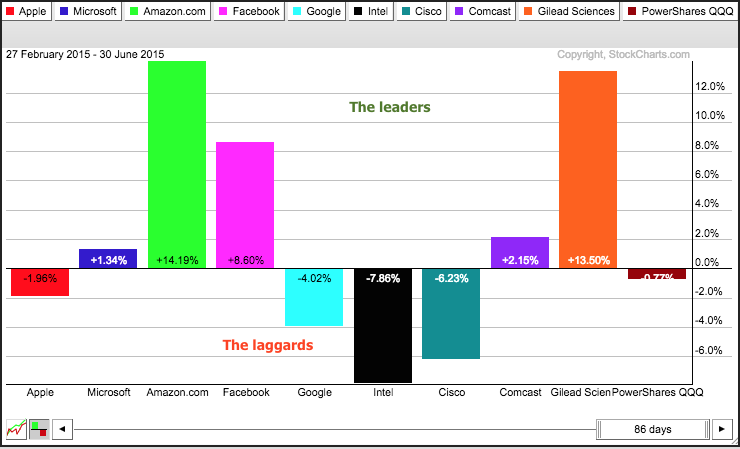
QQQ is Stymied by Performance Split and 3 Consolidations Hold the Key
by Arthur Hill,
Chief Technical Strategist, TrendInvestorPro.com
A look at performance for the top holdings in the Nasdaq 100 ETF (QQQ) explains a lot about performance since March. The PerfChart below shows the percentage change for QQQ and its top nine holdings. Note that this chart does not include Wednesday's price data, which is still...
READ MORE
MEMBERS ONLY
Fundamentals PLUS Technicals EQUALS Trading Success
by Tom Bowley,
Chief Market Strategist, EarningsBeats.com
The Strategy
Tuesday marked the end of the second quarter. During the 2015 "halftime report", I thought I'd take a moment to share my approach to individual stock trades. Trading can be a daunting task, especially if you're looking at individual stocks because there...
READ MORE
MEMBERS ONLY
QQQ and IWM Firm at Support and USO Trends Lower
by Arthur Hill,
Chief Technical Strategist, TrendInvestorPro.com
Stocks managed to firm after Monday's rout and several ETFs formed inside days, which signal indecision. The Russell 2000 Growth iShares (IWO) and Russell MicroCap iShares (IWC) led the rebound and gained around .90% each. The sectors were mixed with energy, consumer discretionary and finance finishing with modest...
READ MORE
MEMBERS ONLY
Long-Term PMO SELL Signal for NDX and Intermediate-Term Trend Model Neutral on SPX
by Erin Swenlin,
Vice President, DecisionPoint.com
There were two important signal changes in the DP Scoreboards in the DecisionPoint Chart Gallery. The NDX finally submitted to a long-term Price Momentum Oscillator (PMO) SELL signal. The other three in the gallery were already on long-term PMO SELL signals. Additionally, the Intermediate-Term Trend Model (ITTM) generated a Neutral...
READ MORE
MEMBERS ONLY
Investors no Longer Hunting for Yield as Junk Bonds Break Down
by Martin Pring,
President, Pring Research
* Leading sectors experience false breaks to the upside.
* NYSE A/D Line completes a head and shoulders top.
* Dollar Index may be about to resume its bull market.
US Equities
Last week there appeared to be a sporting chance that the market was headed higher as several short-term indicators were...
READ MORE
MEMBERS ONLY

WEBINAR DETAILS, AUTO ETF CORRECTS, ITB MAINTAINS UPTREND, LEISURE AND ENTERTAINMENT ETF TRENDS LOWER, RETAIL ETFS TAKE HITS, SMALL-CAPS REMAIN BULLISH OVERALL, TECH AND INDUSTRIALS REDDEN, INDICATOR AND SIGNAL OVERVIEW, BREADTH CHART LINKS
by John Murphy,
Chief Technical Analyst, StockCharts.com
WEBINAR DETAILS... The charts and commentary below are from the Webinar on Tuesday, June 30th, at 1PM ET. In this Webinar, I looked at the key industry groups within the consumer discretionary sector because these hold the key to the most economically sensitive sector. I analyzed some key breadth indicators...
READ MORE
MEMBERS ONLY
SPY and QQQ Break Support, Euro Holds Firm, Bonds Bounce
by Arthur Hill,
Chief Technical Strategist, TrendInvestorPro.com
Stocks were hit with broad selling pressure as the major index ETFs fell sharply and all sectors moved lower. The declines in the major index ETFs were pretty even with each losing around 2%. DIA held up the best with a 1.95% decline and IJR fared the worst with...
READ MORE
MEMBERS ONLY

GLOBAL STOCKS TUMBLE ON GREEK CRISIS -- EUROPE AND ASIA LEAD FOREIGN MARKETS LOWER -- TECHNICAL DAMAGE IS DONE TO U.S. MARKET -- DOW INDUSTRIALS FALL BELOW 200-DAY AVERAGE -- S&P 500 FALLS TO THREE-MONTH LOW
by John Murphy,
Chief Technical Analyst, StockCharts.com
FOREIGN SHARES TUMBLE... Global stocks tumbled today. Chart 1 shows EAFE iShares (EFA) falling 3% to the lowest level in nearly three months, and in very heavy trading. European stocks lost 4% on average, with Germany falling 3.5%. Asian stocks tumbled as well, including Japan (-2.8%) and China...
READ MORE
MEMBERS ONLY

SPY FALLS TO FIRST TEST, SEASONALITY CHARTS AND SUMMER, BONDS COULD BENEFIT FROM DOLDRUMS, JULY TOUGH FOR SMALL-CAPS, LT TREND SYSTEM REMAINS BULLISH, REFINERS CONSOLIDATE WITHIN UPTRENDS
by John Murphy,
Chief Technical Analyst, StockCharts.com
SPY FALLS TOWARDS FIRST TEST... Link for today's video. The major index ETFs are down across the board with the Nasdaq 100 Equal-Weight ETF (QQEW) getting hit the most. Small-caps and large-caps are also down with the Russell 2000 iShares (IWM) and S&P 500 SPDR (SPY)...
READ MORE
MEMBERS ONLY
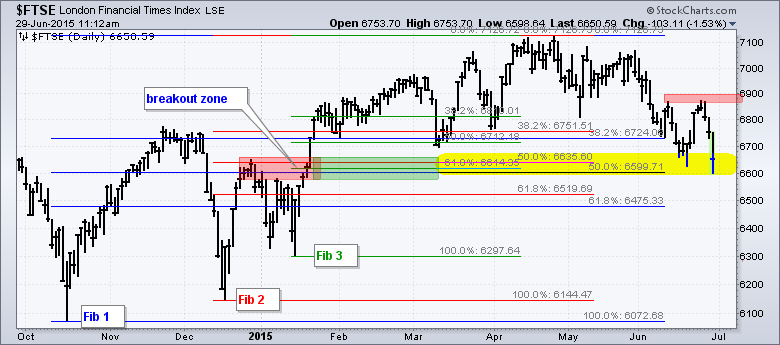
FTSE Hits Fibonacci Cluster Zone and LLoyds Forms Bull Flag
by Arthur Hill,
Chief Technical Strategist, TrendInvestorPro.com
Today's post is for our UK traders because it focuses on the FTSE and three of the biggest banks in the UK. Shares in Europe were sharply lower in early trading on Monday with the German DAX Index ($DAX) and French CAC Index ($CAC) losing around 3%. The...
READ MORE
MEMBERS ONLY
SPY and QQQ Reverse within Trading Ranges - UUP Challenges Resistance
by Arthur Hill,
Chief Technical Strategist, TrendInvestorPro.com
Last week was almost the week that wasn't. There wasn't much change in the major index ETFs and there was no solution for Greece. There were some other significant moves though. The Home Construction iShares (ITB) and the Regional Bank SPDR (KRE) had a good week...
READ MORE
MEMBERS ONLY

Long-Term SELL Signal for Long Bonds
by Carl Swenlin,
President and Founder, DecisionPoint.com
The most important feature on the chart below is the fact that the 50EMA has crossed down through the 200EMA, generating a Long-Term Trend Model SELL signal for long bonds, and this tells us that bonds are in a bear market. In our analysis we use TLT as the ETF...
READ MORE
MEMBERS ONLY
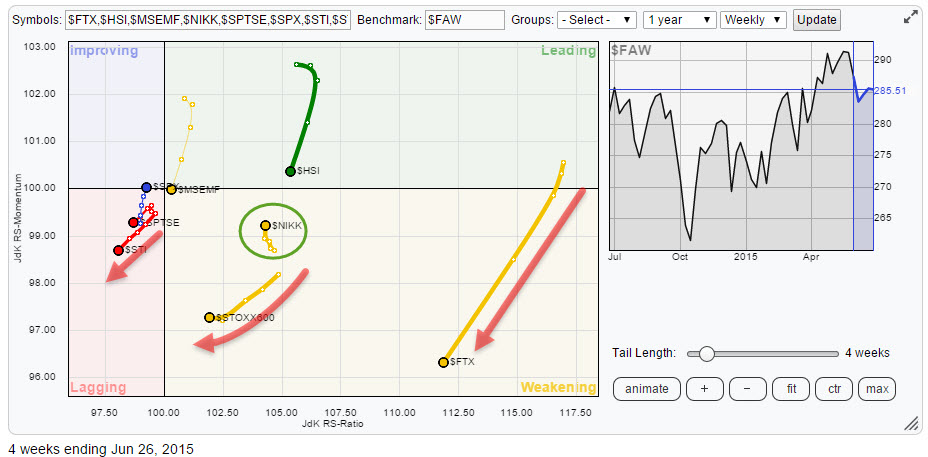
If you can't stand the heat, get out of the (Asian) kitchen!
by Julius de Kempenaer,
Senior Technical Analyst, StockCharts.com
International stock markets continue to show us big rotations on the Relative Rotation Graph. The picture below holds a number of international stock market indices in comparison with the FTSE all world index ($FAW).
click the chart for the live RRG
Initial observations
Following the headline of my previous blog...
READ MORE
MEMBERS ONLY
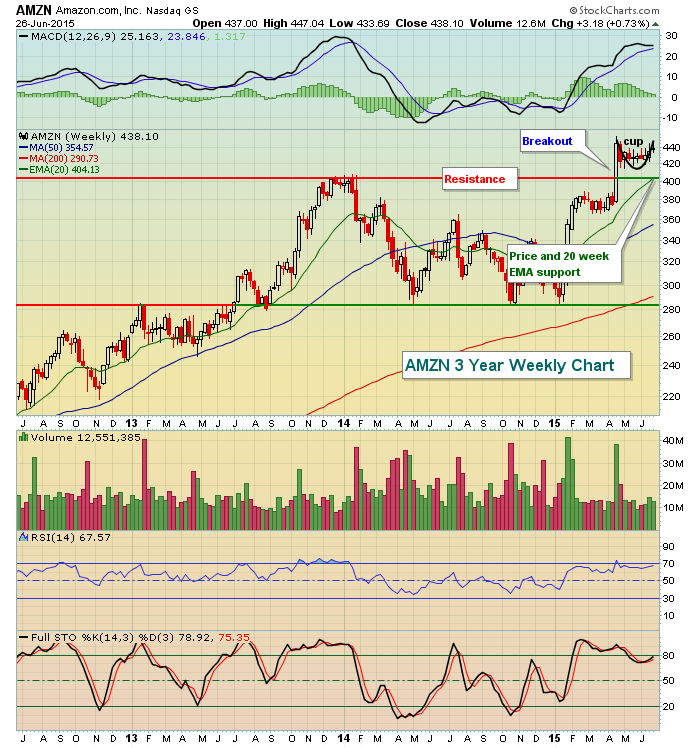
AMZN Awaiting Next Bullish Breakout
by Tom Bowley,
Chief Market Strategist, EarningsBeats.com
Amazon.com (AMZN) continues to reach for the stars and if the current technical pattern plays out, it'll likely be much closer. After soaring through price resistance in April to set a fresh all-time high on the heels of better-than-expected earnings, AMZN has been consolidating in a bullish...
READ MORE
MEMBERS ONLY

HOMEBUILDERS HAVE A STRONG WEEK -- LENNAR GAPS HIGHER -- BEAZER HOMES AND KB HOME ALSO HAVE A STRONG WEEK -- RISING BOND YIELDS CONTINUE TO HELP BANKS AND INSURERS WHILE HURTING UTILITIES AND REITS
by John Murphy,
Chief Technical Analyst, StockCharts.com
HOMEBUILDERS HAVE A STRONG WEEK... The daily bars in Chart 1 show the Dow Jones U.S. Home Construction iShares (ITB) ending the week at the highest level in two months. Interestingly, that came in the face of rising bond yields. Earlier in the year, rising bond yields appeared to...
READ MORE
MEMBERS ONLY
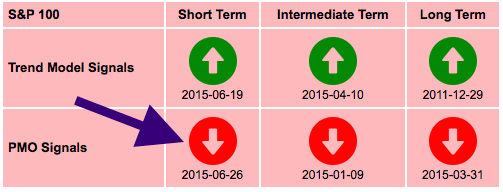
DP Scoreboard Update! $OEX, $INDU New PMO SELL Signals
by Erin Swenlin,
Vice President, DecisionPoint.com
Just a quick article to alert you that we had some important DP Scoreboard Updates today. The S&P 100 and Dow Industrials both generated Price Momentum Oscillator (PMO) SELL signals. Additionally, the Dow had a Short-Term Trend Model (STTM) and Intermediate-Term Trend Model (ITTM) Neutral signals update. Here...
READ MORE
MEMBERS ONLY

MICRO-CAPS LEAD MIXED MARKET, SMALL-CAP ETF AND QQQ HIT NEW HIGHS, EW S&P 500 CONTINUES TO LAG, TREND SORTING WITH THE PPO (DEMO), FOUR KEY SECTOR ETFS ARE STILL TRENDING UP, INDUSTRIALS BREAK DOWN, OIL WEIGHT ON ENERGY
by John Murphy,
Chief Technical Analyst, StockCharts.com
MICRO-CAPS LEAD MIXED MARKET ... Link for today's video. The stock market is not clicking on all cylinders right now, but the majority of cylinders are still in uptrends, even after some selling pressure this month. Today I will look at some key uptrends and show what it would...
READ MORE
MEMBERS ONLY

Where Investment Lessons Reside
by Gatis Roze,
Author, "Tensile Trading"
Michael Jordan is probably the greatest basketball player I have ever seen. He wrote a book titled I Can’t Accept Not Trying: Michael Jordan on the Pursuit of Excellence which lays out his rules for success. This book is of interest to us as traders even though we pursue...
READ MORE
MEMBERS ONLY
Technical Analysis - Its Strengths And Weaknesses
by Tom Bowley,
Chief Market Strategist, EarningsBeats.com
There is little in this world that irks me more than listening to a fundamentalist eschew technical analysis. I have a somewhat unique background as a Technical Analyst, having passed the CPA exam some 30 years ago and having spent 20 years in public accounting. That has provided me a...
READ MORE