MEMBERS ONLY

Bear Markets! Are They a Thing of the Past?

by Greg Morris,
Veteran Technical Analyst, Investor, and Author
…Or is your measuring stick just too short? If you are starting to feel that the market really only goes up and that the risk of being invested for the long term is small, you probably need a short refresher course on the equity markets. Don’t feel bad, failing...
READ MORE
MEMBERS ONLY
QQQ forms Cup with Handle - Oil Fails to Hold Breakout

by Arthur Hill,
Chief Technical Strategist, TrendInvestorPro.com
Stocks just couldn't bear the pressure any longer and sold off on Thursday. The S&P 500 opened weak and finished weak for a .86% decline on the day. Overall, the decline is not that big and the index is still less than 2% from an all...
READ MORE
MEMBERS ONLY
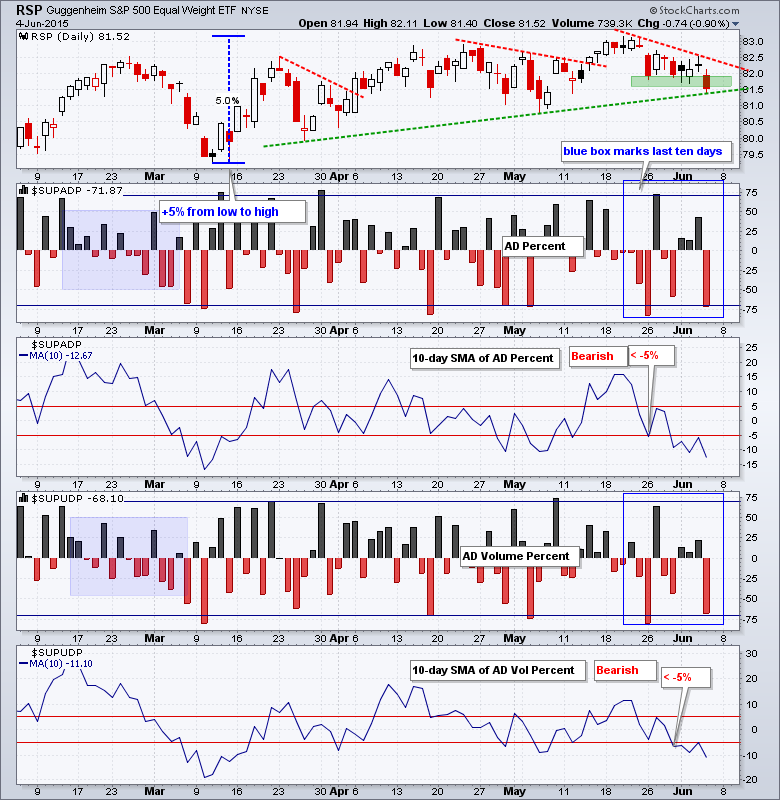
Plethora of Short-Term Trend Model Neutral Signals

by Erin Swenlin,
Vice President, DecisionPoint.com
In my last article, I explained how I set up StockCharts.com Technical Alerts to email me when any Trend Model or Price Momentum Oscillator (PMO) signal changes occur. I started it so that I could keep our DP Scoreboard up to date, but I'm finding it to...
READ MORE
MEMBERS ONLY

Is Thursday's Negative Action The Start Of Something More Serious?

by Martin Pring,
President, Pring Research
* -Brokers experience a bearish two bar reversal.
* -Dollar diffusion indicator ticks up for the first time in many weeks.
* -Gold in dollars experiencing a short-term breakdown.
* -Gold in yen and euro at crucial support levels.
US Equities
The market has been working its way irregularly higher over the last few...
READ MORE
MEMBERS ONLY

FOREIGN STOCKS LEAD THE U.S. LOWER -- EMERGING MARKETS FALL THE HARDEST -- FALLING COMMODITY PRICES WEIGH ON CANADIAN STOCKS -- WEAK ENERGY SHARES LEAD OIL LOWER AS MOST COMMODITIES WEAKEN

by John Murphy,
Chief Technical Analyst, StockCharts.com
FOREIGN STOCKS SHOW NEW WEAKNESS... The global stock market rally is running into trouble. That can be seen more clearly in foreign markets. Chart 1 shows MSCI EAFE iShares (EFA) falling below its 50-day average after backing off from overhead resistance formed last June. Its daily MACD lines (top of...
READ MORE
MEMBERS ONLY
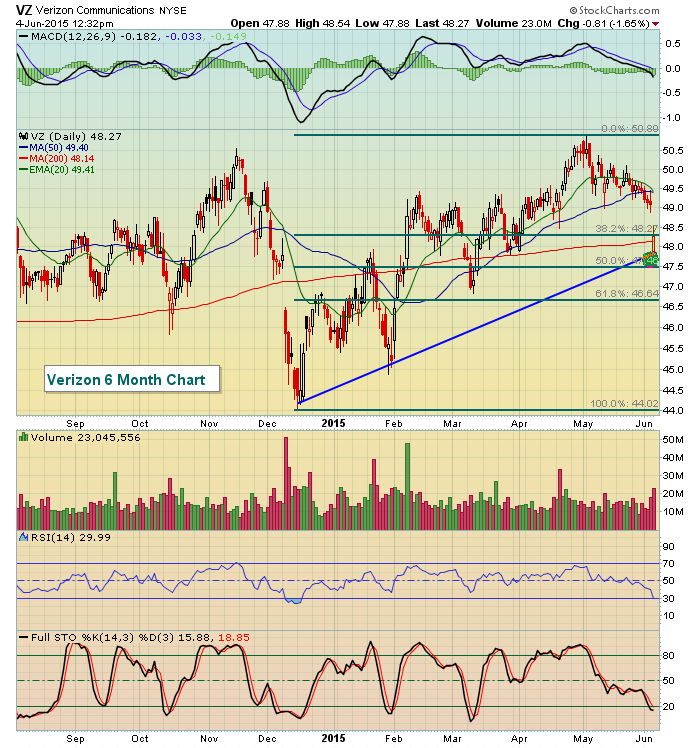
Verizon Downgraded, Tests Short-Term Support

by Tom Bowley,
Chief Market Strategist, EarningsBeats.com
JP Morgan downgraded Verizon (VZ) this morning, instead choosing AT&T (T) and that has put pressure on VZ in the early going. Thus far, buyers have emerged and VZ has risen off its opening gap lower. Technically, VZ is continuing its downtrend that it started just over a...
READ MORE
MEMBERS ONLY
Small-caps Lead as IWM Breaks Out - UUP Hits Moment of Truth
by Arthur Hill,
Chief Technical Strategist, TrendInvestorPro.com
Stocks chopped around again on Wednesday, but managed to hold their early gains and close positive. The S&P 500 surged to 2121 in the first hour, fell back to 2112 around lunchtime and then finished at 2114 for a small gain. The Russell 2000 iShares (IWM) and the...
READ MORE
MEMBERS ONLY

BOND YIELDS SURGE TO NEW 2015 HIGH AS BOND PRICES PLUNGE -- UTILITIES AND REITS FALL WITH BOND PRICES -- BANKS AND LIFE INSURERS RISE WITH BOND YIELDS -- INSURANCE LEADERS ARE UNUM, METLIFE, AND PRUDENTIAL -- BANK SPDR HITS NEW SEVEN YEAR HIGH
by John Murphy,
Chief Technical Analyst, StockCharts.com
BOND YIELDS REACH NEW 2015 HIGH... The surge in bond yields that started a month ago is accelerating to the upside. Chart 1 shows the 10-Year Treasury Note Yield climbing to the highest level since last November. Chart 2 shows the 30-Year T-Bond Yield doing the same. The driving force...
READ MORE
MEMBERS ONLY
My Perspective On Go Away In May
by Tom Bowley,
Chief Market Strategist, EarningsBeats.com
If you know one thing about me, you should know that I'm a stock market historian. I've logged every day's S&P 500 activity onto an Excel spreadsheet since 1950. If there's a trend, I can tell you about it. So...
READ MORE
MEMBERS ONLY
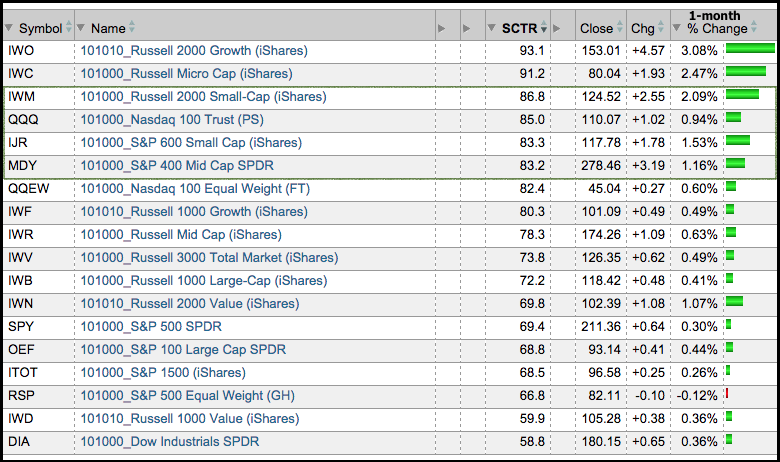
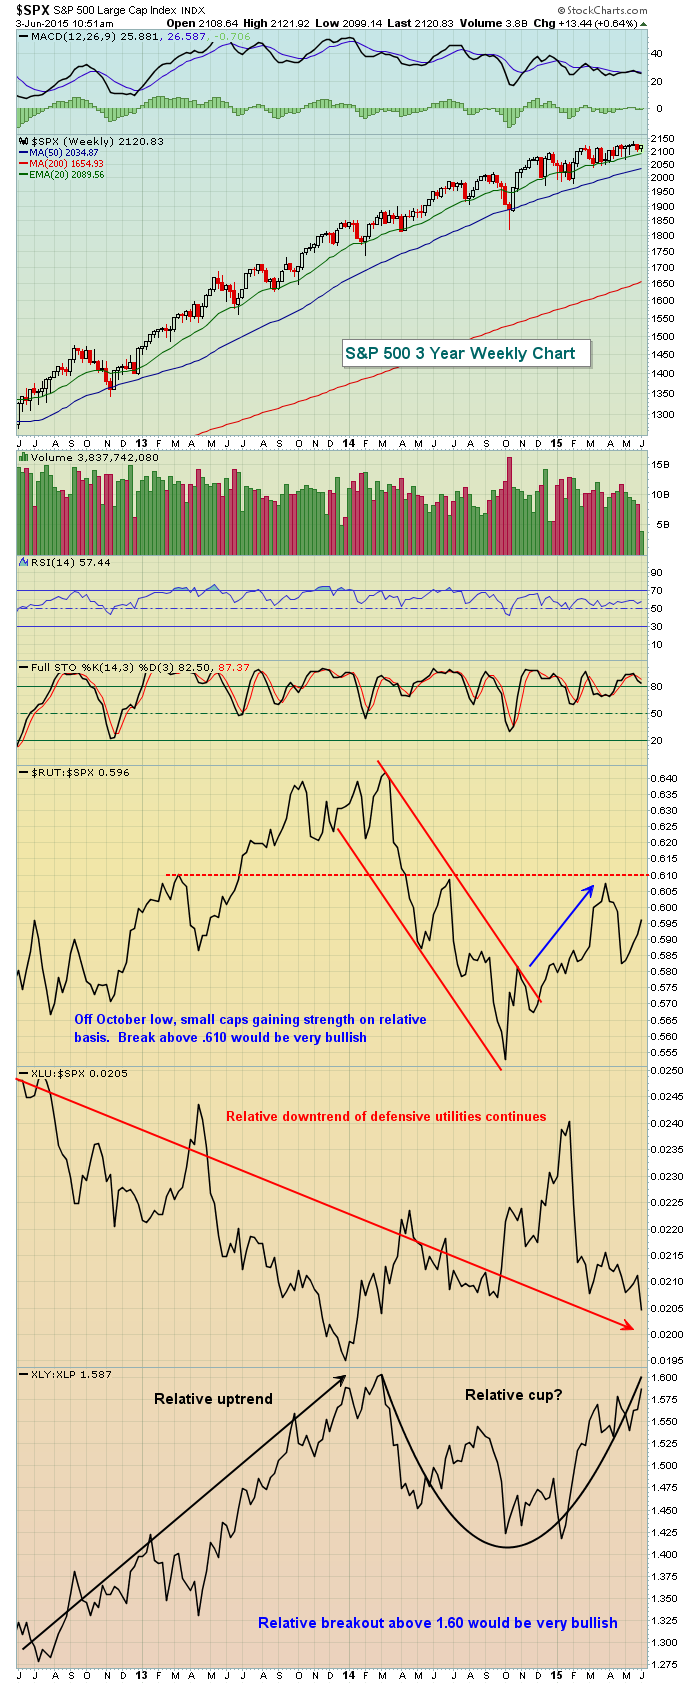
Don't Look Now, but Small-cap SCTRs are Leading
by Arthur Hill,
Chief Technical Strategist, TrendInvestorPro.com
May was a strong month for big tech stocks, small caps and mid caps. It was such a big month that the Russell 2000 iShares, S&P SmallCap iShares and S&P MidCap SPDR are in the top third of the SCTR table below. Notice that the Russell...
READ MORE
MEMBERS ONLY
Oil Gets a Break, IWM Perks Up and Bonds Break Down
by Arthur Hill,
Chief Technical Strategist, TrendInvestorPro.com
Stocks chopped around again on Tuesday with the S&P 500 falling to 2100 on the open, bouncing back to 2117 in the early afternoon and settling around 2110 by the close. Overall, the major index ETFs ended the day mixed. DIA and QQQ edged lower, while IWM and...
READ MORE
MEMBERS ONLY

Accumulation Phase; Absorbing Stock Like a Sponge

by Bruce Fraser,
Industry-leading "Wyckoffian"
What are the conditions that need to be in place prior to a long and sustained rally in a stock? That is an important question to ask because it is not a random accident when a stock rises bigger, better and faster compared to most other stocks. When large, informed...
READ MORE
MEMBERS ONLY
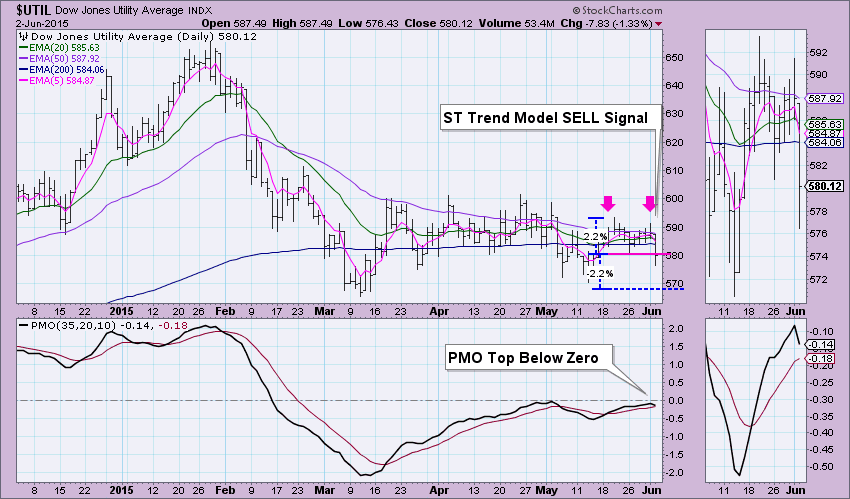
Short-Term Trend Model SELL on $UTIL and BUY on $SML
by Erin Swenlin,
Vice President, DecisionPoint.com
I'm alerted whenever there is a Short-Term Trend Model signal change on the major indexes. In fact, I downloaded the "StockCharts Essentials" ChartPack and I run my alerts on the "1010 Essential Major Market Indexes" ChartList in particular. The alert scan is included below:...
READ MORE
MEMBERS ONLY

FOUR KEY SECTORS IN HOLDING PATTERNS, TIMING ITB AND XHB, REGIONAL BANKS AND BROKER STAY STRONG, WATER BREAKS, OIL FORMS BULL FLAG, XES SURGES WITHIN WEDGE, MACD DIVERGENCES AND CHANDELIERS
by John Murphy,
Chief Technical Analyst, StockCharts.com
50% OF S&P 500 REMAINS IN HOLDING PATTERN... The following charts and brief commentary come from Click here for Tuesday's webinar. The broader market continues to grind higher and we can point the finger at four sectors. Technology and healthcare are doing their part for the...
READ MORE
MEMBERS ONLY
Three of Five Sectors in Short-term Downtrends - SPY Triangulates
by Arthur Hill,
Chief Technical Strategist, TrendInvestorPro.com
Stocks chopped around on Monday with the S&P 500 trading in an 18 point range the entire day. The major index ETFs finished with small gains led by the Russell MicroCap iShares (+.40%). The sectors were mixed with energy, materials and consumer staples showing some weakness. Healthcare, industrials...
READ MORE
MEMBERS ONLY
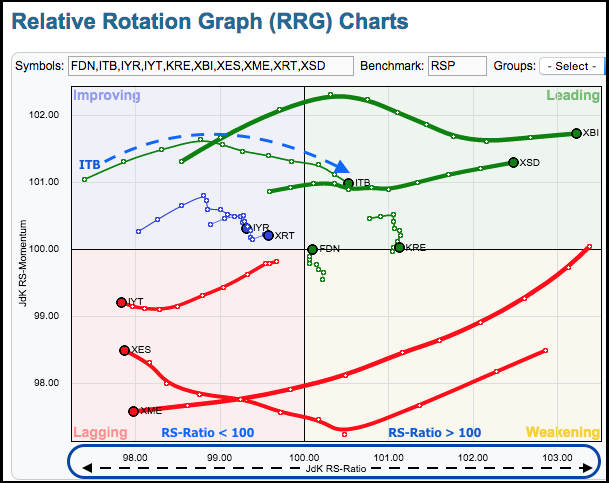
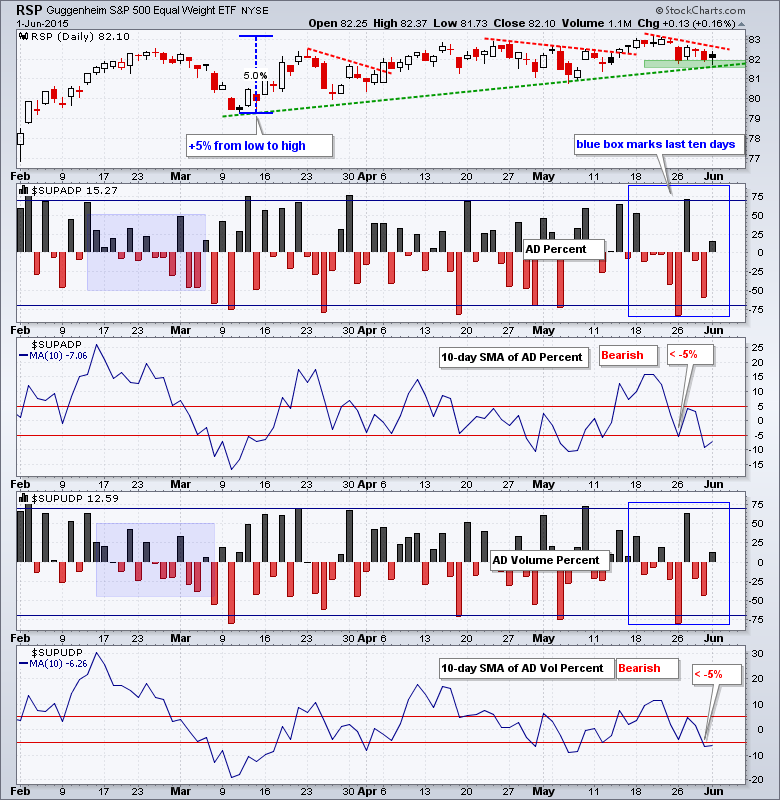
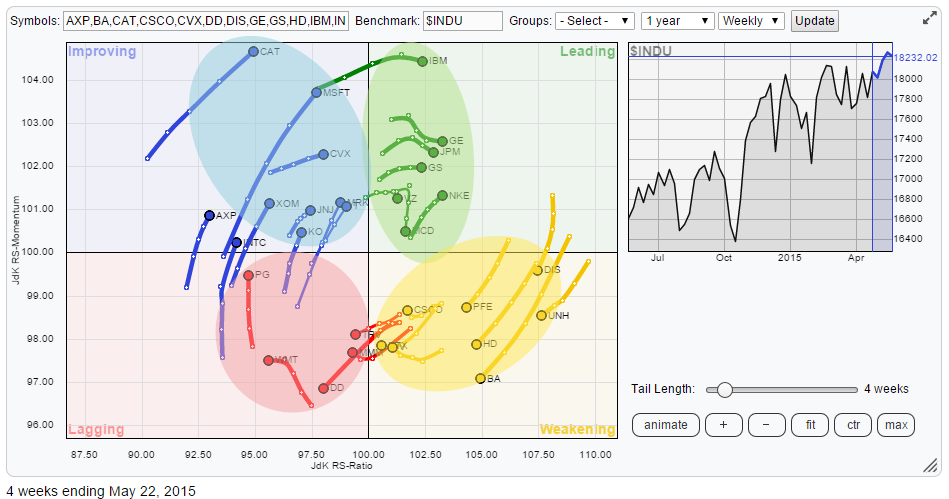
Home Construction ETF Moves Into Leading RRG Quadrant
by Arthur Hill,
Chief Technical Strategist, TrendInvestorPro.com
The Home Construction iShares (ITB) is showing some improvement in relative performance with a move from the improving quadrant to the leading quadrant over the last few days. The image below shows a daily Relative Rotation Graph (RRG) with ten industry group ETFs and the Equal-Weight S&P 500...
READ MORE
MEMBERS ONLY

TECHNICAL SUMMATION FOR IWM, SIX STOCKS KEY TO QQQ, RANKING THE 18 SECTORS, BIOTECHS LEAD HEALTHCARE, GILEAD AND REGENERON LEAD IBB, MERCK HOLDS THE GAP, METALS-MINING-STEEL WEAKEN FURTHER, CATERPILLAR AND US STEEL
by John Murphy,
Chief Technical Analyst, StockCharts.com
TECHNICAL EVIDENCE REMAINS BULLISH FOR IWM ... Link for today's video. The Russell 2000 iShares (IWM) has been lagging the broader market since mid April, but the bulk of the evidence remains bullish. Chart 1 shows IWM with four bullish factors and two bearish factors at work. Working from...
READ MORE
MEMBERS ONLY
Breadth Turns Bearish, IWM Contracts and USO Challenges Channel Line
by Arthur Hill,
Chief Technical Strategist, TrendInvestorPro.com
Stocks were all over the place last week. The S&P 500 plunged on Tuesday, rebounded on Wednesday and fell back on Thursday-Friday. For the week, the major index ETFs ended lower by around 1%. All sectors were lower with energy and industrials leading the way down. The healthcare...
READ MORE
MEMBERS ONLY
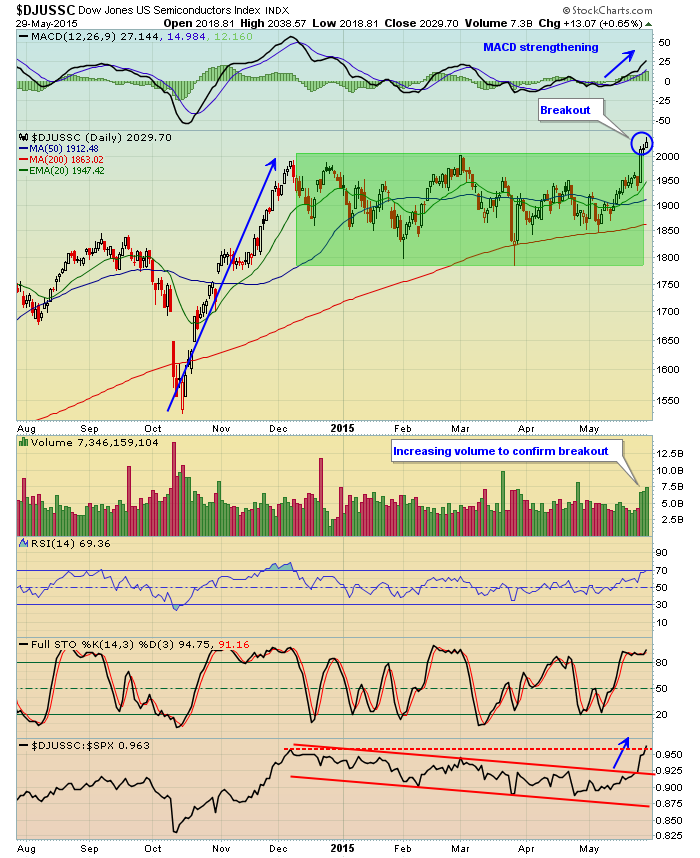
Semiconductors Surge To Fresh New Highs
by Tom Bowley,
Chief Market Strategist, EarningsBeats.com
Just a couple days after finally clearing two month resistance at 1950, the Dow Jones U.S. Semiconductor Index closed above 2000 for the first time in 14 years late last week. Semiconductors tend to move quickly in both directions so given the breakout, I'd be looking for...
READ MORE
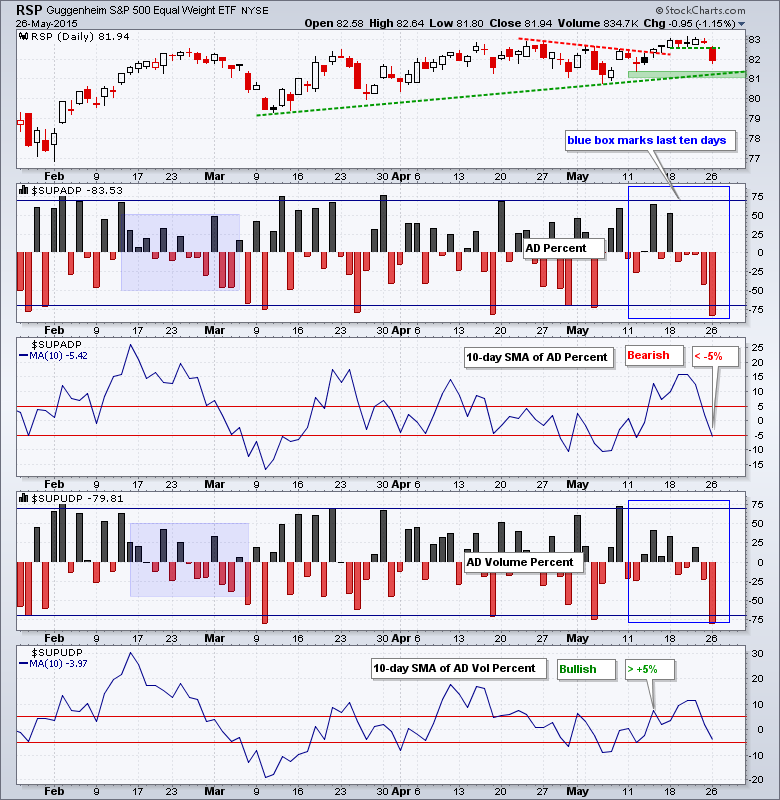
MEMBERS ONLY
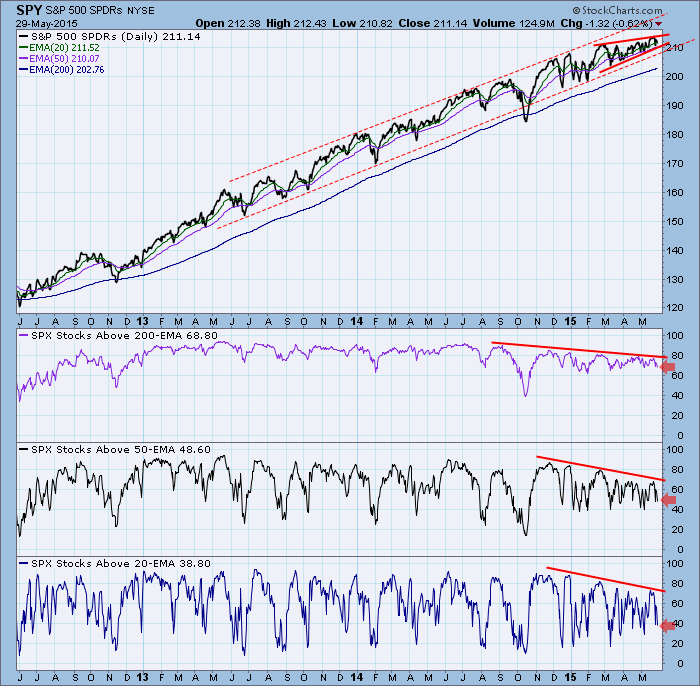
SPY: Negative Divergences Persist

by Carl Swenlin,
President and Founder, DecisionPoint.com
Last week I pointed out in my article that the SPY price chart had a bearish rising wedge pattern, and that there were negative divergences on various medium-term indicator charts. This week we can see that the rising wedge remains intact, but the expectation is that it will resolve to...
READ MORE
MEMBERS ONLY

DOW JONES COMPOSITE AVERAGE CLOSES BELOW ITS 200-DAY LINE AS THE DOW INDUSTRIALS ENDS BELOW 50-DAY LINE -- THE DOW INDUSTRIALS ARE SHOWING NEGATIVE DIVERGENCES OF THEIR OWN -- INDUSTRIALS SPDR APPEARS TO BE FORMING HEAD AND SHOULDERS TOP
by John Murphy,
Chief Technical Analyst, StockCharts.com
DOW JONES COMPOSITE AVERAGE CLOSES BELOW 200-DAY AVERAGE ... I've been writing about the growing negative divergence between the transportation and industrial stocks which has gotten even worse. The Dow Transports fell -2.1% during the week and ended at the lowest level in seven months. It was just...
READ MORE
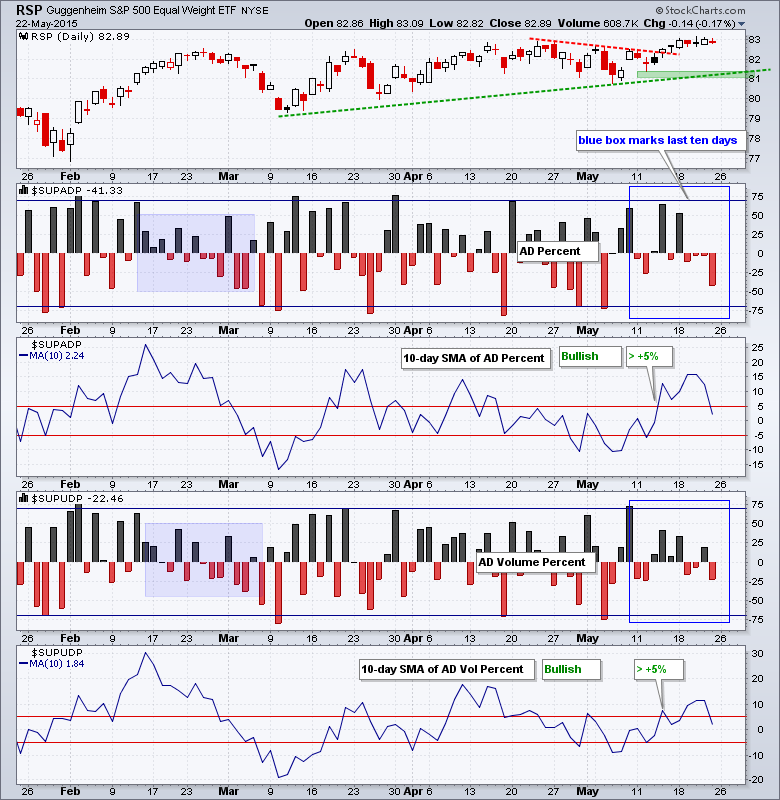
MEMBERS ONLY
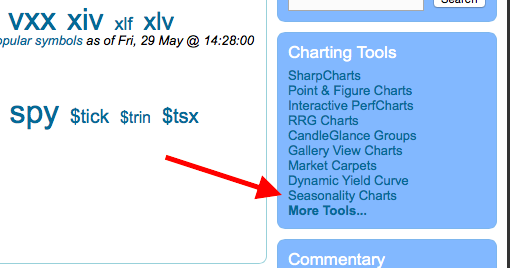
What Does the Seasonality Tool Say About "Sell in May, Go Away"?
by Erin Swenlin,
Vice President, DecisionPoint.com
Everyone is bandying around the term, "Sell in May, Go Away". But how true is it? Given we are seeing bearish patterns on the SPY, overhead resistance has held on strongly, long-term indicators are bearish and it's the end of May; it makes sense that the...
READ MORE
MEMBERS ONLY

SPY GRINDS HIGHER, QQQ LEADS, IWM LAGS, HEALTHCARE-FINANCE-TECH LEAD, CONSUMER DISCRETIONARY STALLS, INDUSTRIALS TAKE A HIT, XRT FAILS AT RESISTANCE
by John Murphy,
Chief Technical Analyst, StockCharts.com
S&P 500 CONTINUES TO GRIND HIGHER... Link for today's video. Price action has been rather boring in the major index ETFs since March, but there is a clear upward bias in price action and the trends remain up. Chart 1 shows the Equal-Weight S&P...
READ MORE
MEMBERS ONLY
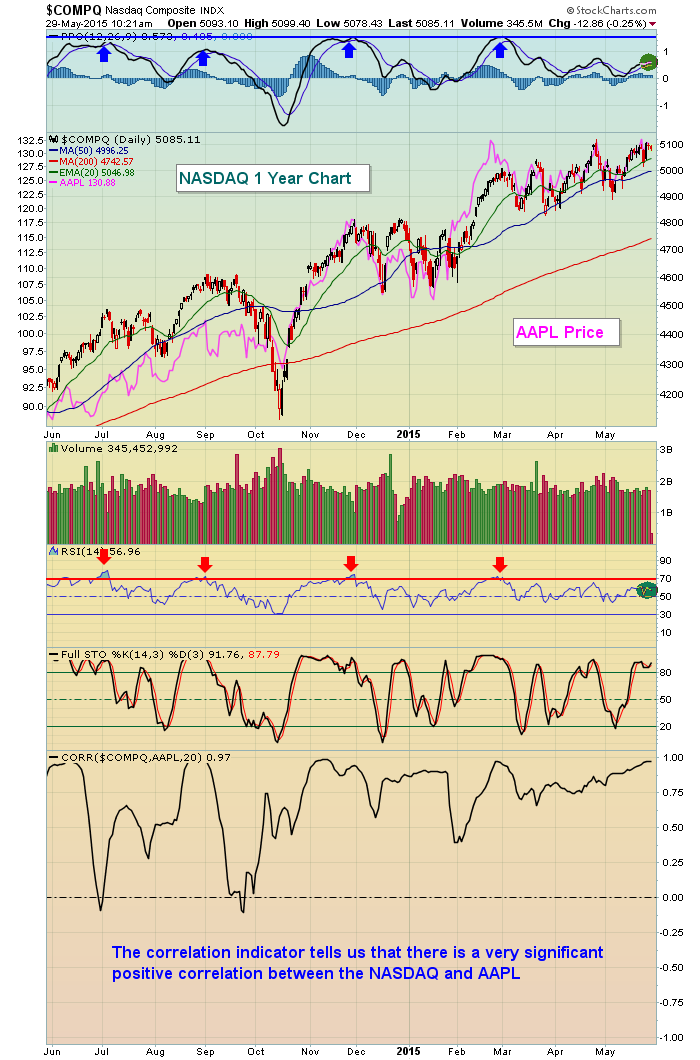
Apple (AAPL) Doesn't Fall Far From The NASDAQ Tree
by Tom Bowley,
Chief Market Strategist, EarningsBeats.com
Apple (AAPL) is more than a $750 billion market cap company, by far the largest on the NASDAQ. Therefore, AAPL's price performance will have a rather significant impact on the overall performance of the NASDAQ as the NASDAQ is a market cap weighted index. In other words, AAPL&...
READ MORE
MEMBERS ONLY

Ten Timeless Tenets of Trading: A 2,500 Year Perspective Part II

by Gatis Roze,
Author, "Tensile Trading"
Art, history and life can parallel investing. This blog is my continuation from last week’s Part I where I encouraged readers to be open to a sort of borderless-type of thinking. To be willing to challenge oneself to look backwards as an aid to moving forwards in the investment...
READ MORE
MEMBERS ONLY
Range Narrows for IWM, Industrials Lag and Tech Leads
by Arthur Hill,
Chief Technical Strategist, TrendInvestorPro.com
Stocks sank on the open, but quickly firmed and rebounded somewhat in the afternoon. For the day, the major index ETFs finished fractionally lower, but the S&P SmallCap iShares (IJR) bucked a little with a fractional gain. The sectors were mostly lower with energy and industrials leading the...
READ MORE
MEMBERS ONLY
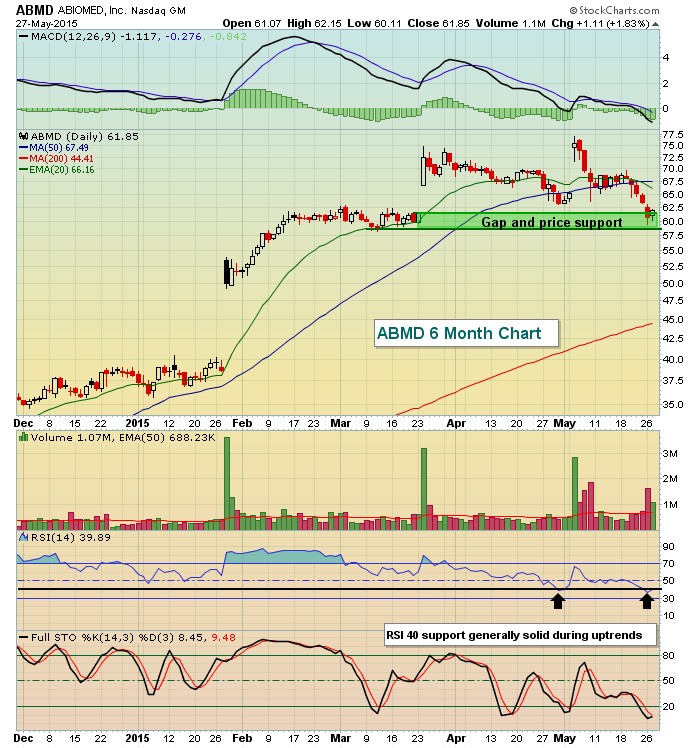
ABIOMED Testing Gap Support
by Tom Bowley,
Chief Market Strategist, EarningsBeats.com
ABIOMED (ABMD) has fallen much of the past three weeks after surging on better-than-expected quarterly earnings results on May 5th. ABMD posted revenues of 67.56 million in its latest quarter, easily surpassing Wall Street forecasts of 62.33 million. In addition, ABMD's EPS trounced estimates, .28 vs....
READ MORE
MEMBERS ONLY

Minimizing Future Regret
by Greg Morris,
Veteran Technical Analyst, Investor, and Author
How many times have you bought something spontaneously, then after you got home regretted the decision? Most spontaneous decisions are based totally upon the emotion at the moment; a snap decision based upon a quick and often faulty evaluation. Examples might be: the big television you bought for the bedroom...
READ MORE
MEMBERS ONLY
QQQ Leads Bounce, RYT Hits New High, USO Maintains Downtrend
by Arthur Hill,
Chief Technical Strategist, TrendInvestorPro.com
Stocks swooned on Tuesday and then recovered most of their losses on Wednesday. Techs led the way as the Technology SPDR (XLK) hit a new high and QQQ closed at a new closing high. Semiconductors led the rebound as the Semiconductor SPDR (XSD) surged over 3% and hit a new...
READ MORE
MEMBERS ONLY

TRANSPORTS STILL DIVERGE FROM INDUSTRIALS -- DJ COMPOSITE AVERAGE IS TESTING 200-DAY AVERAGE AND IS GOING TO NEED HELP FROM THE TRANSPORTS AND UTILITIES TO RESUME ITS UPTREND -- DOLLAR UPTURN INCREASES NEED TO HEDGE FOREIGN CURRENCY RISK
by John Murphy,
Chief Technical Analyst, StockCharts.com
INDUSTRIALS NEED SOME HELP FROM THE TRANSPORTS... I remain concerned about the negative divergence between the Dow Industrials (black bars) and the Dow Transports (red bars). The discrepancy between the two Dow Averages is the biggest in three years. That may not pull the Industrials lower, but it may prevent...
READ MORE
MEMBERS ONLY
Gap Trading: A Case Study
by Tom Bowley,
Chief Market Strategist, EarningsBeats.com
Gaps are strange creatures and knowing what to do after one is difficult because emotion does crazy things to our patience and discipline. Gaps 101 tells us that most gaps fill. What does that mean? Well, if ABC company closed yesterday at 10.00 and opened today at 11.00,...
READ MORE
MEMBERS ONLY
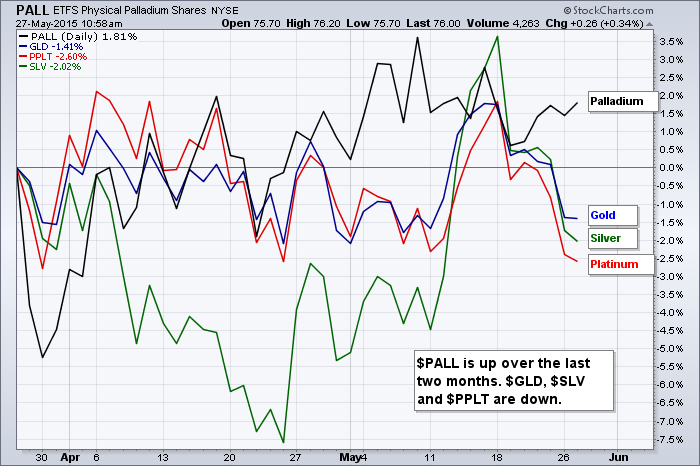
Palladium Holds Up Better than Gold
by Arthur Hill,
Chief Technical Strategist, TrendInvestorPro.com
The Palladium ETF (PALL) caught my eye on Tuesday because it held up quite well when other metals were getting hit hard. Gold was down around 1.5%, while platinum and silver fell around 2%. PALL was down just .26% and the ETF is edging higher in early trading on...
READ MORE
MEMBERS ONLY
IWM Breaks Support, TLT Breaks Resistance and GLD Plunges
by Arthur Hill,
Chief Technical Strategist, TrendInvestorPro.com
Stocks fell with selling pressure across the board. The major index ETFs were all down around 1% and the declines were pretty even. All sector SPDRs and equal-weight sector ETFs were down. The Consumer Discretionary SPDR (-.71%) and the Utilities SPDR (-.63%) were down the least and held...
READ MORE
MEMBERS ONLY
Think 'twice' before buying 3M

by Julius de Kempenaer,
Senior Technical Analyst, StockCharts.com
The 30 stocks that make up the Dow Jones Industrials index are more or less evenly spread out over the Relative Rotation Graph below.
There is a group of stocks that has entered the leading quadrant a few weeks ago and which are establishing solid relative up-trends including the stocks...
READ MORE
MEMBERS ONLY

Is It Too Late To Sell In May?
by Martin Pring,
President, Pring Research
* World Stock ETF falls to important support.
* Key bond confidence indicator at a key level.
* Dollar offering stronger signals that the correction is over.
Global Stocks
A couple of weeks ago I drew your attention to the $61 area on the MSCI World Stock ETF, the ACWI, as I felt...
READ MORE
MEMBERS ONLY

The Stopping Action of a Downtrend
by Bruce Fraser,
Industry-leading "Wyckoffian"
A downtrend occurs when the supply (of shares) is greater than the demand. The float of a stock is the total number of shares owned by investors and traders in the marketplace. With the exception of corporate buybacks and secondary offerings, the float of a stock is relatively constant and...
READ MORE
MEMBERS ONLY

MEDIUM TERM TRENDS FOR SPY AND MDY, HEALTHCARE PROVIDERS REMAIN STRONG, WEAK YEN AND EURO PROPEL DOLLAR, OIL AND ENERGY GET HIT, GOLD TESTS WEDGE TREND LINE, VIDEO EXTRAS
by John Murphy,
Chief Technical Analyst, StockCharts.com
MAJOR INDEX ETFS PULLBACK WITHIN UPTRENDS... Link for today's video. Stocks came under selling pressure on Tuesday with small-caps, mid-caps and large-techs leading the way. At this point, today's decline is just a little noise within a bigger uptrend. The stock market has been working its...
READ MORE
MEMBERS ONLY
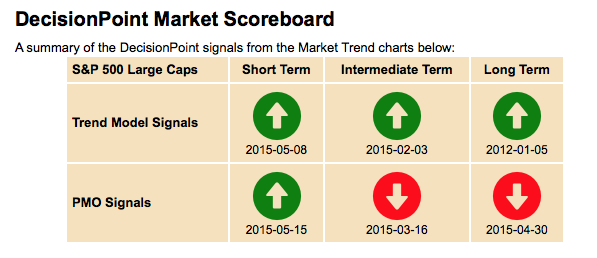
Check Out the NEW DP Scoreboard in the DP Chart Gallery!
by Erin Swenlin,
Vice President, DecisionPoint.com
We gave our webinar viewers a sneak peek at the new scoreboard and now it is LIVE! A picture of the SPX scoreboard is below:
For members, there is a drop-down menu on the side where you can switch between the NDX, OEX and DJIA. You'll find the...
READ MORE
MEMBERS ONLY
SPY Holds Uptrend, IWM Still Lags, UUP Breaks Out and Oil Trends Lower
by Arthur Hill,
Chief Technical Strategist, TrendInvestorPro.com
The S&P 500 finished the week with a gain, but was hit with selling pressure in the final hour on Friday. For the week, the index surged on Monday and then traded flat from Tuesday to Friday. Small-caps led Friday's pullback as the Russell 2000 iShares...
READ MORE
MEMBERS ONLY
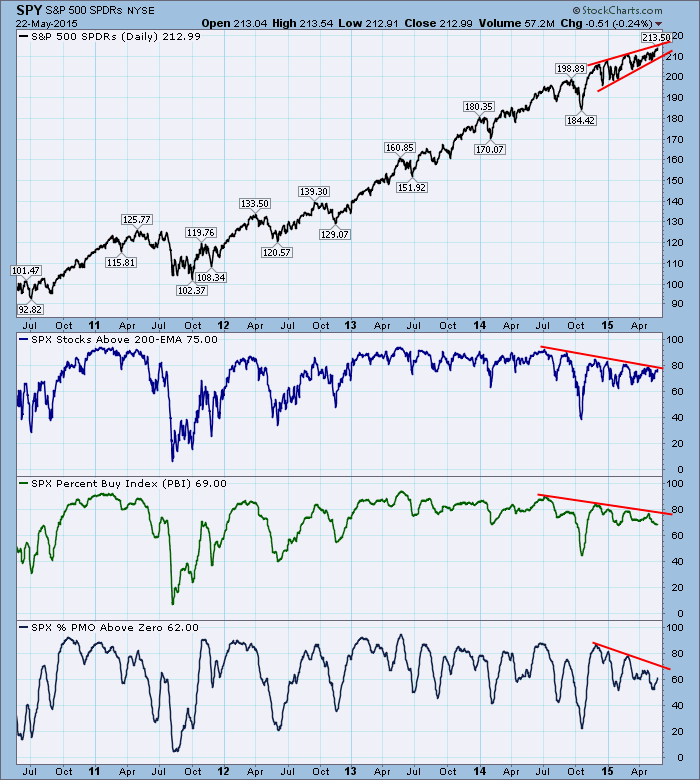
SPY Rising Wedge Implies Correction
by Carl Swenlin,
President and Founder, DecisionPoint.com
One of the things I have regularly stressed is the reliability of rising wedge formations, meaning that they have a high likelihood of breaking down. Currently, SPY has a pronounced rising wedge that has been forming over the last six months or so, as seen on the chart below. The...
READ MORE