MEMBERS ONLY

MID-CAP BREADTH LEADS, EQUAL-WEIGHT CONFIRMS CAP-WEIGHT, IWM SIGNAL FOLLOW UP, GE LEADS INDUSTRIALS, HEALTHCARE AND TECH LEAD SCTRS, FOUR TECH STOCKS WITH A 3-STEP SETUP

by John Murphy,
Chief Technical Analyst, StockCharts.com
INTERNAL STRENGTH CONFIRMS EXTERNAL STRENGTH... Link for today's video. The weight of the evidence is still bullish for stocks in general. As detailed below, several key index ETFs hit new highs and we are seeing leadership in three big sectors that account for almost half of the S&...
READ MORE
MEMBERS ONLY
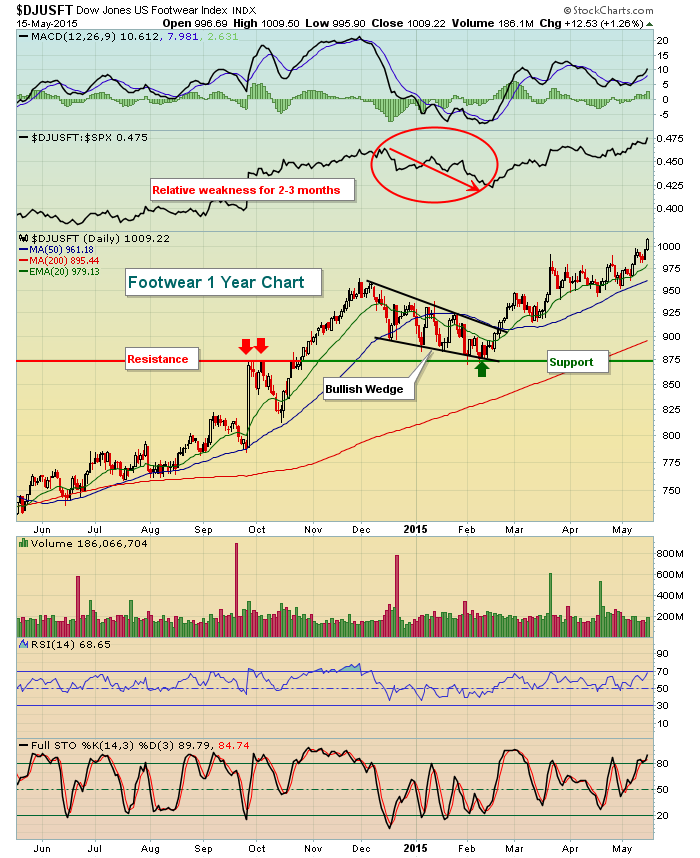
Bullish Industry Groups Awaiting Breakouts

by Tom Bowley,
Chief Market Strategist, EarningsBeats.com
One of the advantages that the technical trader carries in his/her back pocket is the ability to visualize the future price action before it happens - based on the prior price action. Trending price action to the upside is generally followed by bullish continuation patterns. Periods of consolidation can...
READ MORE
MEMBERS ONLY

Ten Timeless Tenets of Trading: A 2,500 Year Perspective

by Gatis Roze,
Author, "Tensile Trading"
For those of you who pooh-pooh the lessons of history, listen up! I myself am guilty of being overly focused on today’s web – obsessed with the latest hot stocks, investment technologies and trading methodologies. But at times, it’s important to challenge oneself to look backwards as an aid...
READ MORE
MEMBERS ONLY
SPY Leads with New High, TLT Firms in Oversold Territory and UUP Holds Breakout

by Arthur Hill,
Chief Technical Strategist, TrendInvestorPro.com
The S&P 500 edged higher on Thursday, but market action was mixed overall. QQQ and SPY closed slightly higher, while IWM closed slightly lower. Seven of the nine sector SPDRs were up with energy, industrials and technology leading the way. XLI got a nice bounce from GE, which...
READ MORE
MEMBERS ONLY
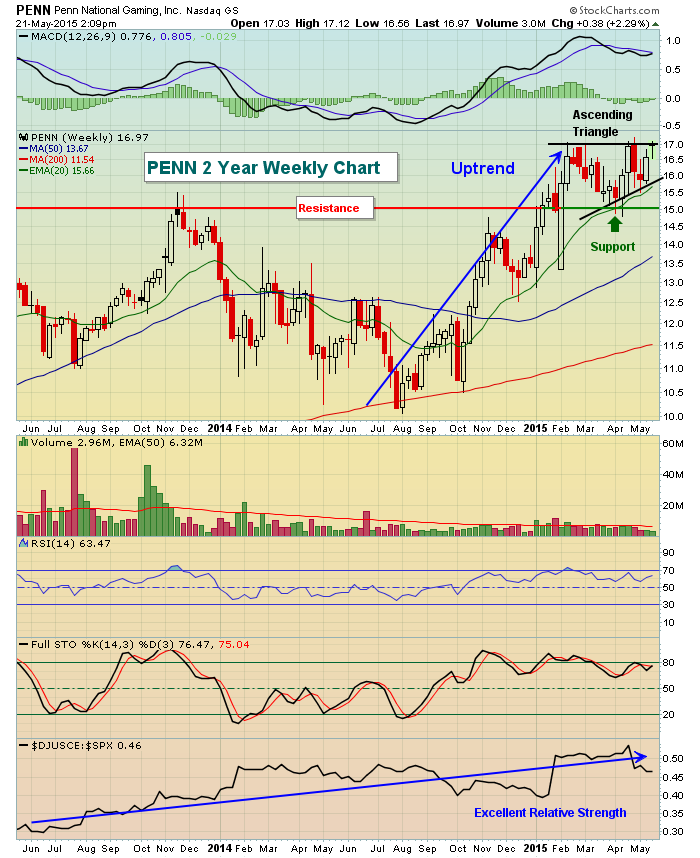
Penn National (PENN) Awaiting Breakout
by Tom Bowley,
Chief Market Strategist, EarningsBeats.com
The Dow Jones U.S. Gambling Index ($DJUSCA) has been under pressure for quite some time with many gambling stocks under pressure as well. That has not been the case for Penn National Gaming (PENN), however, as it's been in an uptrend and has been a tremendous relative...
READ MORE
MEMBERS ONLY
IWM Starts to Lead, RYH Leads Sectors and UUP Holds Breakout
by Arthur Hill,
Chief Technical Strategist, TrendInvestorPro.com
Stocks did the old pop and drop as the S&P 500 surged to 2135 after the Fed minutes and then plunged back to its starting point (2125). The index ended the day unchanged and nothing has changed regarding the trend. Yesterday's pop and drop was just...
READ MORE
MEMBERS ONLY

Is it Time for the Dollar Bull Market to Resume?

by Martin Pring,
President, Pring Research
* Dollar Index ETF experiences a 38% Fibonacci correction and bounces.
* Key dollar relationships either at or just above major support.
* One way or another individual major currencies look vulnerable.
The Dollar Index ($USD) has been correcting for the last 9 weeks causing some observers to question the legitimacy of the...
READ MORE
MEMBERS ONLY

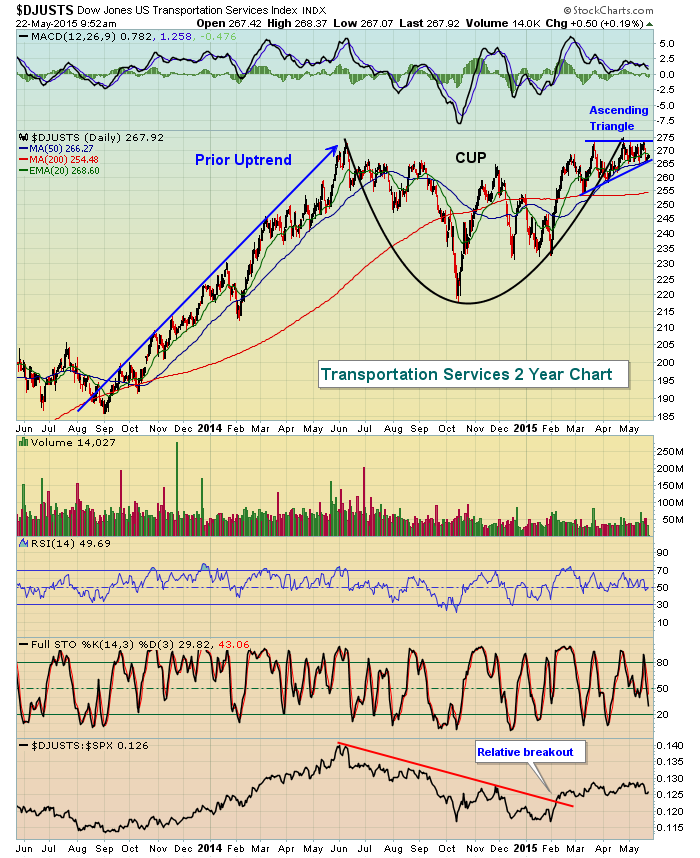
AIRLINES LEAD DOW TRANSPORTS TO SEVEN MONTH LOW -- SEVERAL AIRLINE STOCKS BREAK 200-DAY AVERAGES IN HEAVY TRADING -- RAILS AND TRUCKERS ARE ALSO IN DOWNTREND
by John Murphy,
Chief Technical Analyst, StockCharts.com
DOW TRANSPORTS FALL TO SEVEN-MONTH LOW... The chart picture for the Dow Tranports continues to weaken. Chart 1 shows the Dow Jones Transportation Average falling nearly 2% today and dropping to the lowest level since last October. It also fell further below its 200-day moving average. Although the rails and...
READ MORE
MEMBERS ONLY
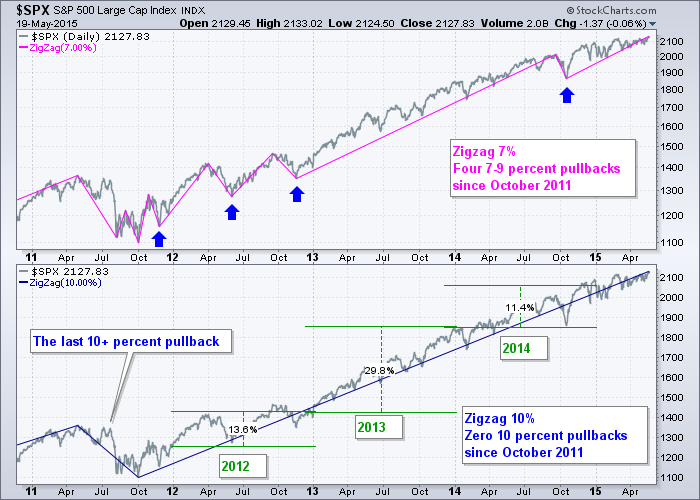
What Matters Most for the S&P 500?
by Arthur Hill,
Chief Technical Strategist, TrendInvestorPro.com
The S&P 500 is in the midst of one of the strongest and most consistent trends ever. The chart below shows the S&P 500 twice. The top window shows the index with a 7% Zigzag indicator in pink and the bottom window shows a 10% Zigzag....
READ MORE
MEMBERS ONLY
TLT Becomes More Oversold, UUP Breaks Out, GLD Fails First Test
by Arthur Hill,
Chief Technical Strategist, TrendInvestorPro.com
Stocks meandered on Tuesday with the S&P 500 trading on either side of 2130 the entire day. The ETF fell below 2130 in the afternoon and closed at 2127 (-.06%). The sectors were mostly lower with energy leading the decline. The Finance SPDR (XLF) was the strongest...
READ MORE
MEMBERS ONLY

Small Caps Get On Board with PMO BUY Signals

by Erin Swenlin,
Vice President, DecisionPoint.com
I noticed today in the DP Reports paid blog that IJR, the S&P 600 ETF, generated a Price Momentum Oscillator (PMO) BUY signal on the DecisionPoint Market/Sector Summary Report. So I followed the rabbit down the hole and decided to check the iShares Russell 2000 ETF, IWM...
READ MORE
MEMBERS ONLY

Richard D. Wyckoff's REAL Rules of the Game

by Bruce Fraser,
Industry-leading "Wyckoffian"
Stock prices are constantly impacted by large and small forces. These forces propel prices endlessly up and down. If we can make sense of these forces and identify their influence, we can learn to anticipate stock price movements.
Richard D. Wyckoff was determined to know the real reasons behind stock...
READ MORE
MEMBERS ONLY

WEBINAR, MDY AND SPY BREADTH, MARKETS ZIGZAG, OVERVIEW OF 9 SECTOR SPDRS, FIVE LEADING INDUSTRY GROUP ETFS, DOLLAR CORRELATION WITH COPPER-GOLD-OIL, BONDS HIT KEY LEVEL, SIX STOCK SETUPS
by John Murphy,
Chief Technical Analyst, StockCharts.com
AD LINES CONFIRM NEW HIGHS IN SPY AND MDY... When the major stock indices hit new highs, the first thing I do is check corresponding breadth indicators for confirmation. Breadth indicators tell us what is happening within the underlying indices. So far, the S&P 500 SPDR (SPY), the...
READ MORE
MEMBERS ONLY
4 Stocks That May Be Bottoming
by Tom Bowley,
Chief Market Strategist, EarningsBeats.com
We've been in a six year bull market where most stocks have been trending higher. But not every industry group and stock follows the primary trend higher. In fact, catching a falling stock just as it hits rock bottom can provide a big lift to your portfolio. So...
READ MORE
MEMBERS ONLY
Small-Caps Start to Lead as Dollar Bounces, SPY Hits New High, GLD Holds Breakout and USO Stalls
by Arthur Hill,
Chief Technical Strategist, TrendInvestorPro.com
Stocks continued higher with the S&P 500 and Dow Industrials recording new all time highs. They were not the leaders though. The Russell 2000 iShares (IWM) led and was the only major index ETF to gain over 1% on the day. Seven of the nine sector SPDRs finished...
READ MORE
MEMBERS ONLY

Technical Analysis Boot Camp

by Greg Morris,
Veteran Technical Analyst, Investor, and Author
At some point in my life I came to the conclusion that military boot camp accomplishes something that would be truly useful for investors, in particular, technical analysts. Boot camp, officer candidate school, etc. are all designed to accomplish a few things. One is to weed out those who cannot...
READ MORE
MEMBERS ONLY
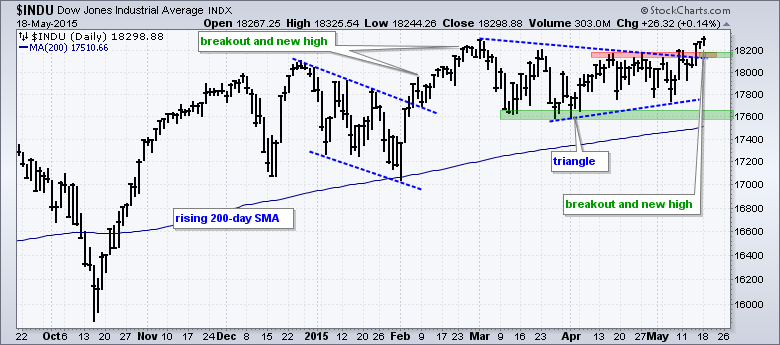
Dow Joins S&P 500 with New High
by Arthur Hill,
Chief Technical Strategist, TrendInvestorPro.com
The S&P 500 hit a new high last week and the Dow Industrials followed suit with a new high this week. Overall, the Dow broke triangle resistance with a surge on Thursday and this breakout signals a continuation of the current uptrend. Broken resistance turns first support to...
READ MORE
MEMBERS ONLY

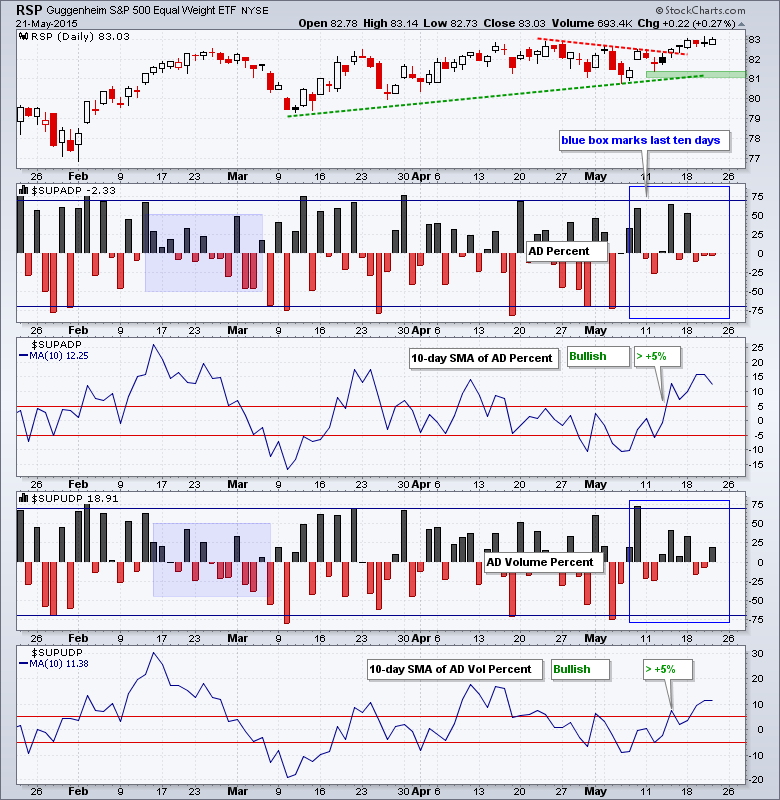
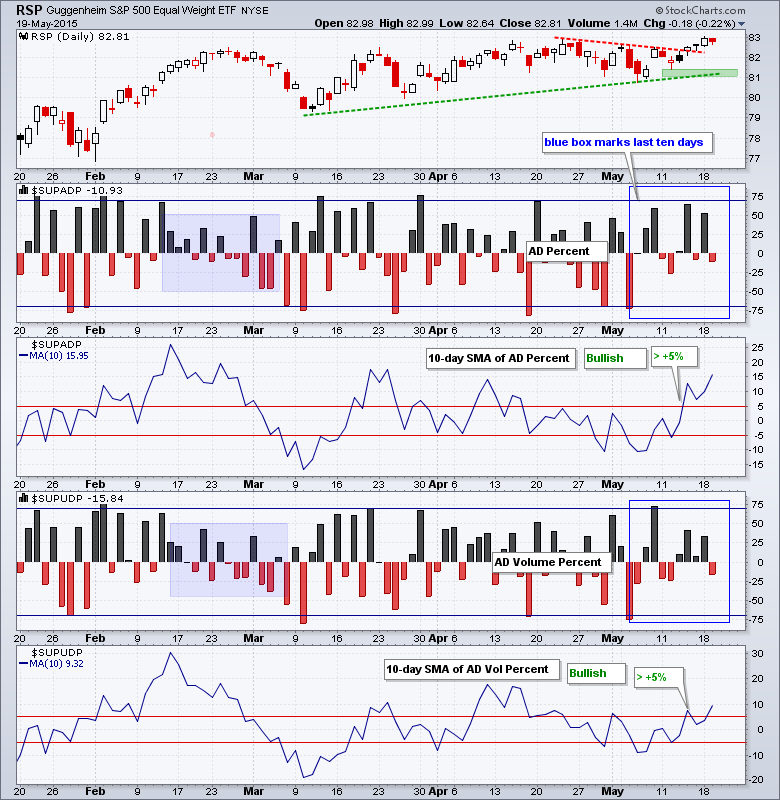
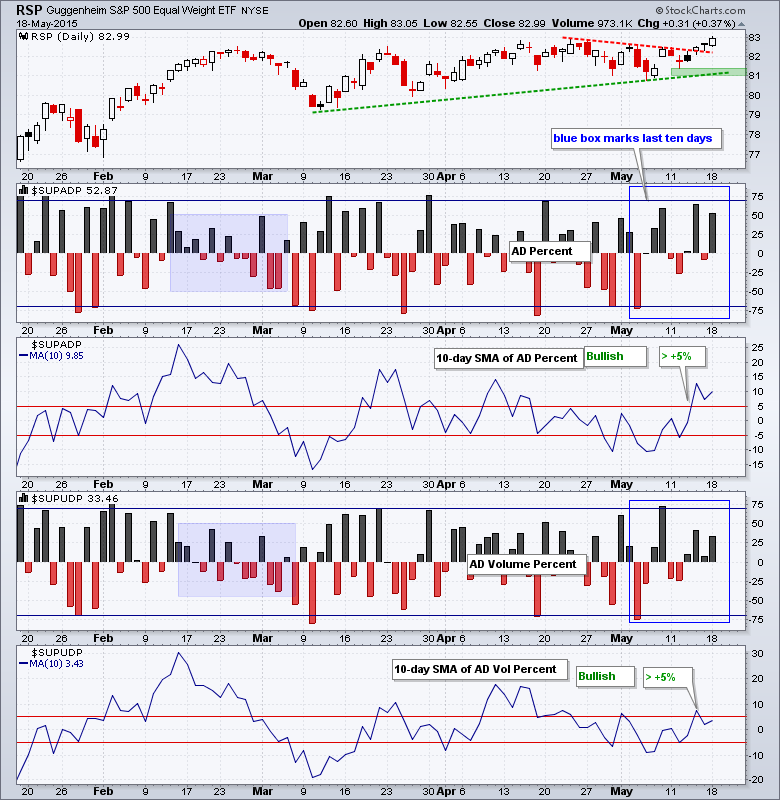
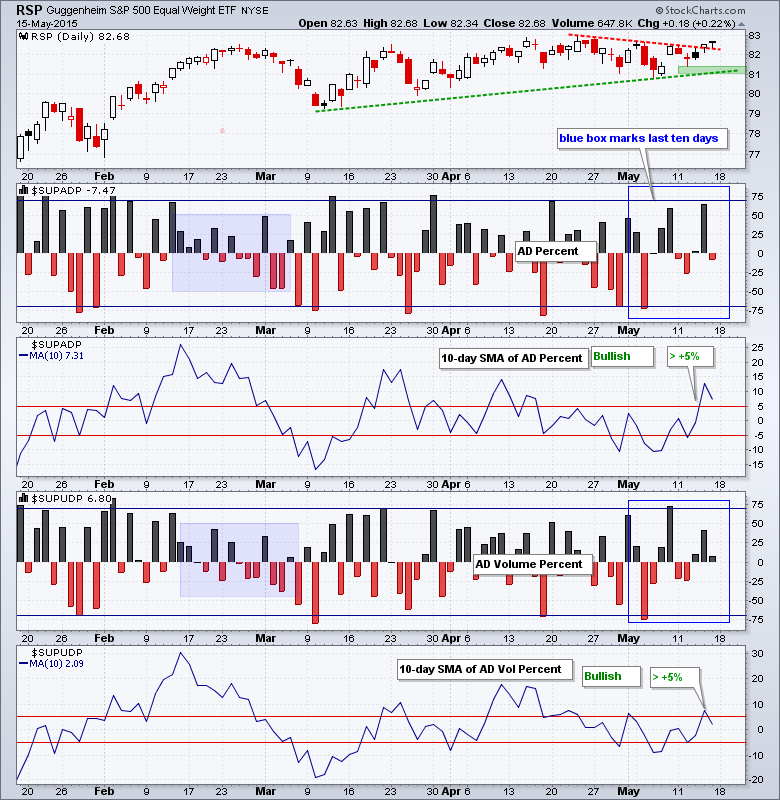
EW S&P 500 STALLS NEAR HIGHS, SEMI SPDR BREAKS OUT, THREE SEMICONDUCTOR STOCK BREAKOUTS, AIRLINE INDEX CORRECTION, THREE AIRLINE STOCKS, THE REAL COMMODITY LEADERS
by John Murphy,
Chief Technical Analyst, StockCharts.com
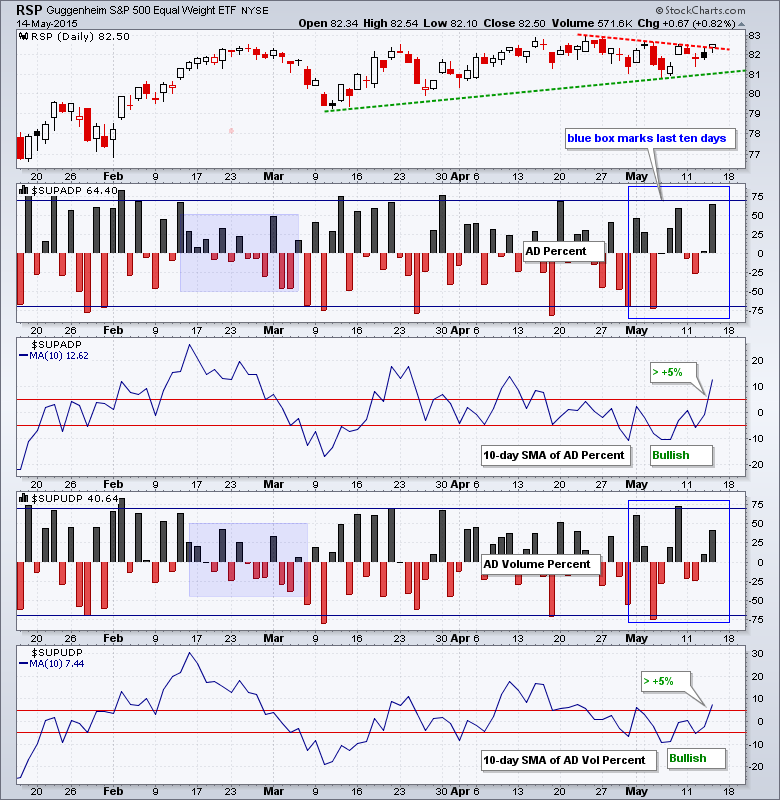
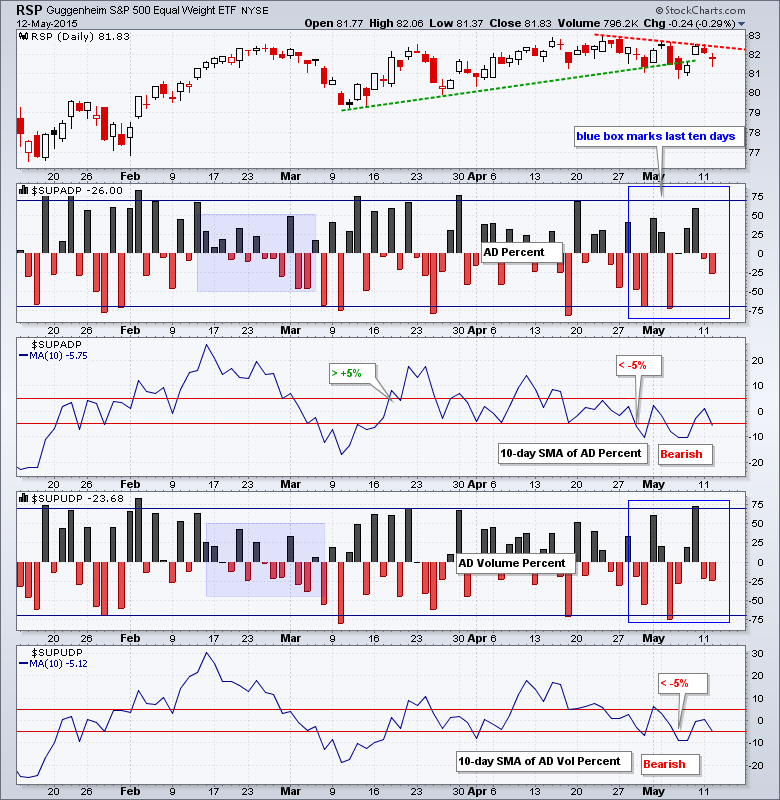
EQUAL-WEIGHT S&P 500 CONSOLIDATES NEAR HIGHS... Link for today's video. The EW S&P 500 ETF (RSP) has yet to confirm the new high in the S&P 500 SPDR (SPY), but RSP is close to a new high and the current uptrend favors...
READ MORE
MEMBERS ONLY
EW Industrials Leads Sector Surge - SPY Hits New High
by Arthur Hill,
Chief Technical Strategist, TrendInvestorPro.com
It was a pretty wild week for stocks. The S&P 500 started weak with a 25 point decline and dip below 2090. This dip did not last long as the index surged back above 2115 on Thursday and hit an all time high on Friday. Yes, an all...
READ MORE
MEMBERS ONLY
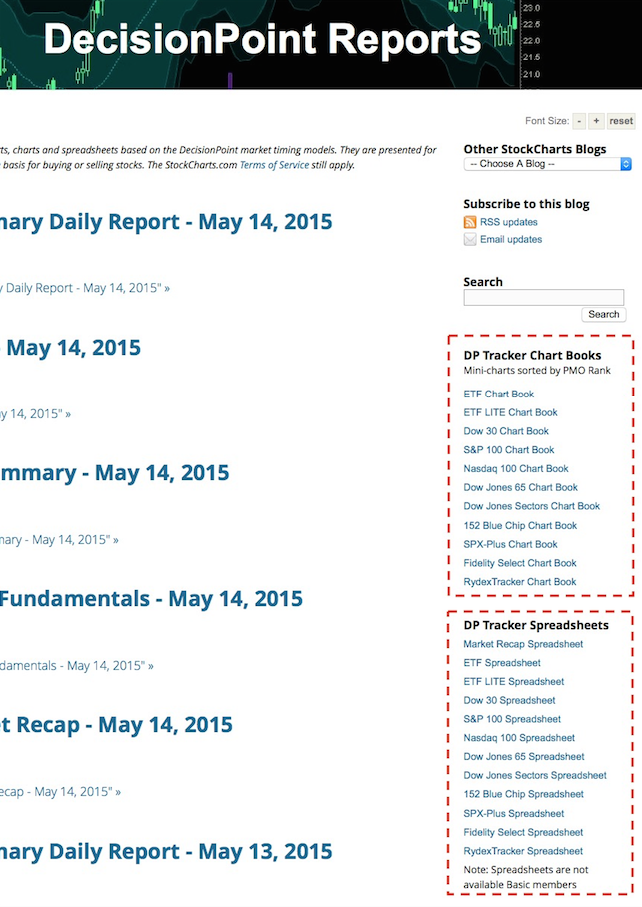
Trend Model Signals Now In DP Tracker Spreadsheets

by Carl Swenlin,
President and Founder, DecisionPoint.com
Recently StockCharts.com stopped publishing the DecisionPoint Tracker reports, but links to the Tracker Chart Books and Spreadsheets are still available in the DP Reports Blog. The Tracker Spreadsheets provide the same information as the old reports, but it is in a much more compact format. Additionally, we have added...
READ MORE
MEMBERS ONLY
Transports and Utilities are Holding Market Back
by John Murphy,
Chief Technical Analyst, StockCharts.com
I've been writing about the continuing discrepancy between three Dow Averages. But things may be starting to improve. Chart 1 shows the Dow Industrials closing at a three-month high and just shy of its early March peak. [The S&P 500 ended at a record close]. All...
READ MORE
MEMBERS ONLY
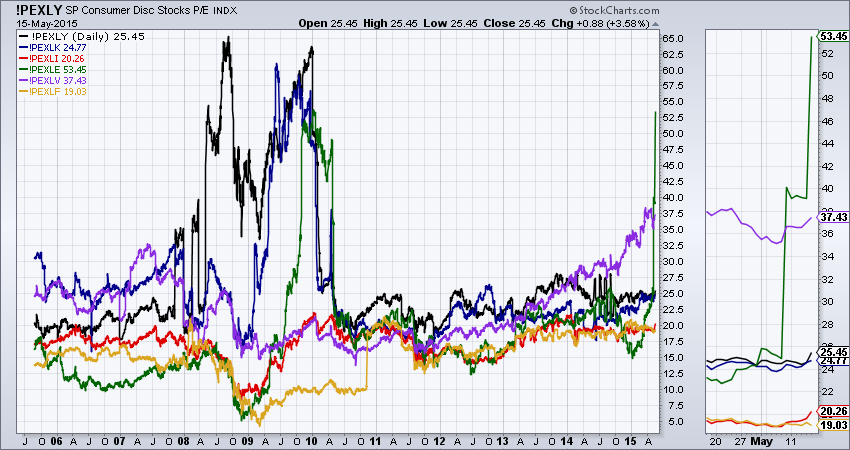
Sector P/E Ratios Fall Into Two Groups
Hello Fellow ChartWatchers!
Last time I reviewed our PE Ratio symbols for several major indexes (!PEDOW,!PESPX, !PEOEX, and !PENDX) and promised that this time around I'd show you the PE Ratio symbols we have for the nine S&P Sectors. Promise fulfilled!
(click for live version)...
READ MORE
MEMBERS ONLY
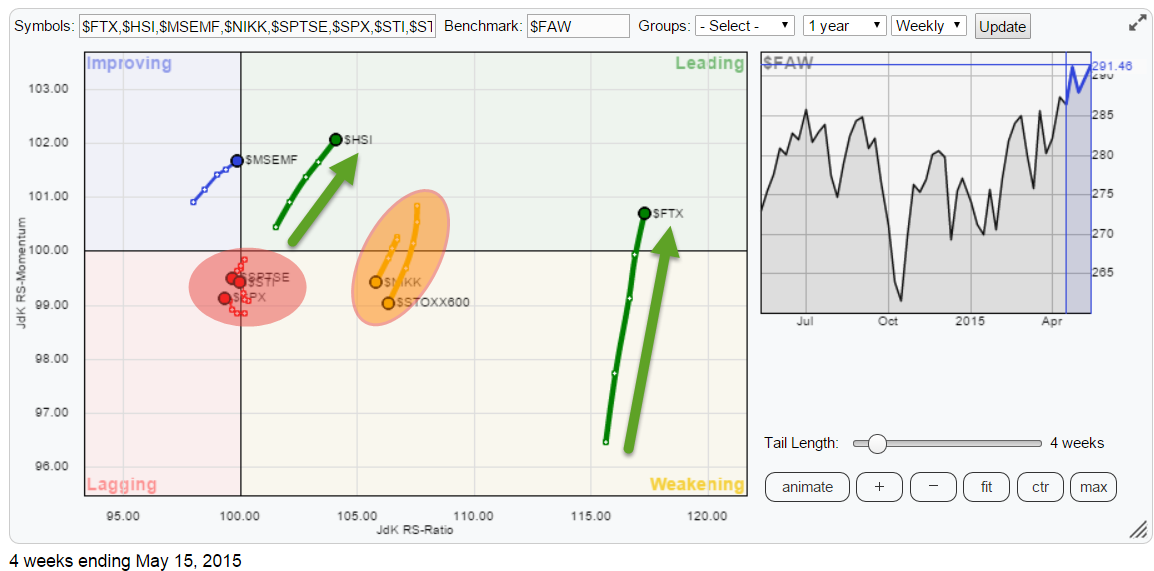
Hong Kong ($HSI) on track towards all-time-high

by Julius de Kempenaer,
Senior Technical Analyst, StockCharts.com
The Relative Rotation Graph below holds a number of world equity indices and shows their relative rotation versus the FTSE all world index ($FAW).
click the chart to open the live RRG
Initial observations
A couple of quick observations from the RRG before we move into more detail of the...
READ MORE
MEMBERS ONLY
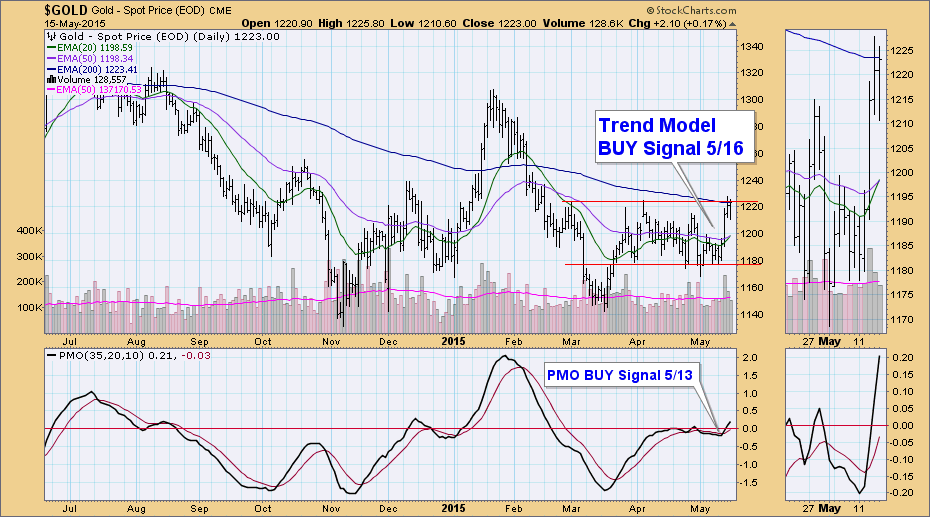
Trend Model Joins PMO with BUY Signal on Gold
by Erin Swenlin,
Vice President, DecisionPoint.com
As of 5/16/2015 Gold is on a Trend Model BUY signal. The 20-EMA crossed above the 50-EMA triggering the new intermediate-term Trend Model to initiate a BUY signal. The long-term Trend Model, which informs our long-term outlook, is on a SELL signal as of 2/15/2013, so...
READ MORE
MEMBERS ONLY

DOW INDUSTRIALS HIT THREE-MONTH HIGH -- WEAKER TRANSPORTS AND UTILITIES SHOW SOME IMPROVEMENT -- BOND YIELDS TURN DOWN AS BOND PRICES BOUNCE OFF CHART SUPPORT -- THAT HELPS HOMEBUILDERS, REITS, AND TELECOM ETFS STAY ABOVE 200-DAY LINES
by John Murphy,
Chief Technical Analyst, StockCharts.com
TRANSPORTS AND UTILITIES ARE HOLDING MARKET BACK ... I've been writing about the continuing discrepancy between three Dow Averages. But things may be starting to improve. Chart 1 shows the Dow Industrials closing at a three-month high and just shy of its early March peak. [The S&P...
READ MORE
MEMBERS ONLY
Consumer Electronics Need A Wake Up Call
by Tom Bowley,
Chief Market Strategist, EarningsBeats.com
Over the past month, the Consumer Electronics Index ($DJUSCE) has fallen close to 9%, which ranks it as the third worst performing industry group. Only gambling stocks (-12.64%) and business training & employment agencies (-15.68%) - two consumer discretionary industry groups - have performed worse. Normally, I tend...
READ MORE
MEMBERS ONLY
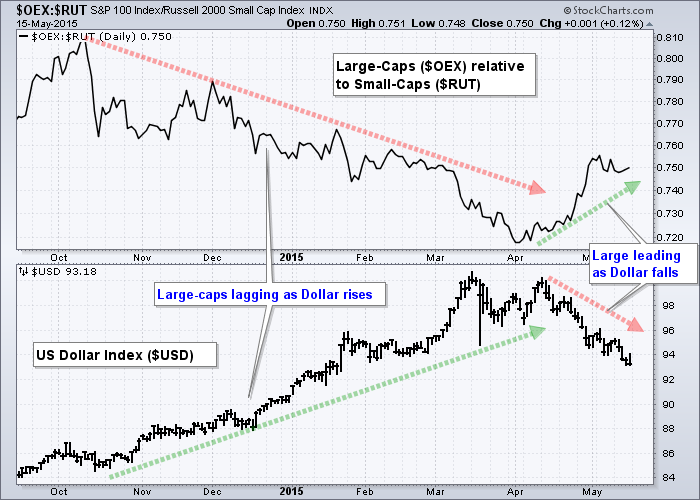
Weakening Dollar Boosts Large-cap Stocks
by Arthur Hill,
Chief Technical Strategist, TrendInvestorPro.com
The falling Dollar is boosting large-caps and they are outperforming small-caps. This makes sense because large-caps are typically multinational companies that derive a good portion of their revenue abroad. The Financial Times estimates that companies in the S&P 500 generate around 40% of their revenues abroad. These foreign...
READ MORE
MEMBERS ONLY

OEX LEADS, IWM TRIGGERS BULLISH SIGNAL, INDUSTRIALS PERK UP, CONSUMER DISCRETIONARY LAGS, 5 BOLLINGER BAND BREAKOUTS, OIL WEAKENS DESPITE EURO STRENGTH, XLE WEAKENS BELOW KEY MOVING AVERAGE
by John Murphy,
Chief Technical Analyst, StockCharts.com
OEX LEADS WITH FIRST NEW HIGH... Link for today's video. The S&P 100 ($OEX) represents large-caps and this index is the first to hit a new high here in May. The S&P 500 reached a closing high on Thursday, but fell short of a...
READ MORE
MEMBERS ONLY

The Most Profitable Takeaways from 'The Traders Journal'
by Gatis Roze,
Author, "Tensile Trading"
After many years of writing The Traders Journal, I thought it was time to revisit how investors can best maximize the takeaways from these weekly blogs.
First and foremost, the reader should understand that my perspective is somewhat irreverent since it is based on the past 25 years of trading...
READ MORE
MEMBERS ONLY
SPY Leads, IWM Falls Short and GLD Gets Breakout
by Arthur Hill,
Chief Technical Strategist, TrendInvestorPro.com
The S&P 500 opened strong and finished strong, and Thursday's close above 2120 was a new closing high for the index. The index has yet to hit an intraday high, but the trends are up and new intraday highs should follow. The rally was pretty broad-based,...
READ MORE
MEMBERS ONLY

Five Blogs I Subscribe to that You Should Too!
by Erin Swenlin,
Vice President, DecisionPoint.com
Don't get me wrong, EVERY blog on StockCharts.com is brilliant, but when my time is limited, there are five blogs that I make a point NEVER to miss! How can I make sure that I know right away when those blogs contain a new article? I click...
READ MORE
MEMBERS ONLY

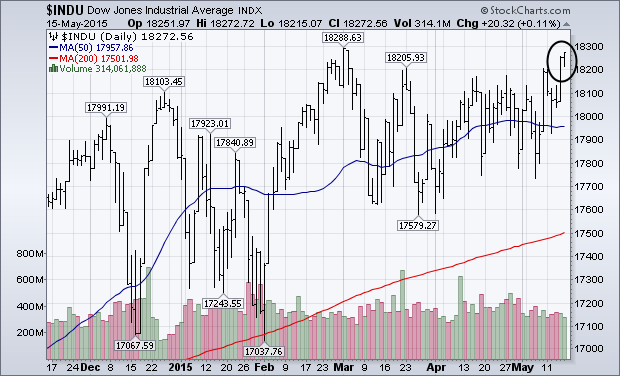
DOW INDUSTRIALS REACH THREE MONTH HIGH -- TWO OF ITS BIGGEST GAINERS ARE MICROSOFT AND VISA -- S&P 500 EXCEEDS LAST FRIDAY'S HIGH -- MIDCAPS EXCEED 50-DAY LINE -- SMALL CAPS MAY BE NEXT -- FACEBOOK AND ADOBE LEAD QQQ HIGHER
by John Murphy,
Chief Technical Analyst, StockCharts.com
DOW INDUSTRIALS NEAR 2015 HIGH ... Stocks are having a strong day. More importantly, several stock indexes are breaking through overhead resistance barriers, or are very close to doing so. Chart 1 shows the Dow Jones Industrial Average trading at the highest level in nearly three months. That puts it in...
READ MORE
MEMBERS ONLY
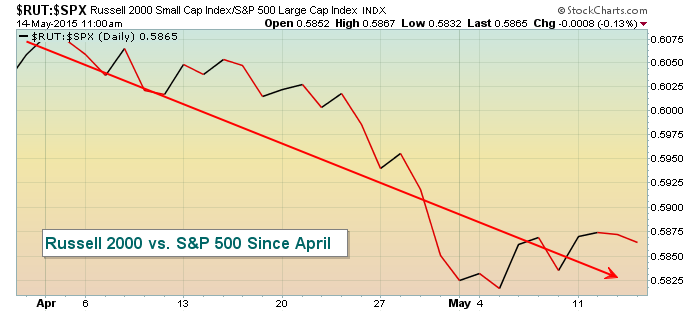
Russell 2000 Relative Performance Suggests Caution
by Tom Bowley,
Chief Market Strategist, EarningsBeats.com
During my webinar yesterday, I indicated that I'd take a look at the Russell 2000 ($RUT) and its lagging performance, but then I was sidetracked by other charts and questions. So I'll take an opportunity here in my blog to provide you those Russell 2000 comments....
READ MORE
MEMBERS ONLY

Secular Bears
by Greg Morris,
Veteran Technical Analyst, Investor, and Author
Secular Bulls and Secular Bears is terminology that I don’t ever recall hearing more than 15-20 years ago. Now I see the term bandied about all of the time and often it is different in a number of ways. For full disclosure, my entire education on secular markets comes...
READ MORE
MEMBERS ONLY
Short-Term Trend Analysis 14-May-15
by Arthur Hill,
Chief Technical Strategist, TrendInvestorPro.com
The S&P 500 did just the opposite of Tuesday. The index opened weak on Tuesday, rebounded and then traded flat. On Wednesday, the index opened strong, immediately fell back and then traded flat. This is par for the course because it has been swinging above/below 2100 the...
READ MORE
MEMBERS ONLY

Why Is $61 Such An Important Number?
by Martin Pring,
President, Pring Research
* Key levels for the MSCI World Stock ETF.
* Asia Ex Japan and Japan ETF’s can support higher prices.
* Latin America and the Middle East look the most vulnerable.
Occasionally a specific price can show up as a pivotal number that provides a valuable clue as to the probable direction...
READ MORE
MEMBERS ONLY

10-YEAR BOND YIELD HOLDS ABOVE 200-DAY AVERAGE -- BANKS BENEFIT FROM HIGHER YIELDS -- BANK ETF HITS NEW SEVEN YEAR HIGH -- PERCENTAGE LEADERS ARE KEYCORP, COMERICA, AND FIFTH THIRD BANCORP -- FALLING DOLLAR IS BOOSTING PRECIOUS METALS
by John Murphy,
Chief Technical Analyst, StockCharts.com
10-YEAR TREASURY NOTE HOLDS FIRM ... The recent jump in bond yields has shown no sign of ending. The daily bars in Chart 1 show the 10-Year Treasury Note Yield trading back above its 200-day average (after dipping back below it last Friday). The TNX is also testing its March peak...
READ MORE
MEMBERS ONLY
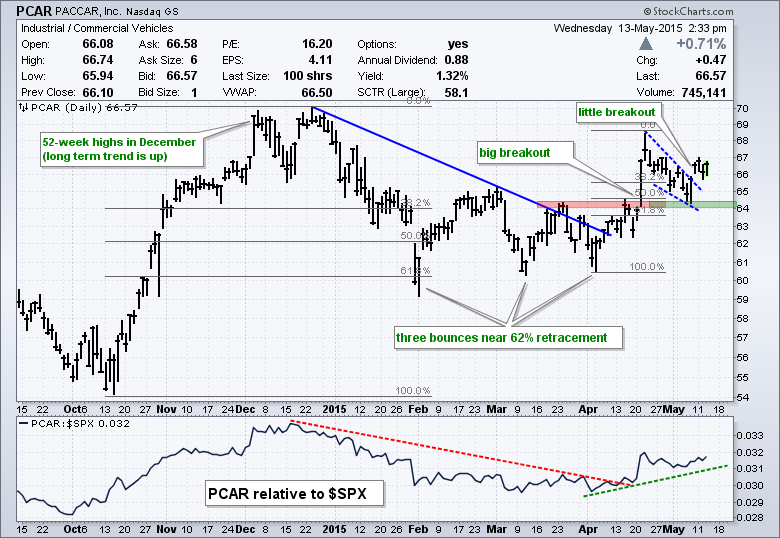
Paccar Holds Big Breakout and Goes for Another
by Arthur Hill,
Chief Technical Strategist, TrendInvestorPro.com
Paccar (PCAR) sports a bullish looking chart with two breakouts in as many months. The stock surged from October to December and then corrected with a decline that retraced 62%. After three bounces off the 62% retracement area, the stock broke out with a surge in mid-April. This breakout ended...
READ MORE
MEMBERS ONLY
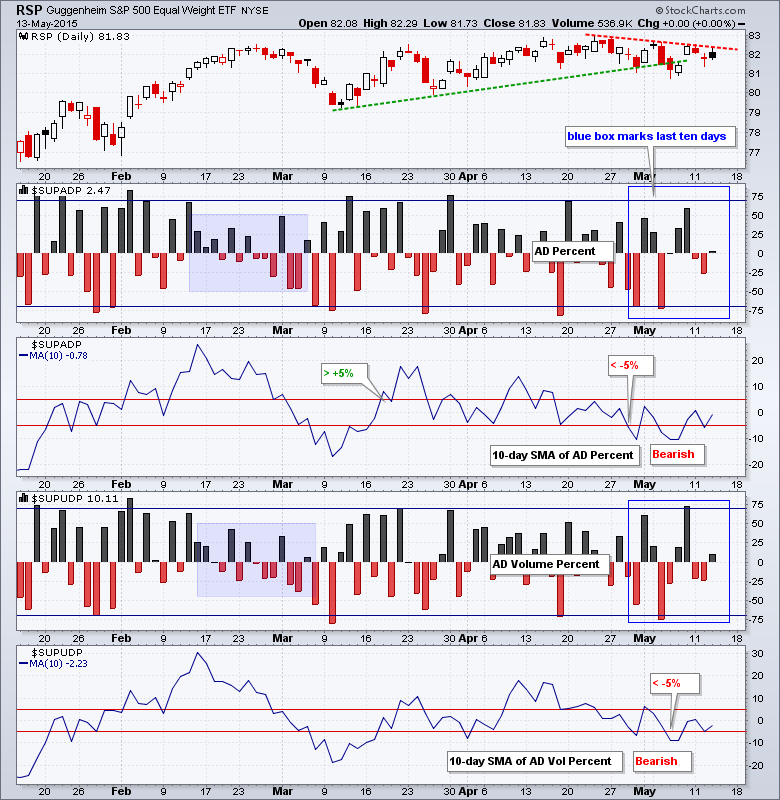
Short-Term Trend Analysis 13-May-15
by Arthur Hill,
Chief Technical Strategist, TrendInvestorPro.com
You got to give the bulls credit on Tuesday. The S&P 500 opened weak with a 20 point decline and move below 2090. This decline wiped out Friday's gain and made the bulls look weak. Instead of continuing lower though, the index immediately firmed and bounced...
READ MORE
MEMBERS ONLY

RISING YIELDS, THE YIELD CURVE, BANKING STOCKS, KEY LEVELS FOR BREADTH, HOUSING-RETAIL-SEMI ETFS CORRECT, BIOTECH ETFS HOLD GAPS, OIL EXTENDS UPTREND, GOLD FLOUNDERS, AIRLINES CORRECT, STOCKS OF INTEREST
by John Murphy,
Chief Technical Analyst, StockCharts.com
THE KEY LINES IN THE SAND... There are certainly some concerns in the stock market right now, but I have yet to get a bearish signal to confirm these concerns. The bond market imploded over the last few weeks, long-term Treasury yields surged, small-caps have been lagging since early April...
READ MORE
