MEMBERS ONLY

Is the Multi-Month Dollar Index Trading Range About to be Resolved?

by Martin Pring,
President, Pring Research
Last June, I wrote an articlewhose title was more or less the same as this one. At the time, the Index was bumping up against the top of a major trading range, and it looked very much as if it was about to experience an upside breakout. My conclusion was...
READ MORE
MEMBERS ONLY
DP Trading Room: NVDA Going Into Earnings - Hold or Sell?

by Erin Swenlin,
Vice President, DecisionPoint.com
It is a big week for earnings and NVIDIA (NVDA) is at the top of the list! Erin gives you her view on whether to hold into earnings based on the technicals of the chart. She also reviewed other stocks reporting on Wednesday: CRM, CRWD, HPQ and OKTA.
Carl talks...
READ MORE
MEMBERS ONLY

PayPal Stock Price Breaks Out: How to Take Advantage of the Price Rise

by Tony Zhang,
Chief Strategist, OptionsPlay
KEY TAKEAWAYS
* PayPal broke out from its two-year consolidation and triggered a new bullish signal
* The next upside target for the bullish trend in PYPL is around the $90 level
* The call vertical options strategy can be used to capitalize on the upside breakout in PYPL
Earlier this year, in...
READ MORE
MEMBERS ONLY
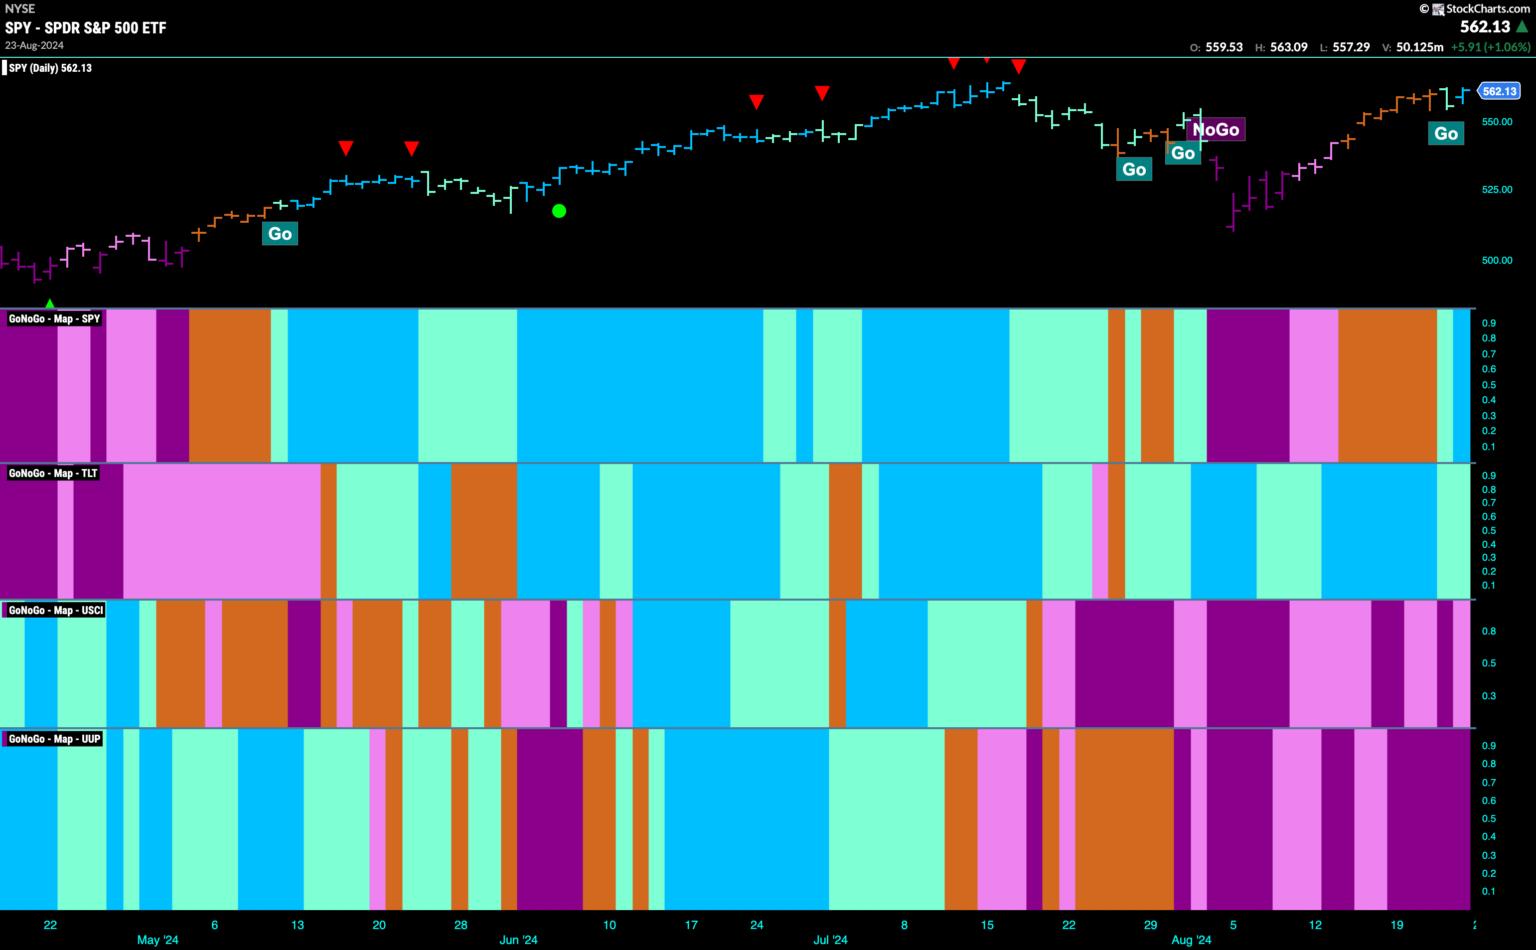
Equities Continue Surge Amid "Healthy" Rotation

by Tyler Wood,
Co-founder, GoNoGo Charts®
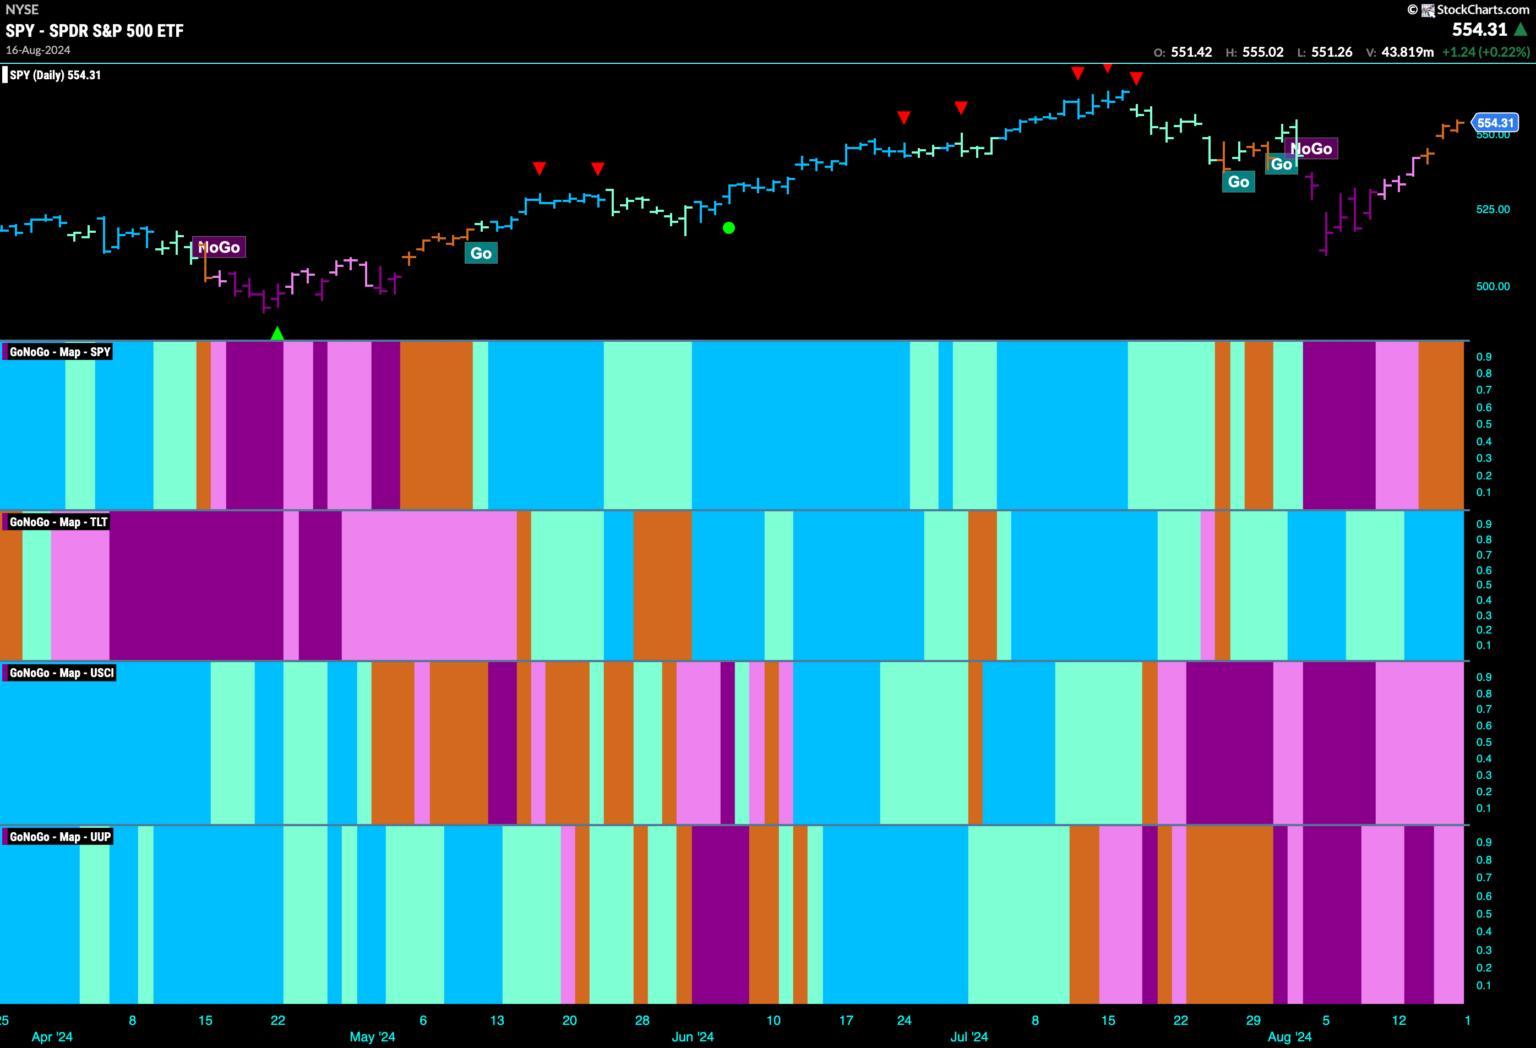
Good morning and welcome to this week's Flight Path. Equities continue their path out of the "NoGo" correction. The "Go" trend has returned for U.S. equities as we see first an aqua and then a blue "Go" bar. This came after...
READ MORE
MEMBERS ONLY

Investing with the Trend: A Review by Dr. Mark Holder

by Greg Morris,
Veteran Technical Analyst, Investor, and Author
The following is a review of my book "Investing with the Trend" by Dr. Mark Holder. You can read the entire contents of the book on this blog, starting with this article.
"History repeats itself." Never was a phrase (oft cited as a Churchill quote) more...
READ MORE
MEMBERS ONLY
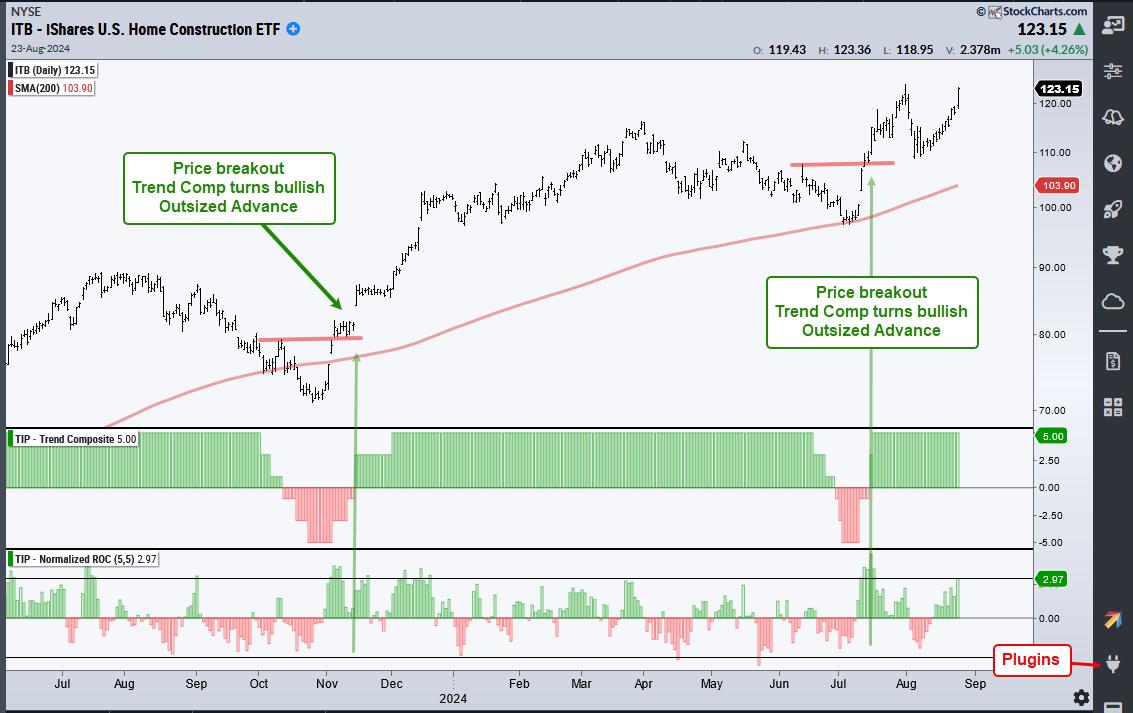
This Housing-Related Stock Just Printed a 5 for the Trend Composite

by Arthur Hill,
Chief Technical Strategist, TrendInvestorPro.com
KEY TAKEAWAYS
* A bullish trio triggers for the Home Construction ETF (ITB) in mid July.
* Outsized advances and resistance breakouts often kick start uptrends.
* The Trend Composite is a lagging indicator that triggers after follow through.
The Home Construction ETF (ITB) is leading the market as it surged to a...
READ MORE
MEMBERS ONLY
Major Market Shift As Week Ends Strong!

by Mary Ellen McGonagle,
President, MEM Investment Research
In this StockCharts TV video, Mary Ellen reviews the broader market's health while highlighting big shifts into newer areas, including banks, retail, and autos. Sharing one of the reasons Tech stocks were weak, she highlights which areas as seeing renewed strength. She also looked at individual stocks that...
READ MORE
MEMBERS ONLY

Top Ten Charts for August: Two Bearish Turnaround Plays

by David Keller,
President and Chief Strategist, Sierra Alpha Research
In this edition of StockCharts TV'sThe Final Bar, Dave completes a five-part series covering ten charts to watch in August 2024, breaking down to stocks in established downtrends. What would we need to see to confirm a rotation from a distribution phase to an accumulation phase, and where...
READ MORE
MEMBERS ONLY
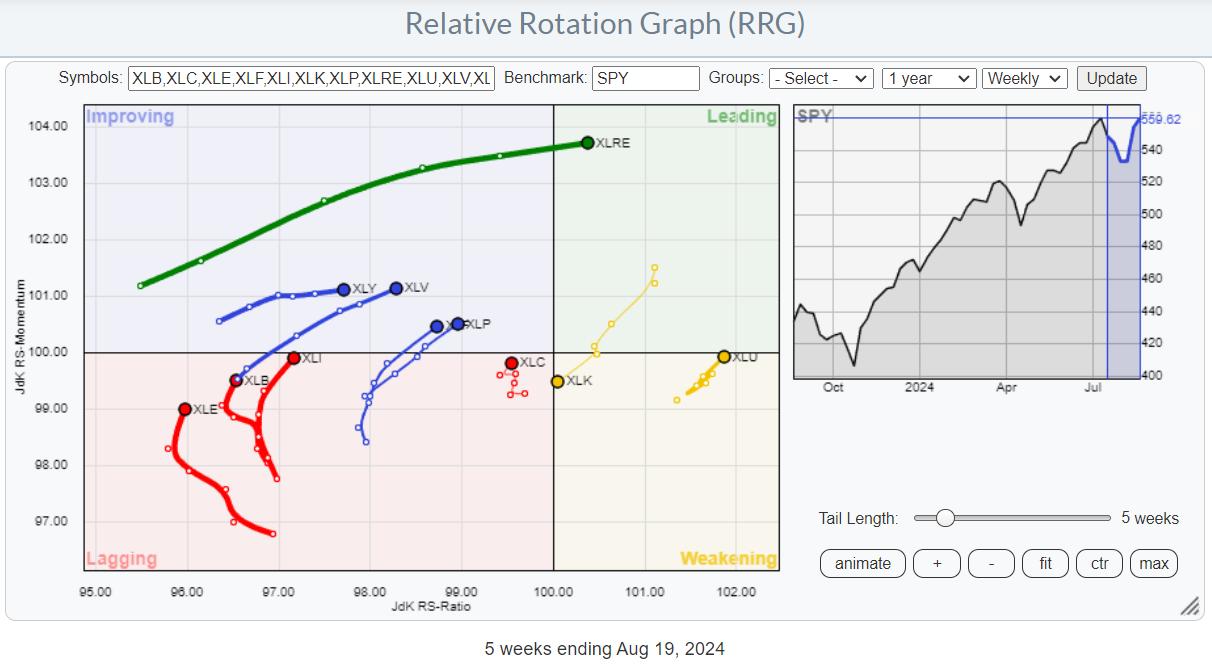
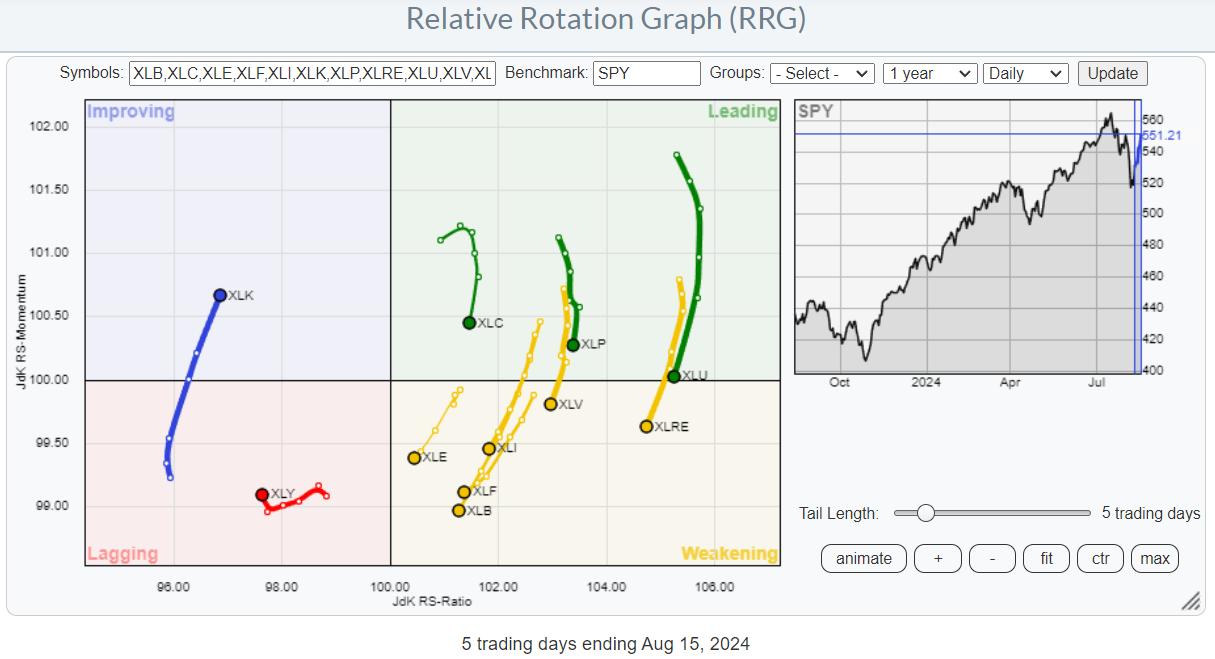
RRG-Velocity Jumping on XLF Tail

by Julius de Kempenaer,
Senior Technical Analyst, StockCharts.com
KEY TAKEAWAYS
* Sector rotation out of technology
* All other sectors are picking up relative strength
* Real-Estate, Utilities, and Financials showing strong rotations
On the weekly Relative Rotation Graph, the rotation still favors almost every sector over Technology. I discussed the opposite rotations between weekly and daily RRGs in last week&...
READ MORE
MEMBERS ONLY

The SCTR Report: Workday Rises on Strong Earnings Results and Rising Technical Strength

by Jayanthi Gopalakrishnan,
Director of Site Content, StockCharts.com
KEY TAKEAWAYS
* Workday, Inc. stock rose higher on strong earnings and guidance
* If Workday stock rises with strong momentum and technical strength, the stock has potential to make for a favorable intermediate-term position trade
* Learn how to set an alert for WDAY stock price to cross a specific threshold
When...
READ MORE
MEMBERS ONLY

Is Peloton Stock the Next Big Turnaround? What You Need to Know Before It's Too Late

by Karl Montevirgen,
The StockCharts Insider
KEY TAKEAWAYS
* Peloton shares jumped over 38% on Thursday following an earnings surprise
* Having fallen 97% from its record peak, Peleton could present investors with a ground-level market opportunity
* With the breakout well underway, here are the actionable levels to watch as Peloton stock surges ahead or dips back down...
READ MORE
MEMBERS ONLY
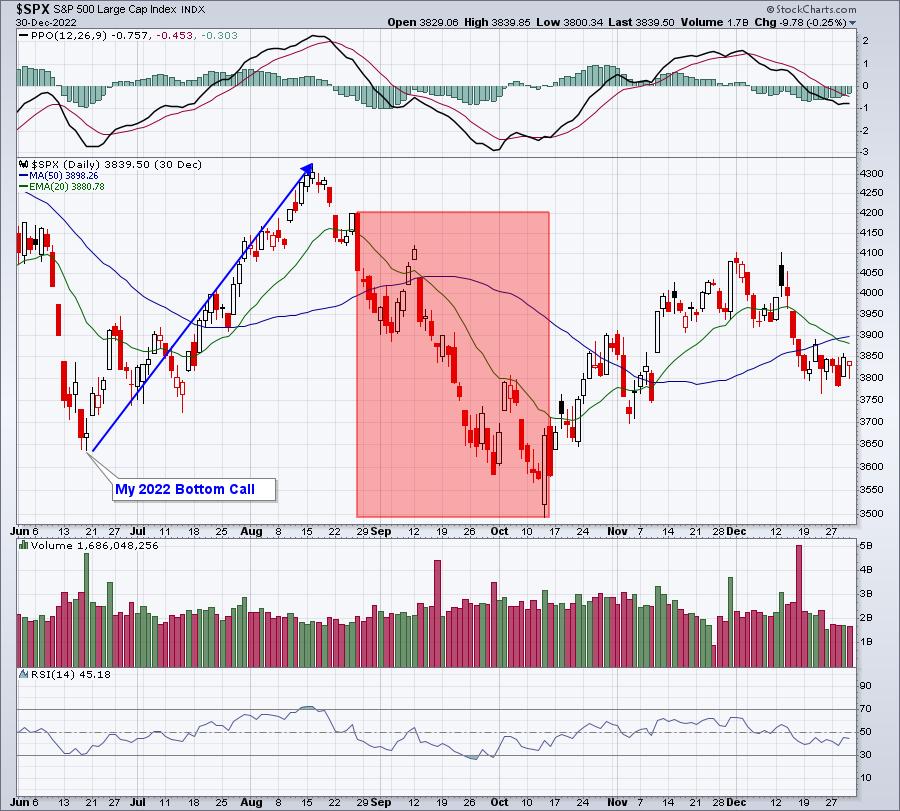
Jackson Hole Jay Doesn't See His Shadow, Worst Market Weather Behind Us

by Tom Bowley,
Chief Market Strategist, EarningsBeats.com
It's been nearly two years since Jackson Hole Jay saw his shadow and we all endured 6 more weeks of harsh market weather. If you need a reminder, August 26, 2022 was the day Fed Chief "Jay" Powell climbed out of his Jackson "Hole"...
READ MORE
MEMBERS ONLY

A New Way of Forecasting Crude Oil | Larry's "Family Gathering" August 22, 2024 Recording

by Larry Williams,
Veteran Investor and Author
What to make of the market as we near the end of August? Larry presents his thoughts in this edition of the Family Gathering video.
In this month's Family Gathering video, Larry begins by presenting a new way of forecasting for Crude Oil. After that, he follows up...
READ MORE
MEMBERS ONLY

Top Ten Charts for August: Best Healthcare Stocks for August 2024
by David Keller,
President and Chief Strategist, Sierra Alpha Research
In this edition of StockCharts TV'sThe Final Bar, Dave continues a five-part series covering ten charts to watch in August 2024, honing in on two Health Care stocks showing renewed signs of strength. He also breaks down how earnings releases relate to price trends, and how investors should...
READ MORE
MEMBERS ONLY
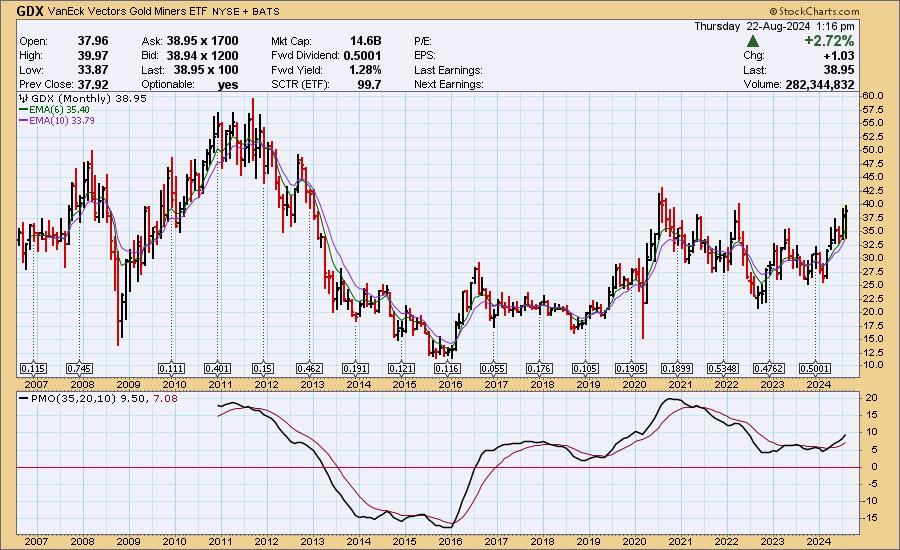
Gold Miners' Performance vs. Gold -- Does It Say Sell Gold?

by Carl Swenlin,
President and Founder, DecisionPoint.com
In Monday's DecisionPoint Trading Room video, we were asked why we cover Gold Miners (GDX) as well as Gold (GLD). There are two reasons:
1. Some people prefer to own the commodity, Gold, and others prefer to own an operating company that benefits from the price of Gold,...
READ MORE
MEMBERS ONLY
Looking for the Next Entry Point in SPY? USE RSI!

by Joe Rabil,
President, Rabil Stock Research
In this exclusive StockCharts TV video, Joe shows how to use RSI in multiple timeframes to identify the next buying opportunity in the SPY. He explains why he thinks this rally is important and uses the ADX on the daily to distinguish between the strength in different indices. Joe also...
READ MORE
MEMBERS ONLY

"Family Gathering" Meeting Today at 2 PM Eastern
Today, Larry Williams will be hosting a "Family Gathering" meeting at 2pm Eastern Daylight Time (11am Pacific). Sign-in in begins 5 minutes prior. The show, which will include both a presentation from Larry and a viewer Q&A session, will be recorded and posted online for those...
READ MORE
MEMBERS ONLY

Top Ten Charts for August: Two Key Defensive Plays
by David Keller,
President and Chief Strategist, Sierra Alpha Research
In this edition of StockCharts TV'sThe Final Bar, Dave continues a five-part series covering ten charts to watch in August 2024, with a focus today on Utilities and Real Estate. Why do low-beta, high-income stocks do so well in bearish market phases, and do we still see signs...
READ MORE
MEMBERS ONLY
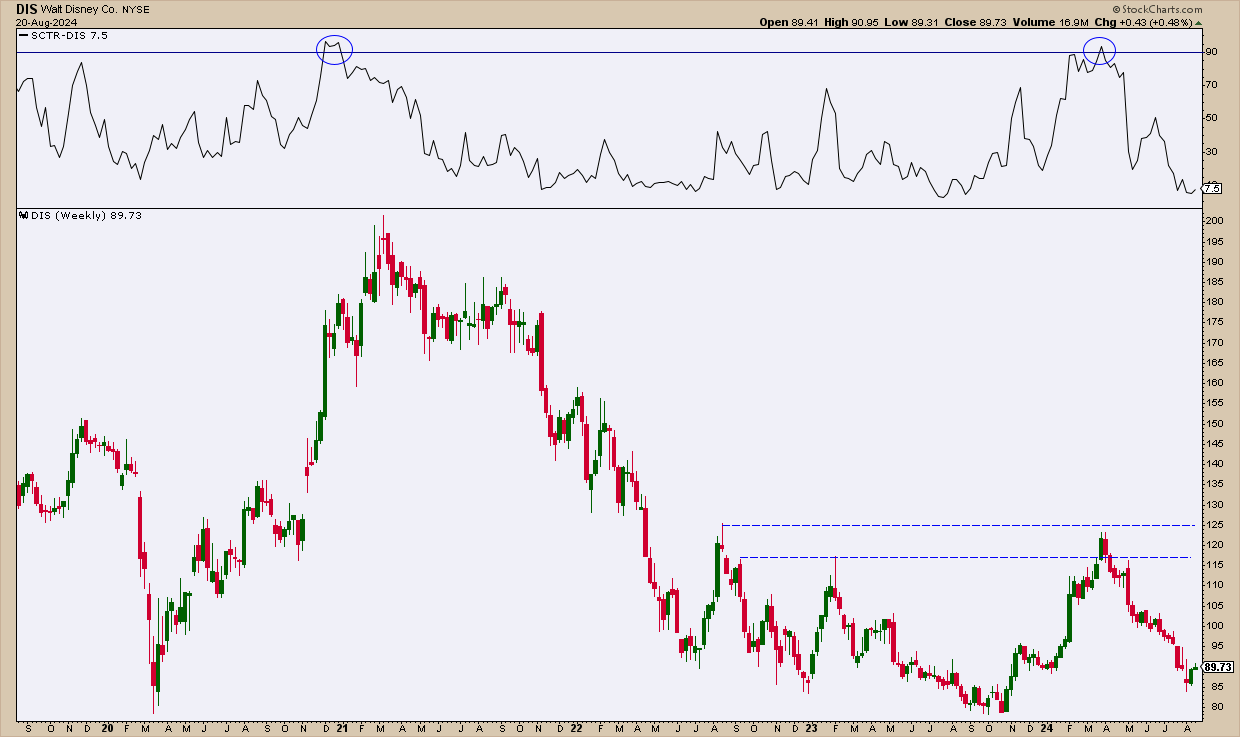
Disney Bust or Bargain? Here are the Levels to Watch!
by Karl Montevirgen,
The StockCharts Insider
The House of Mouse has taken a serious nosedive over the last three years, having gone from a high of about $201 down to $89 and change—a 55% drop that feels like one of its roller coaster rides. Not exactly the thrill Disney shareholders were hoping for.
But Disney...
READ MORE
MEMBERS ONLY
Top Ten Charts for August: Two Tempting Consumer Staples Names
by David Keller,
President and Chief Strategist, Sierra Alpha Research
In this edition of StockCharts TV'sThe Final Bar, Dave continues a five-part series covering ten charts to watch in August 2024, focusing on potential ideas in the Consumer Staples sector. Are dividend-paying defensive names the way to ride out a period of market uncertainty?
This video originally premiered...
READ MORE
MEMBERS ONLY

What Does This Mean for the S&P 500 Rally?
by Julius de Kempenaer,
Senior Technical Analyst, StockCharts.com
In this video from StockCharts TV,Julius looks at the conflicting rotations in both asset classes and equity sectors. The weekly rotations differ significantly from their daily counterparts. What does it mean for the current rally in the S&P 500, and what does it mean for the relationship...
READ MORE
MEMBERS ONLY
Top Ten Charts for August: Two Magnificent 7 Stocks Worth Watching
by David Keller,
President and Chief Strategist, Sierra Alpha Research
In this edition of StockCharts TV'sThe Final Bar, Dave kicks off a five-part series covering ten charts to watch in August 2024, starting with two mega-cap growth stocks testing key resistance levels. Will they power up to new all-time highs into September?
This video originally premiered on August...
READ MORE
MEMBERS ONLY

This Market is On Track for a 45-Year Breakout
by Martin Pring,
President, Pring Research
It's not very often that any market experiences a 10-year breakout, let alone a 45-year one. That, however, is what Chart 1 says is about to materialize for the inflation-adjusted gold price.
Since the chart is based on monthly data, we will not know for sure until the...
READ MORE
MEMBERS ONLY

DP Trading Room: Potential Housing Crash?
by Erin Swenlin,
Vice President, DecisionPoint.com
Today Carl and Erin discuss the potential of a housing crash as more evidence is coming in that many haven't thought of. Private Equity firms have become very involved in the housing market, buying up properties on high amounts of leverage. What happens when it's time...
READ MORE
MEMBERS ONLY
These Groups Just Turned BULLISH!
by Mary Ellen McGonagle,
President, MEM Investment Research
In this StockCharts TV video, Mary Ellen highlights what drove last week's sharp rally in the markets - posting their largest weekly gains for the year! She takes a close look at retail and cybersecurity stocks setting up for gains, and shares some of the best ways to...
READ MORE
MEMBERS ONLY
Strong Week for Equities as Defense Holds its Long Term "Go" Trend

by Alex Cole,
Co-founder, GoNoGo Charts®
by Tyler Wood,
Co-founder, GoNoGo Charts®
Good morning and welcome to this week's Flight Path. Equities continue their path out of the "NoGo" correction. This week we saw amber "Go Fish" bars over the second half of the week. GoNoGo Trend shows that the trend in treasury bond prices saw...
READ MORE
MEMBERS ONLY

Larry's LIVE "Family Gathering" Webinar Airs NEXT WEEK - Thursday, August 22 at 2 PM EDT!
Larry is going LIVE! Don't miss the upcoming "Family Gathering" webinar with Larry Williams, airing live through Zoom on Thursday, August 22 at 2:00pm Eastern Daylight Time.
In this must-see event, Larry will be presenting his current opinions on a broad variety of current market...
READ MORE
MEMBERS ONLY
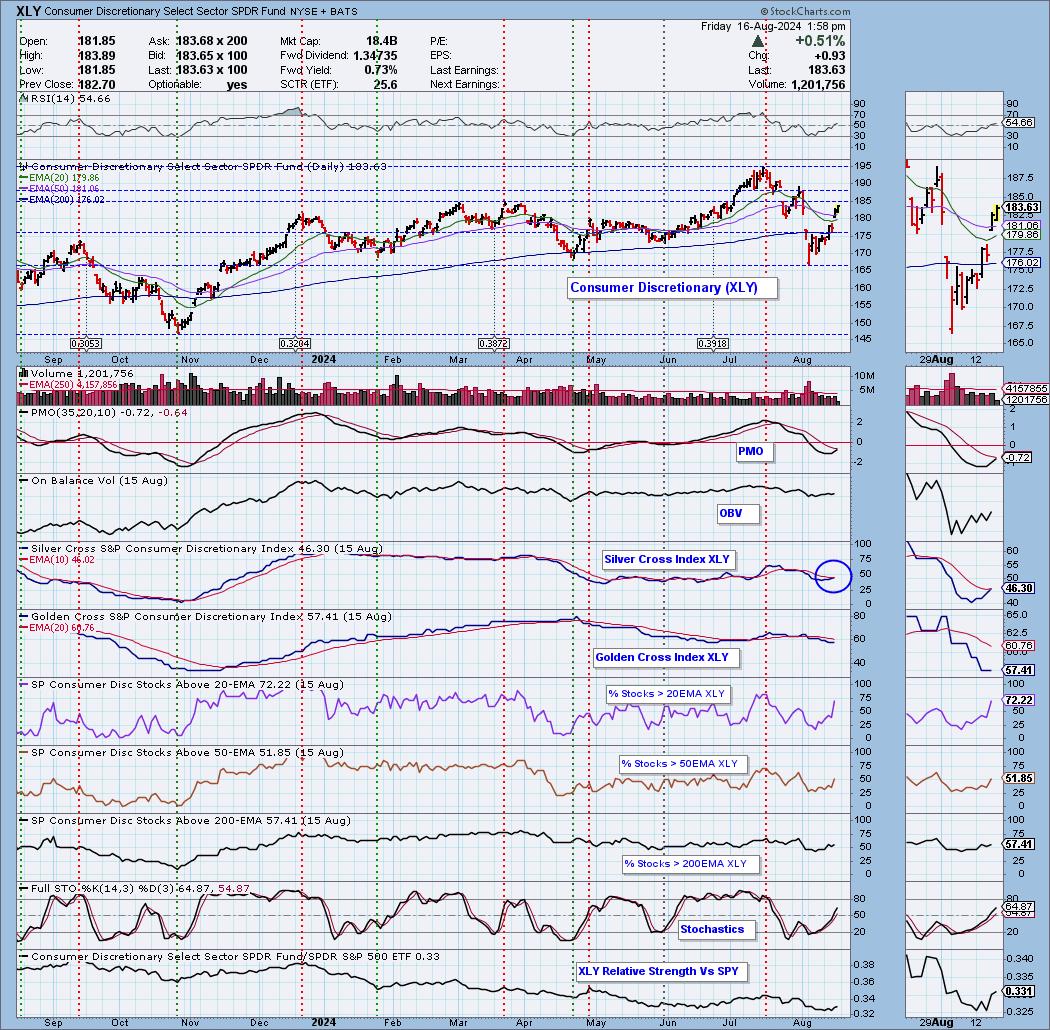
Consumer Discretionary New IT BULLISH Bias
by Erin Swenlin,
Vice President, DecisionPoint.com
The Silver Cross Index measures the number of stocks that have a 20-day EMA above the 50-day EMA, or are on a "Silver Cross" IT Trend Model BUY Signal. This gives us a more complete picture than simply measuring the number of stocks above their key moving averages....
READ MORE
MEMBERS ONLY

Will XRT (Retail) Sink or Soar? Here's What the Charts Say
by Karl Montevirgen,
The StockCharts Insider
KEY TAKEAWAYS
* Retail stocks jumped on Thursday as the retail sales report came out higher than expected
* The SPDR S&P Retail ETF, XRT, gapped higher, but it's stuck in the middle of a wide rectangle formation
* Whether XRT breaks out or breaks down, there are key...
READ MORE
MEMBERS ONLY

The SCTR Report: Dell Is Gaining Strength. Here's Why the Stock Is a Strong Buy
by Jayanthi Gopalakrishnan,
Director of Site Content, StockCharts.com
KEY TAKEAWAYS
* Dell stock is rising from its lows and is worth putting on your radar
* Dell stock is seeing technical improvement but needs more momentum
* There are clear entry and exit points on the daily chart of Dell
When the general market is recovering from a pullback, there can...
READ MORE
MEMBERS ONLY
What Inflation Fear? Strong Retail Sales Fuel Growth
by David Keller,
President and Chief Strategist, Sierra Alpha Research
In this edition of StockCharts TV'sThe Final Bar, Dave recaps another strong up day for growth leadership names, with ULTA and NVDA powering higher after retail sales numbers pushed aside inflation fears. He notes the cautious positioning in the NAAIM Exposure Index, Bitcoin's failed attempt to...
READ MORE
MEMBERS ONLY
Strength Off the Lows, But Concerns Remain
by Julius de Kempenaer,
Senior Technical Analyst, StockCharts.com
KEY TAKEAWAYS
* Rotation to large-cap growth is back
* And so is the narrow foundation/breadth supporting this rally
* Weekly and daily $SPX charts need to get in line
Stronger than Expected
The recent rally out of the August 5th low is definitely stronger than I had anticipated. I was watching...
READ MORE
MEMBERS ONLY

Mag 7 Stocks in the Spotlight as Stock Market Recovers
by Jayanthi Gopalakrishnan,
Director of Site Content, StockCharts.com
KEY TAKEAWAYS
* Cooling inflation data added some optimism in the market although trading volume was low
* The broader stock market indexes are seeing some daylight as they pop their heads out after being underwater
* The Mag 7 stocks are showing strength, which means there could be some buying opportunities soon...
READ MORE
MEMBERS ONLY
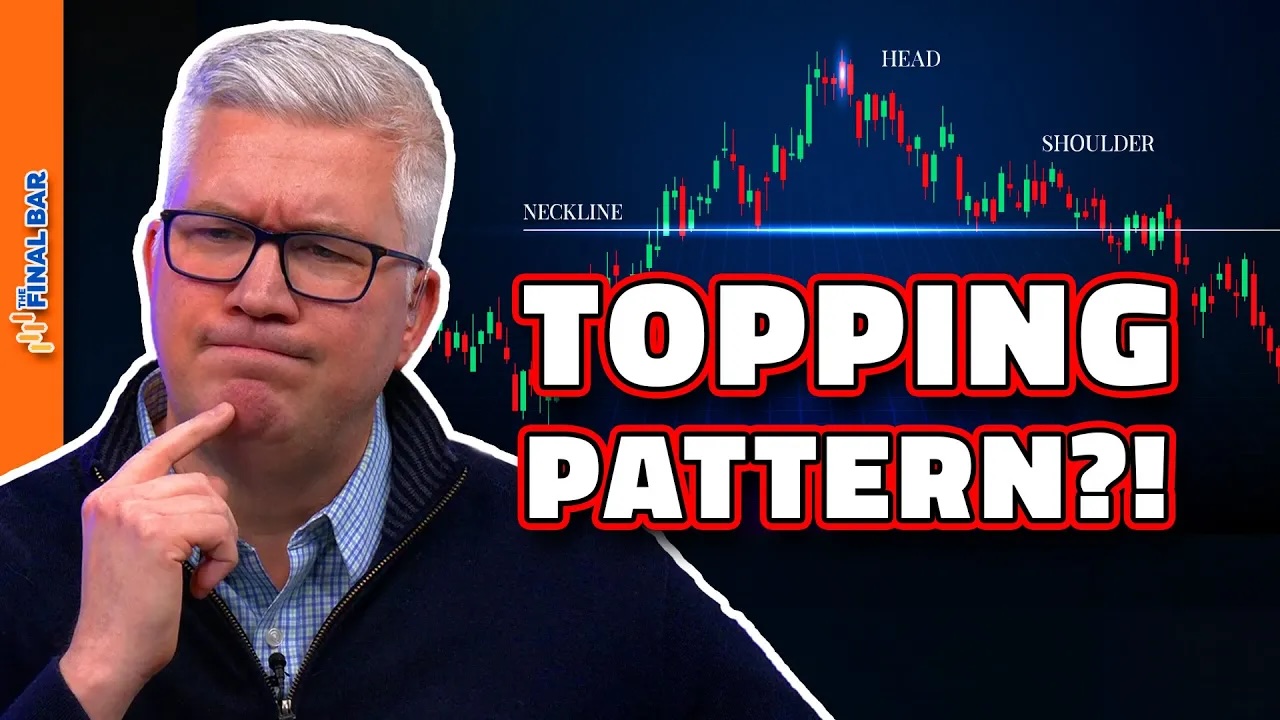
Head and Shoulders Top for Semiconductors?
by David Keller,
President and Chief Strategist, Sierra Alpha Research
In this edition of StockCharts TV'sThe Final Bar, Dave shows how breadth conditions have evolved so far in August, highlights the renewed strength in the financial sector with a focus on insurance stocks, and describes how the action so far in Q3 could be forming a potential head-and-shoulders...
READ MORE
MEMBERS ONLY

How ADX Stage Analysis Can Make You a BETTER Trader!
by Joe Rabil,
President, Rabil Stock Research
In this exclusive StockCharts TV video, Joe shows the four stages a stock or market can be in at any time. He explains each stage and how ADX & Volatility can help define each stage. He then shows what stage the SPY is right and why the bias is still...
READ MORE
MEMBERS ONLY

The Growth Trade is Back!
by David Keller,
President and Chief Strategist, Sierra Alpha Research
In this edition of StockCharts TV'sThe Final Bar, Dave recaps an epic rally in mega cap growth stocks, with NVDA up over 6% and META threatening a new 52-week high. Dave highlights how gold and bond prices continue to rise in the face of stronger stocks, and breaks...
READ MORE
MEMBERS ONLY

SBUX Stock Price Skyrockets: Is Now the Time to Buy?
by Karl Montevirgen,
The StockCharts Insider
KEY TAKEAWAYS
* Starbucks' stock price saw a massive jump and SCTR score on Tuesday
* Much of SBUX's stock price movement is sentiment-driven, so the price spike could be short-lived
* StockCharts SCTR tool identified SBUX as a strong stock, and a more thorough analysis can determine if the...
READ MORE
MEMBERS ONLY

CRITICAL Week Ahead for S&P 500
by Julius de Kempenaer,
Senior Technical Analyst, StockCharts.com
In this video from StockCharts TV,Julius assesses various rotations using Relative Rotation Graphs, starting at asset class level and then moving to sectors. Julius zooms in on the industries of two sectors to get an idea of where pockets of out-performance may exist in the current market. He then...
READ MORE
MEMBERS ONLY

VIX Indicates Fear, But Is It Enough?
by Martin Pring,
President, Pring Research
Last Monday, markets around the world experienced a sharp drop as the unwinding of yen carry trades followed the previous Friday's response to a weak employment report. The speed and sharpness of the equity sell-off got the attention of the general-purpose media and just about everyone else.
From...
READ MORE
MEMBERS ONLY

Why Bonds and Gold Are Outperforming Stocks
by David Keller,
President and Chief Strategist, Sierra Alpha Research
In this edition of StockCharts TV'sThe Final Bar, Dave recaps a choppy Monday for the equity markets, as gold tests new all-time highs and interest rates continue to plummet. He highlights the stock to bond ratio, revisits the classic 60:40 ratio favored by investors, and breaks down...
READ MORE