MEMBERS ONLY

STRONG JOBS REPORT PUSHES INTEREST RATES SHARPLY HIGHER AND TREASURY BONDS LOWER -- HIGHER RATES BOOST BANKS AND BROKERS -- BUT HURT UTILITIES AND GOLD -- S&P 500 ENDS DAY LOWER...

by John Murphy,
Chief Technical Analyst, StockCharts.com
SOUND FAMILIAR? ... The above headline is actually taken from my February 7 Market Message which was written the day after that Friday's strong jobs report. Yesterday's surprisingly strong jobs report, and market reactions, were almost exactly the same as they were a month ago. It just...
READ MORE
MEMBERS ONLY
Stocks are Down, but Not Broken

by Arthur Hill,
Chief Technical Strategist, TrendInvestorPro.com
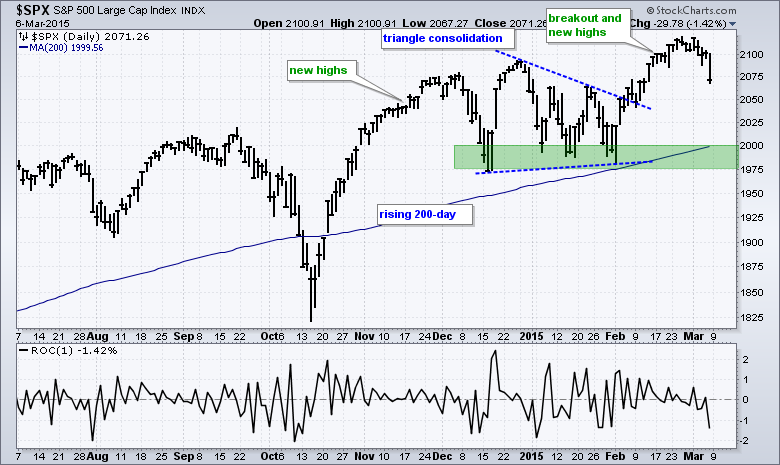
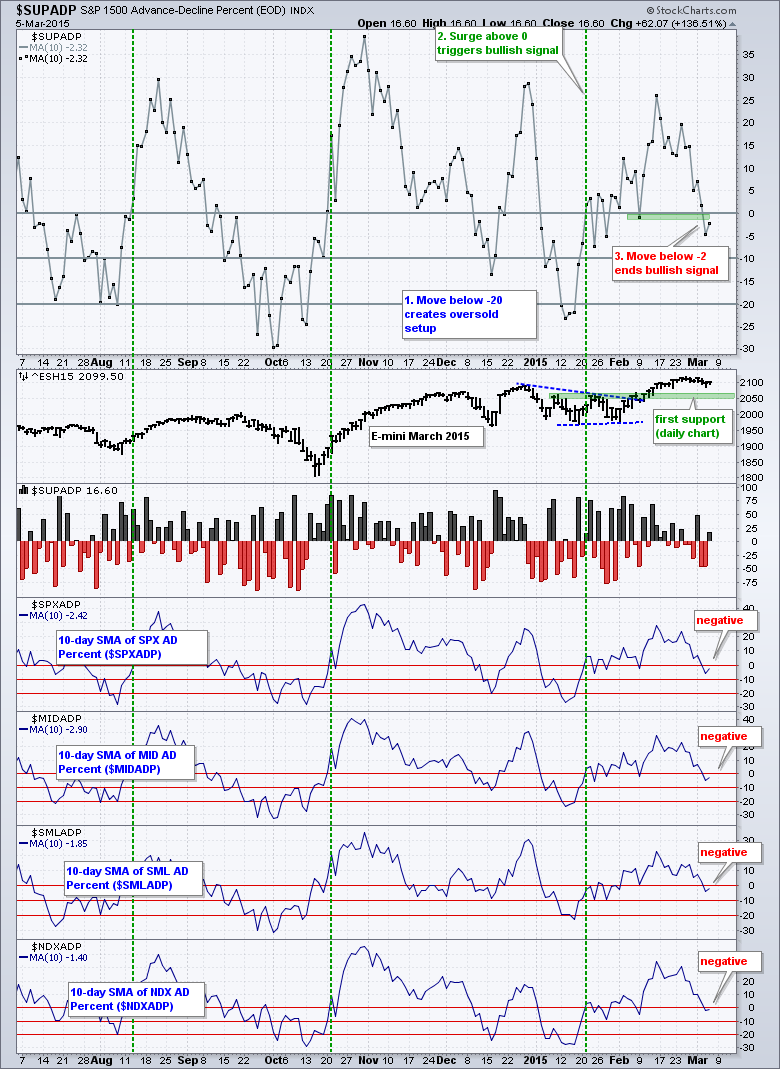
Stocks came under selling pressure in early March and this selling pressure intensified on Friday as the S&P 500 lost 1.42%, which was the biggest one day decline since late January. Even so, it is just one week of selling pressure and not enough to affect the...
READ MORE
MEMBERS ONLY
It's lonely for Europe in the leading quadrant...

by Julius de Kempenaer,
Senior Technical Analyst, StockCharts.com
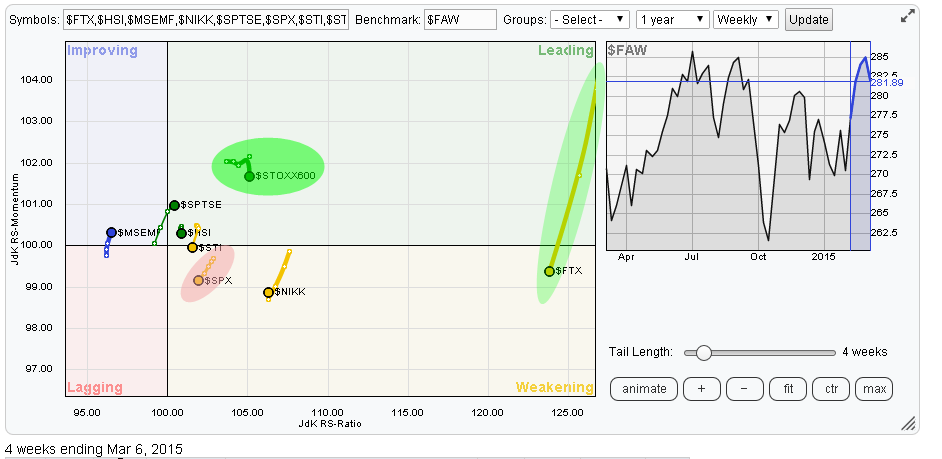
In previous blogs on international (equity) markets I used to plot all markets on one RRG canvas which makes a pretty crowded picture. As most individual ticker symbols are from European markets which are much more fragmented than other global regions I have grouped them together by using one ticker...
READ MORE
MEMBERS ONLY
DecisionPoint Trend Model Generates NEUTRAL Signal on TLT

by Erin Swenlin,
Vice President, DecisionPoint.com
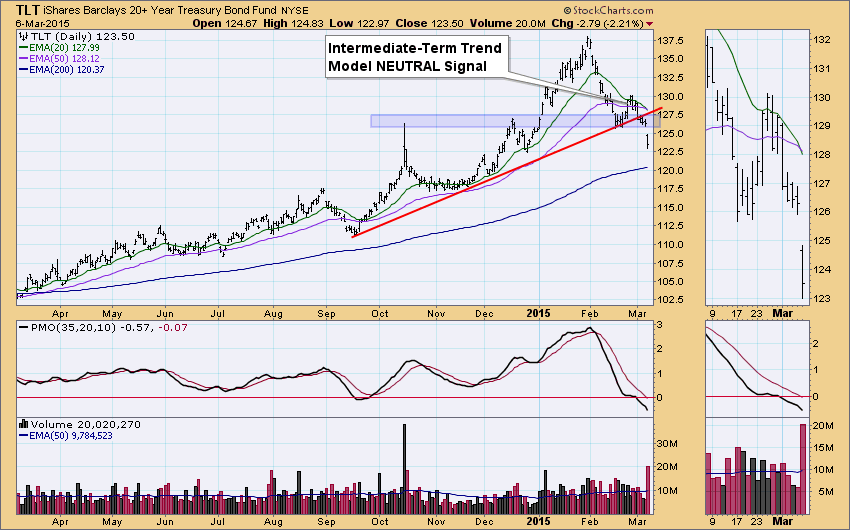
DecisionPoint has been on an Intermediate-Term Trend Model BUY signal since January 17, 2014, so a Neutral signal is a big deal as far as our timing models are concerned. The signal was generated when the 20-EMA crossed below 50-EMA. It was not a SELL signal because the 50-EMA was...
READ MORE
MEMBERS ONLY
Beyond Technical Analysis

by John Hopkins,
President and Co-founder, EarningsBeats.com
This is my first article as a new contributor to ChartWatchers. I'm a founder and president of Invested Central and many of you know my good friend and co founder of Invested Central, Tom Bowley, who recently joined StockCharts.com and has been a contributor to ChartWatchers for...
READ MORE
MEMBERS ONLY

-- A WEAK MARCH FOR STOCKS, XLF STALLS, REGIONAL BANK SPDR CHALLENGES RESISTANCE, THREE REGIONAL BANKS, 10-YR YIELD BREAKS OUT, TLT BREAKS DOWN, ECONOMIC INDICATOR TABLE --
by John Murphy,
Chief Technical Analyst, StockCharts.com
STOCKS WEAKEN, BUT BIGGER UPTRENDS REMAIN... Link for today's video. Stocks weakened over the last few days, but this weakness does not affect the bigger uptrend. First, note that the S&P 500, S&P MidCap 400, S&P Small-Cap 600 and Nasdaq 100 all...
READ MORE
MEMBERS ONLY
Cardtronics (CATM) Fills Earnings Gap

by Tom Bowley,
Chief Market Strategist, EarningsBeats.com
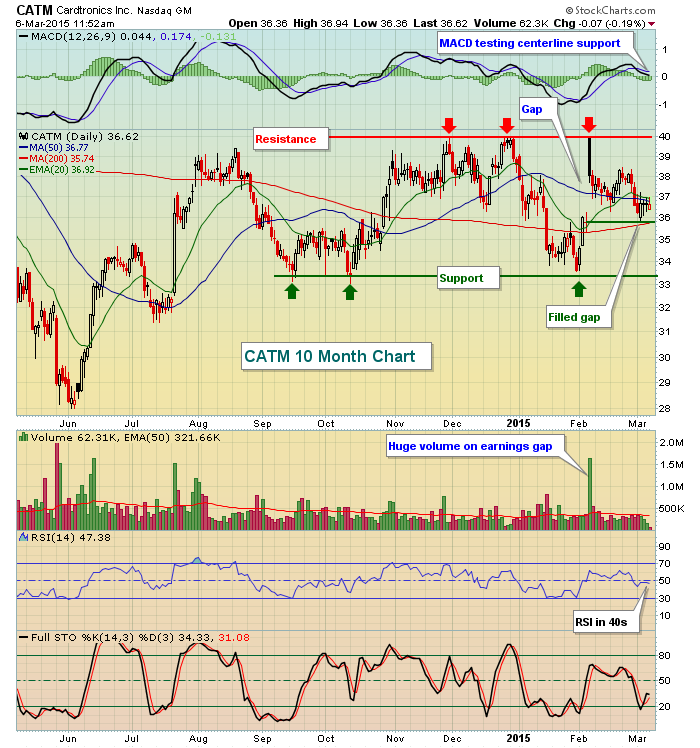
Cardtronics (CATM) reported stellar quarterly results on February 4th after the close, beating Wall Street estimates with respect to both revenues ($283.9 million actual vs. $270.6 million estimate) and EPS ($.64 actual vs. $.57 estimate). At the open on February 5th, CATM gapped higher to 40.00 from...
READ MORE
MEMBERS ONLY
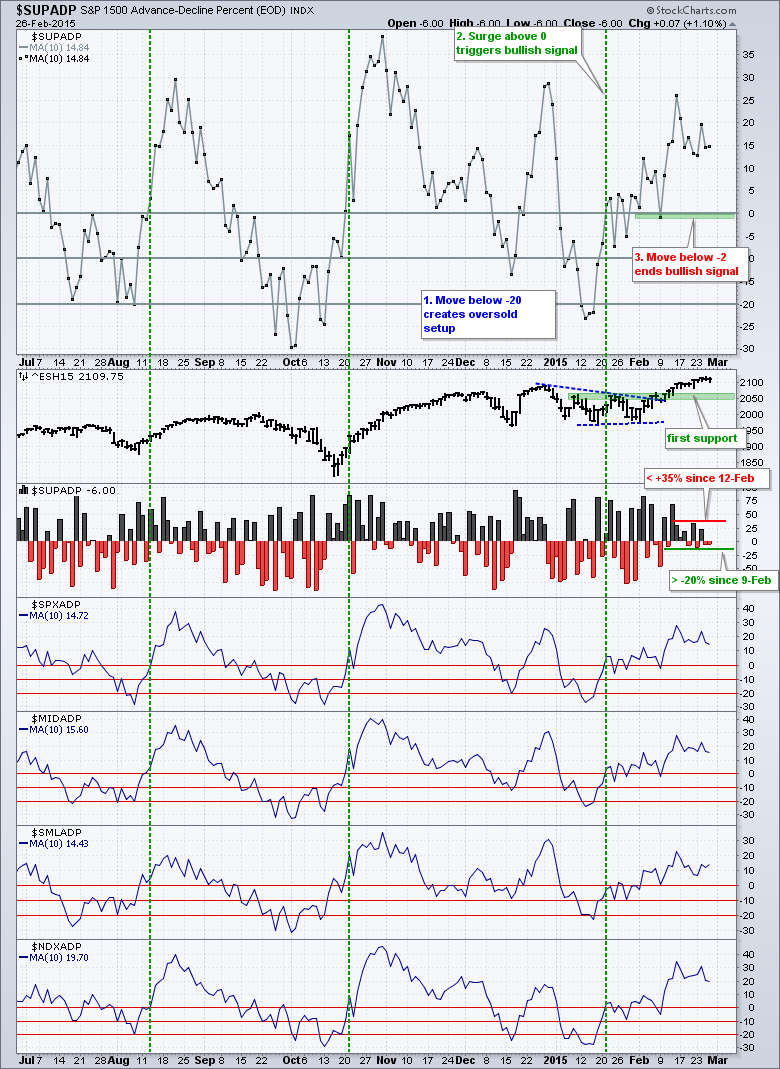
Short-Term Trend, Breadth and Intermarket Analysis
by Arthur Hill,
Chief Technical Strategist, TrendInvestorPro.com
Stocks meandered as traders treaded water ahead of today's employment report. The S&P 500 popped on the open, dropped around lunchtime and recovered in the afternoon. SPY closed with a fractional gain - and a yawn. Banks got a boost from some positive news on the...
READ MORE
MEMBERS ONLY
Lights Out for Energy Sector
by Erin Swenlin,
Vice President, DecisionPoint.com
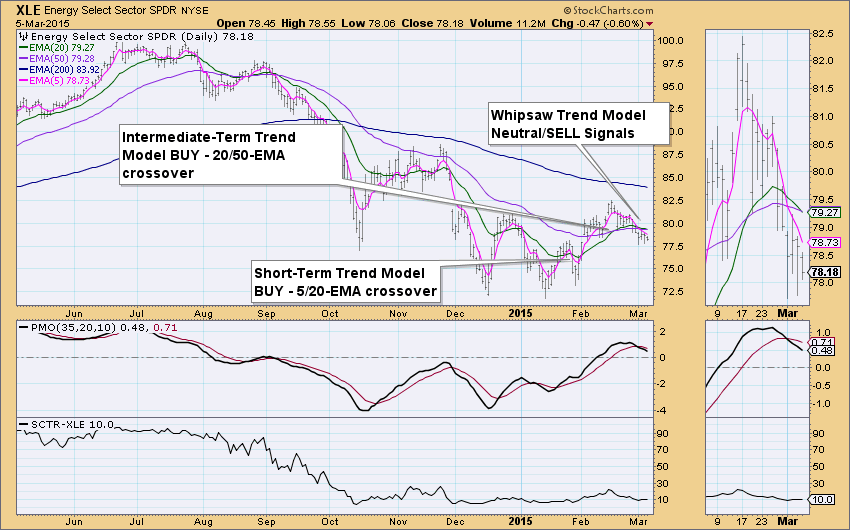
On February 19th I wrote a blog article on the Energy Sector and its possible resurgence as both the Energy SPDR (XLE) and the equal-weighted sister Rydex Energy ETF (RYE) had gone on Intermediate-Term Trend Model BUY signals following Short-Term Trend Model BUY signals. Well, it's lights out...
READ MORE
MEMBERS ONLY

Welcome to Trading Places!
by Tom Bowley,
Chief Market Strategist, EarningsBeats.com
Hello! I'm Tom. Welcome to my new blog - "Trading Places with Tom Bowley."
First off, I'd like to thank you for stopping by. I'm thrilled to be writing blogs and hosting webinars exclusively at StockCharts.com while doing so among the...
READ MORE
MEMBERS ONLY
Schwab Goes for a Break as Volume Indicator Leads
by Arthur Hill,
Chief Technical Strategist, TrendInvestorPro.com
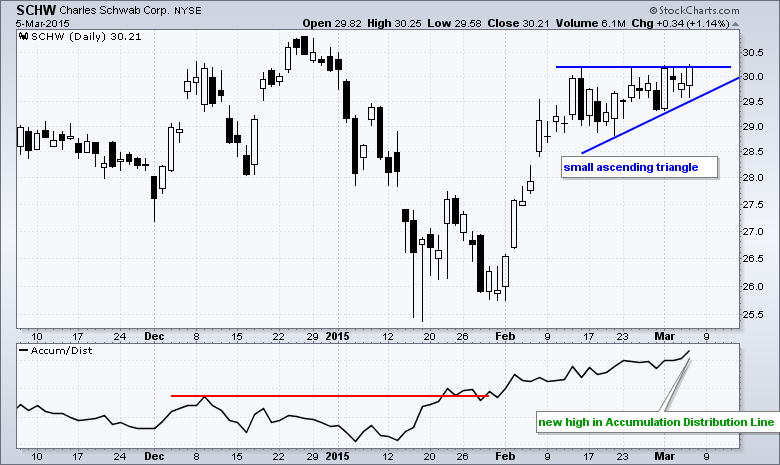
Charles Schwab (SCHW) surged in February and then consolidated the last few weeks with an ascending triangle, which is a bullish continuation pattern. A breakout would signal a continuation of the prior advance and target a move to new highs. The indicator window shows the Accumulation Distribution Line (ACDL) hitting...
READ MORE
MEMBERS ONLY

News Flash: Fundamental Investors Joining Chartist Investors, New Powerful Visualized Dividends

by Gatis Roze,
Author, "Tensile Trading"
I have three objectives for this blog. First, to invite and encourage fundamental investors to embrace the value of visualized dividends which can now be plotted on a chart along with price. Secondly, to nudge all investors to consider allocating a percentage of their portfolios to dividend yielding stocks, both...
READ MORE
MEMBERS ONLY
Short Term Trend Changes for Breadth, SPY and USO
by Arthur Hill,
Chief Technical Strategist, TrendInvestorPro.com
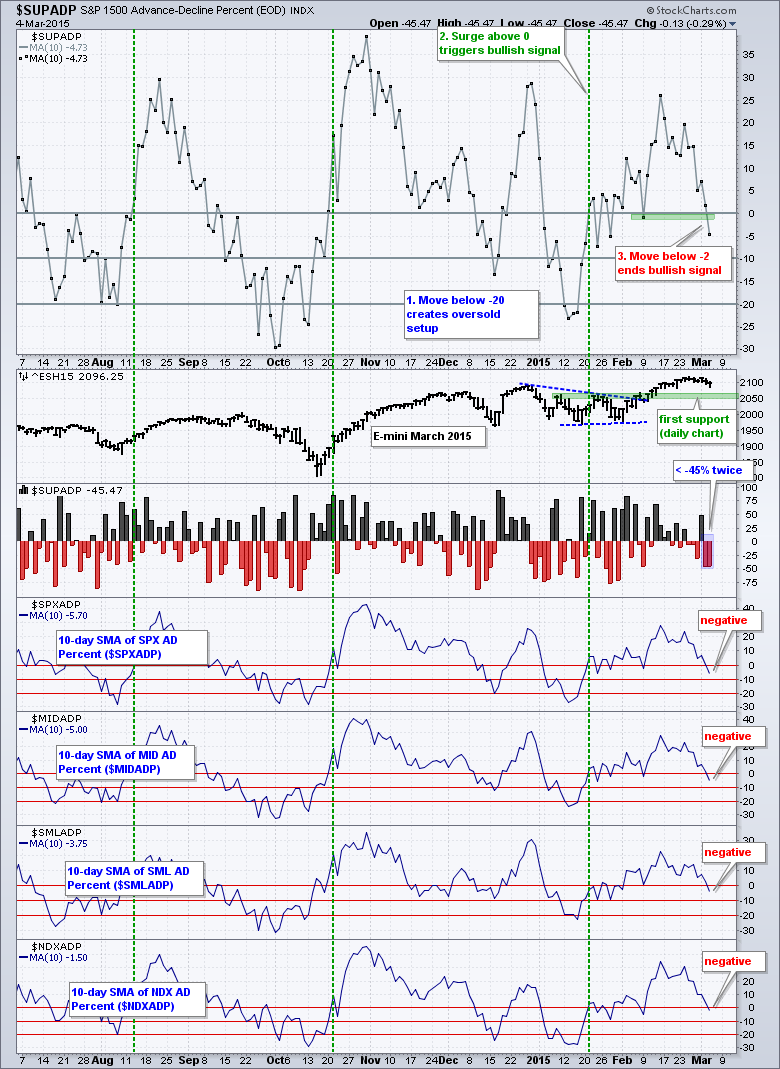
The S&P 500 did a repeat of Tuesday as the index opened weak with a plunge below 2090, quickly firmed and then recovered half the plunge with a bounce to the 2099 area. Selling pressure was pretty much across the board, but the declines were modest. Eight of...
READ MORE
MEMBERS ONLY

Can the Stock Market Hold its Breakout?

by Martin Pring,
President, Pring Research
* NYSE Composite and MSCI World Stock ETF could be in the process of cancelling their recent breakouts.
* Stock/bond ratio at a critical juncture.
* Junk bonds violate up trend line.
* Dollar Index breaks to the upside.
* Gold and gold shares face important technical test.
Equities
Chart 1 suggests that the...
READ MORE
MEMBERS ONLY

STOCK INDEXES ENCOUNTER SELLING -- DOW TRANSPORTS HAVEN'T CONFIRMED INDUSTRIAL HIGH -- FALLING BONDS HAVE HURT UTILITIES -- STOCK/BOND RATIO, HOWEVER, LOOKS OVERBOUGHT -- FTSE WORLD INDEX BACKS OFF FROM RESISTANCE
by John Murphy,
Chief Technical Analyst, StockCharts.com
TRANSPORTS HAVEN'T CONFIRMED DOW HIGH ... U.S. stocks are experiencing some selling today. A pullback from recent highs isn't too surprising considering the fact that some short-term negative divergences have surfaced. First with short-term momentum indicators. Chart 1 shows the Dow Industrials in the red today....
READ MORE
MEMBERS ONLY
Advance Decline Difference Indicators (Chapter 4, Part 1 - CGMBI)

by Greg Morris,
Veteran Technical Analyst, Investor, and Author
We are progressing with the rebuilding of my “The Complete Guide to Market Breadth Indicators” book. We are rebuilding the entire book using StockCharts.com tools and also including the indicators into StockCharts.com’s symbol list. This article will cover the first half of Chapter 4, which deals with...
READ MORE
MEMBERS ONLY
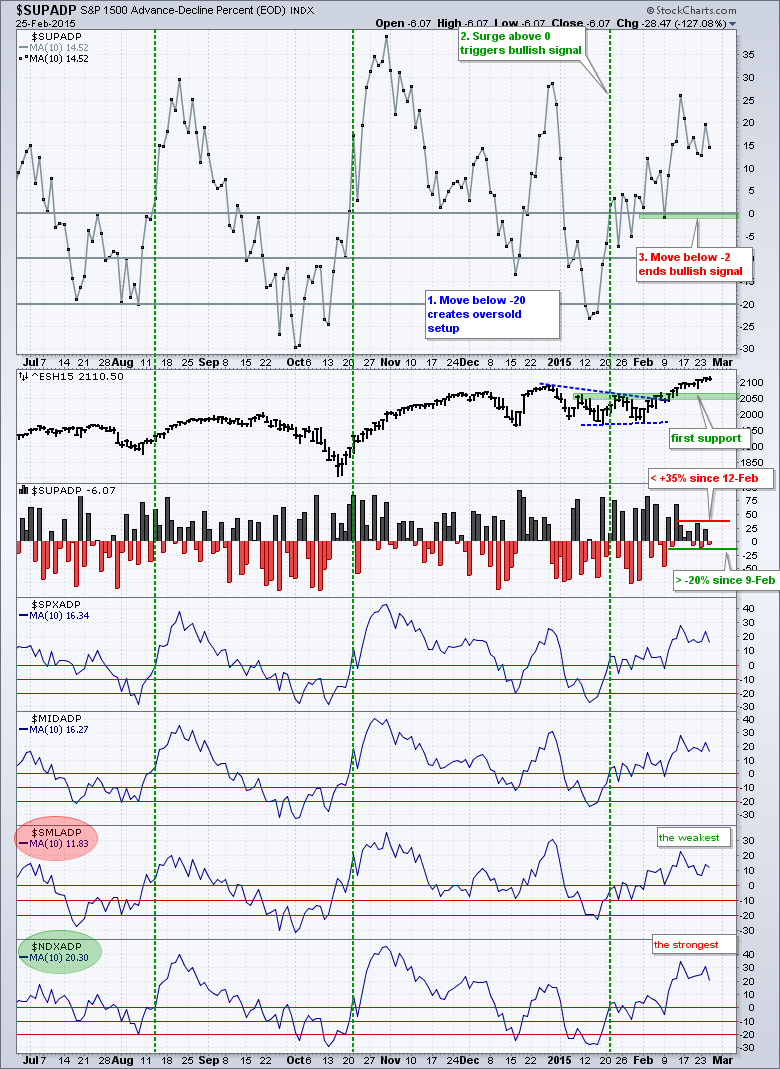
Short-Term Trend, Breadth and Intermarket Analysis
by Arthur Hill,
Chief Technical Strategist, TrendInvestorPro.com
Stocks were hit hard on the open as the S&P 500 fell below 2100 for the first time since February 20th. The index rebounded in the afternoon, but only recovered half of its morning loss. $SPX shows a series of lower lows and lower high the last five...
READ MORE
MEMBERS ONLY
DP Market Update: Short- and Intermediate-Term Indicators Bearish - March 3, 2015
by Erin Swenlin,
Vice President, DecisionPoint.com
Prices corrected through mid-day but managed to pare down some of the losses with a late-day rally. You can see that price has been in a continuation pattern for over a week. Today it appeared horizontal support would not hold, but the prices pulled themselves back up into the consolidation...
READ MORE
MEMBERS ONLY

-- FIRST SUPPORT FOR QQQ, MICROSOFT HITS RESISTANCE, BANDS CONTRACT FOR ORACLE, GOOGLE LEADS, SMALL-CAP BREADTH LAGS, UTILITIES BREADTH TURNS BEARISH, SECTOR SCTR RANKINGS AND CORRELATIONS --
by John Murphy,
Chief Technical Analyst, StockCharts.com
WEBINAR CHARTS AND LINKS... Today's Webinar will start with a live demo showing how to find signals on PerfCharts. I will start with the major stock indices, drill down into the sectors and then look at twenty industry group ETFs in two separate PerfCharts. Even though there are...
READ MORE
MEMBERS ONLY
Looking Good, Feeling Good! Tom Bowley Joins StockCharts.com
Today I'm thrilled to announce the addition of another amazing technical commentator to StockCharts.com - Tom Bowley! Many of you know Tom from his work at InvestEd Central and EarningsBeats.com. In addition, Tom has been a regular contributor to our free ChartWatchers newsletter. Now that he&...
READ MORE
MEMBERS ONLY
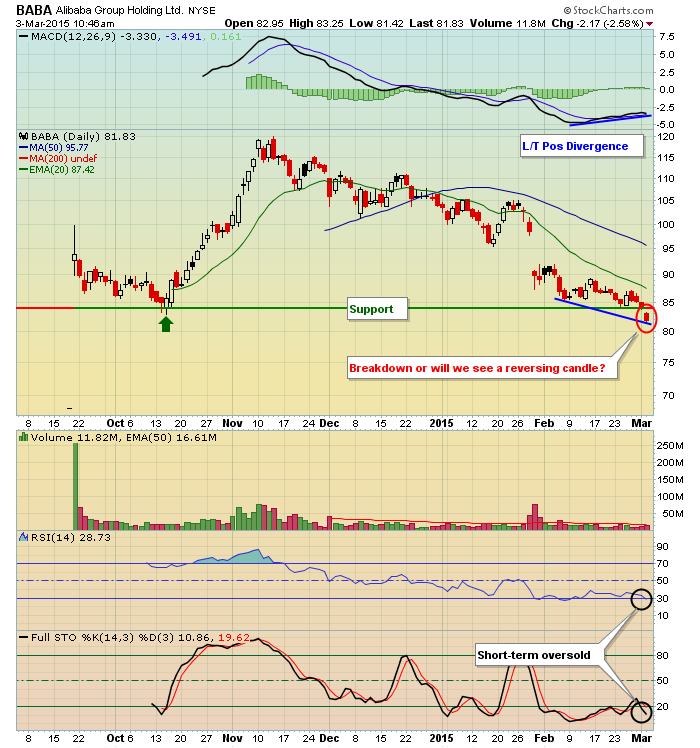
BABA: Breaking Down or Reversing With Positive Divergence?
by Tom Bowley,
Chief Market Strategist, EarningsBeats.com
On Monday, BABA closed at 84.00, its lowest close since its IPO in September. However, that close was very close to support and BABA is currently oversold with its RSI below 30 and its stochastic reading at 11. Note there's a long-term positive divergence that's...
READ MORE
MEMBERS ONLY

Short-Term Trend, Breadth and Intermarket Analysis
by Arthur Hill,
Chief Technical Strategist, TrendInvestorPro.com
Stocks got right back to their bullish ways with the S&P 500 surging above 2117. The index started with a pop above 2113, dipped below 2100 and finished with a late surge to close near the high of the day. The major index ETFs finished higher with modest...
READ MORE
MEMBERS ONLY
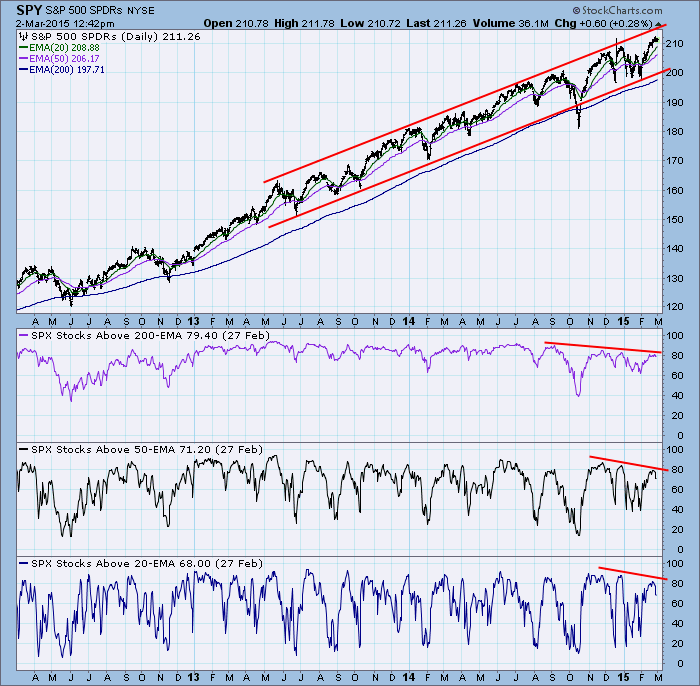
Market Correction Indicated as Fewer Stocks Participate in Current Rally

by Carl Swenlin,
President and Founder, DecisionPoint.com
A good way to gauge internal strength is by examining the percentage of stocks above their moving averages. On the chart below we can see the percentage of S&P 500 stocks above their 20EMA (short-term), 50EMA (medium-term) and 200EMA (long-term). The point of interest I have highlighted is...
READ MORE
MEMBERS ONLY
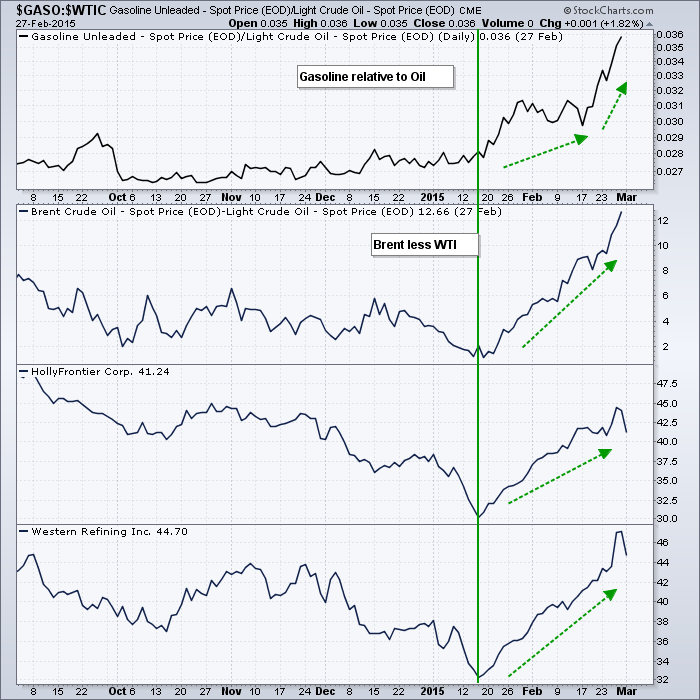
Relative strength in Gasoline and Brent Lifts Two Refiners
by Arthur Hill,
Chief Technical Strategist, TrendInvestorPro.com
WTI Crude ($WTIC) remains relatively subdued, but Brent ($BRENT) and Gasoline ($GASO) have been moving higher the last several weeks. The top chart shows gasoline relative to crude using a ratio plot ($GASO:$WTIC), and the second chart shows the BRENT-WTI spread ($BRENT-$WTIC). Both rose sharply from mid February...
READ MORE
MEMBERS ONLY

-- SEMIS POWER TECH SECTOR, THREE SEMI STOCKS WITH FRESH BREAKOUTS, THROWBACK ZONE FOR QQQ, SMALL-CAPS STRUGGLE, XLU BREAKS DOWN AS YIELDS RISE, TLT GETS COLD FEET --
by John Murphy,
Chief Technical Analyst, StockCharts.com
SEMICONDUCTOR ETF LEADS WITH NEW HIGH ... Link for today's video. Chart 1 shows the Semiconductor SPDR (XSD) surging over 1.5% and hitting yet another new high. The ETF surged in the second half of October and then embarked on a steady advance defined by the Raff Regression...
READ MORE
MEMBERS ONLY
Breadth Stalls, TLT Tests Breakout, GLD Hits Resistance
by Arthur Hill,
Chief Technical Strategist, TrendInvestorPro.com
Stocks actually showed some selling pressure last week, but it was relatively mild and only for a few days. The S&P 500 moved above 2119 on Tuesday afternoon and then worked its way lower the rest of the week. With a close below 2105, the index fell around...
READ MORE
MEMBERS ONLY

-- SMALL-CAPS LEAD, NEW HIGH PARADE, FINANCE LAGS, BAC AND MS, XLE HITS RESISTANCE, XOM, CVX AND SLB, PALLADIUM PERKS UP, GOLD HITS FIB LEVEL, GDX HOLDS BREAK --
by John Murphy,
Chief Technical Analyst, StockCharts.com
LARGE-CAPS AND SMALL-CAPS LEAD FEBRUARY CHARGE... Link for today's video. Even though the stock market is not firing on all cylinders, the majority of cylinders are firing bullish and this is enough to support an uptrend in the broad indices. February may be a short month, but it...
READ MORE
MEMBERS ONLY

Yes - Successful Investors Must Be Like Loving Parents
by Gatis Roze,
Author, "Tensile Trading"
As any accomplished trader will tell you, investors should think of their equity positions as their children. They should act like parents who love all their children equally, nurturing each and every one with care. My trading journal seems to suggest that I’ve been a bad parent at times....
READ MORE
MEMBERS ONLY
IWM Perks Up, Dollar Breaks Out and TLT Tests Breakout
by Arthur Hill,
Chief Technical Strategist, TrendInvestorPro.com
It was a mixed day on Wall Street. Large-cap techs and small-caps led with modest gains. Mid-caps and the equal-weight S&P 500 lagged with modest losses. Energy got slammed again as oil fell. Small-cap performance was impressive because eight of the nine small-caps sector ETFs gained ground. The...
READ MORE
MEMBERS ONLY

PMO + CandleGlance = Smart Money
by Erin Swenlin,
Vice President, DecisionPoint.com
The definition of "Smart Money": Money bet or invested by people with expert knowledge. I won't claim expert knowledge, but the pursuit of getting as close to that as possible is what we are doing here on StockCharts.com. In many of my previous DecisionPoint blog...
READ MORE
MEMBERS ONLY

A Few Things "Other People" Should Know About Technical Analysis
by Greg Morris,
Veteran Technical Analyst, Investor, and Author
As I have traveled the world giving presentations on technical analysis and money management, I have found there are a few things in technical analysis that many do not realize. Of course, I’m referring to all the other technical analysts out there, not you. Many of these are amazingly...
READ MORE
MEMBERS ONLY

FALLING CONSUMER PRICES MAKE FED'S JOB MORE DIFFICULT -- SO DO FALLING COMMODITY PRICES -- A RISING DOLLAR IS PUSHING COMMODITY PRICES LOWER -- WEAK GERMAN YIELD WEIGHS ON TREASURY YIELD -- DOLLAR INDEX IS ON VERGE OF RESUMING ITS UPTREND
by John Murphy,
Chief Technical Analyst, StockCharts.com
FED NOW FOCUSED ON LOW INFLATION ... Today's announcement that consumer prices in the U.S. fell -0.7 in January, the biggest drop since late 2008 (and the first annual decline since 2009), is going to make the Fed's job harder. [The core CPI, excluding food...
READ MORE
MEMBERS ONLY
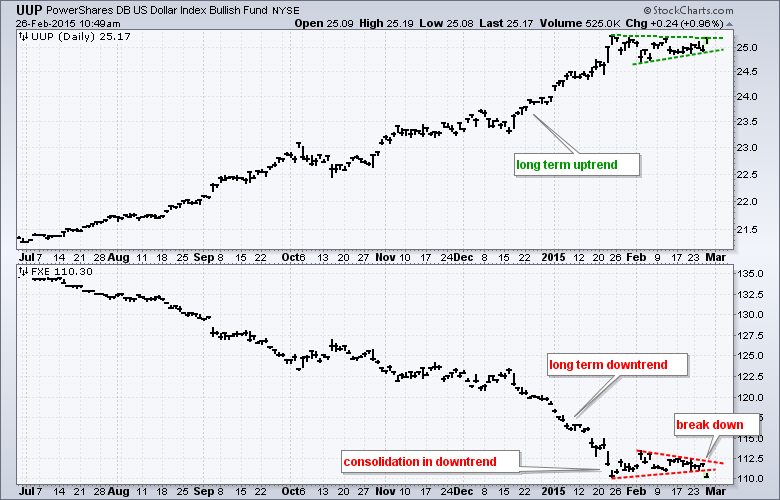
Euro ETF Gets a Continuation Signal
by Arthur Hill,
Chief Technical Strategist, TrendInvestorPro.com
After consolidating for four weeks, the Euro ETF (FXE) is making a bid to continue its downtrend with a break below consolidation support. The bottom chart shows FXE forming a triangle after an extended decline. This is a consolidation within a downtrend and it represents a rest within that trend....
READ MORE
MEMBERS ONLY
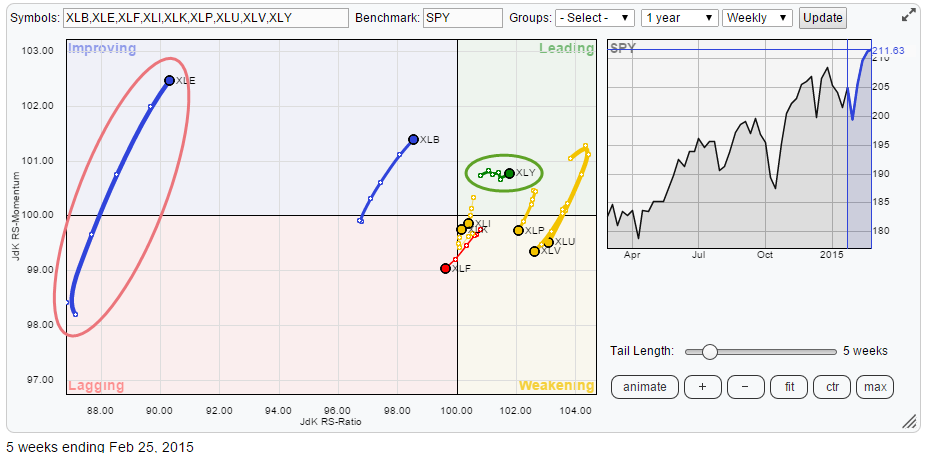
High ENERGY move is suspect
by Julius de Kempenaer,
Senior Technical Analyst, StockCharts.com
On the Relative Rotation Graph showing the sector rotation in the nine S&P sector ETFs there is one that really stands out. But is it good or is it bad?
XLE, the Energy select sector SPDR is showing up in the top-left 'improving' quadrant with a...
READ MORE
MEMBERS ONLY
Breadth Stalls, TLT Holds Breakout and GLD Gets a Bounce
by Arthur Hill,
Chief Technical Strategist, TrendInvestorPro.com
The S&P 500 moved to a new high during the session, but selling pressure hit in the afternoon and the index closed with a fractional loss. Wednesday's price action is the first negative price action we have seen in a while. The inability to hold a...
READ MORE
MEMBERS ONLY
Equity Market Breakout is Broadly Based but Short-term Indicators are Becoming Overstretched
by Martin Pring,
President, Pring Research
* Emerging markets about to experience an important breakout.
* Yield curve continues to flatten.
* Confidence in the bond market faces an important technical test.
US Equities
We have seen some nice breakouts in the last few trading sessions, which have been pretty broadly based as you can see from Chart 1,...
READ MORE
MEMBERS ONLY
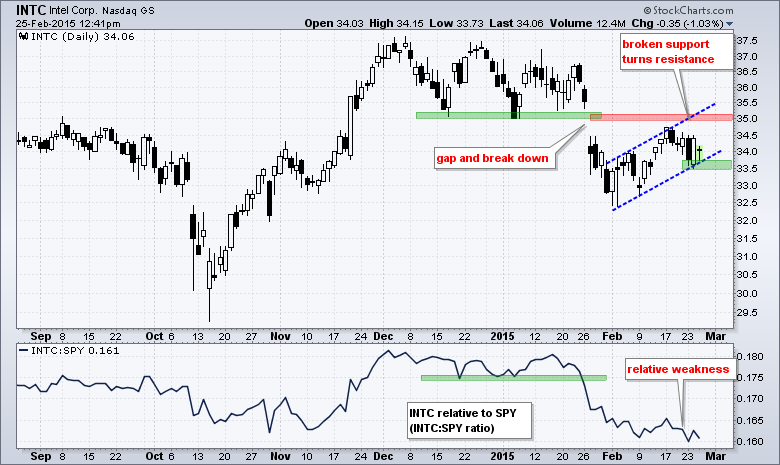
Intel Battles Gap and Relative Performance
by Arthur Hill,
Chief Technical Strategist, TrendInvestorPro.com
Intel is having a tough time this year. In fact, Intel (INTC) has been having a tough time since early December. The stock peaked around 37.5 in early December, formed a series of lower highs into mid January and then gapped down in late January. This gap-plunge broke support...
READ MORE
MEMBERS ONLY
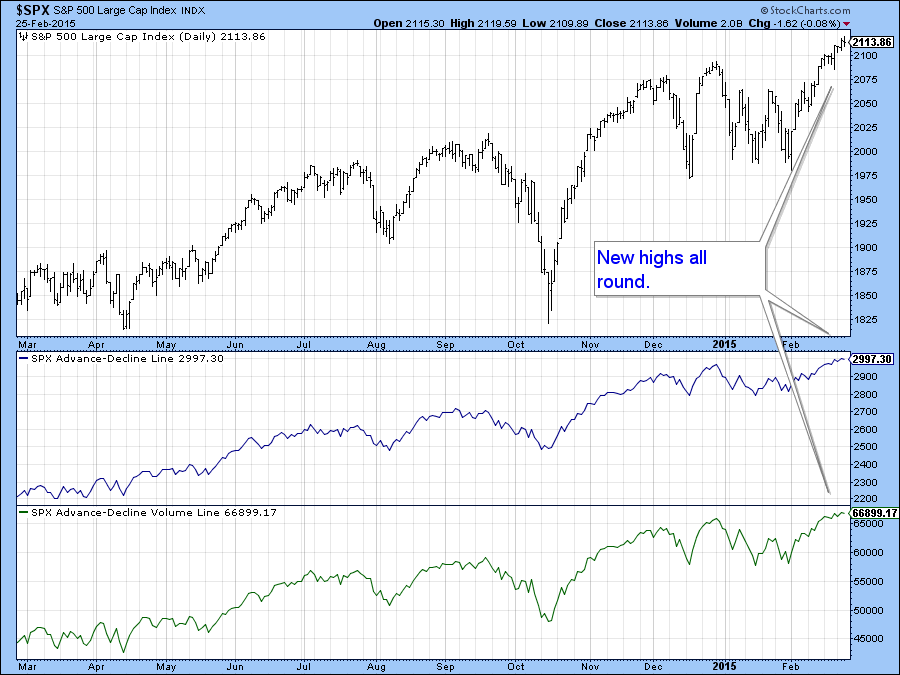
Some Risk Aversion Creeps in as Breadth Underwhelms
by Arthur Hill,
Chief Technical Strategist, TrendInvestorPro.com
Stocks started the day strong as the S&P 500 surged above 2115 in the first ninety minutes. The index pulled back to the 2110 area around midday and rebounded in the afternoon to close above 2115. Once again, the gains for the day were modest across the board....
READ MORE
MEMBERS ONLY
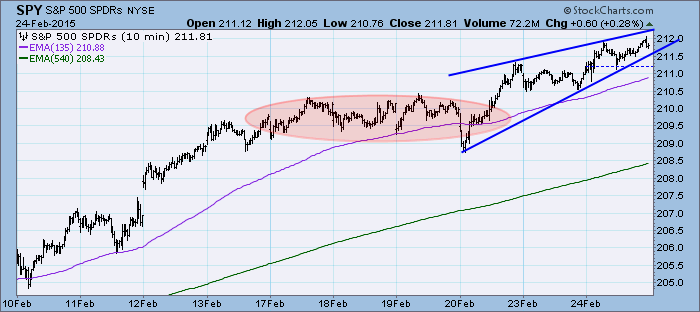
DP Market Update: Price and Volume Disconnect - February 24, 2015
by Erin Swenlin,
Vice President, DecisionPoint.com
The market began trending higher after taking time to digest the this month's rally but it appears that there is downward pressure that has helped form a bearish ascending wedge. Expectation is a breakdown out of the wedge, but this is very short-term and the pattern only tells...
READ MORE
MEMBERS ONLY

-- QQQ BREAKOUT, SPY TARGETS, BREADTH LINES CONFIRM, SECTOR AD LINES, T-YIELDS HIT INFLECTION, TLT SURGES OFF FIB ZONE, YIELD CURVE, UTILITIES FIRM AND REITS BREAK --
by John Murphy,
Chief Technical Analyst, StockCharts.com
WEBINAR CHARTS... Welcome to the Fed edition of the Market Message. No, I am not going to dissect Fed speak and analyze every word from the testimony of Fed Chair Janet Yellen. Instead, I am going to analyze the charts, which contain all available information. Before hitting Treasuries, I will...
READ MORE
