MEMBERS ONLY
Short-Term Trend, Breadth and Intermarket Analysis

by Arthur Hill,
Chief Technical Strategist, TrendInvestorPro.com
Selling pressure extended on Monday, but the selling pressure was rather tame and the losses were modest. A little selling pressure after a big advance last week is normal at this stage. Healthcare, utilities and consumer staples led the sectors lower. Energy stocks gained as oil extended its bounce. The...
READ MORE
MEMBERS ONLY

Finding Investments Using the Short-Term Trend Model and the PMO

by Erin Swenlin,
Vice President, DecisionPoint.com
Finding shorter-term investments especially in a volatile market is very challenging. DecisionPoint has many tools for narrowing in on opportunities. One of our little known tools is the Short-Term Trend Model (ST/TM). Combine that model with our powerful Price Momentum Oscillator (PMO) and you should be able to narrow...
READ MORE
MEMBERS ONLY
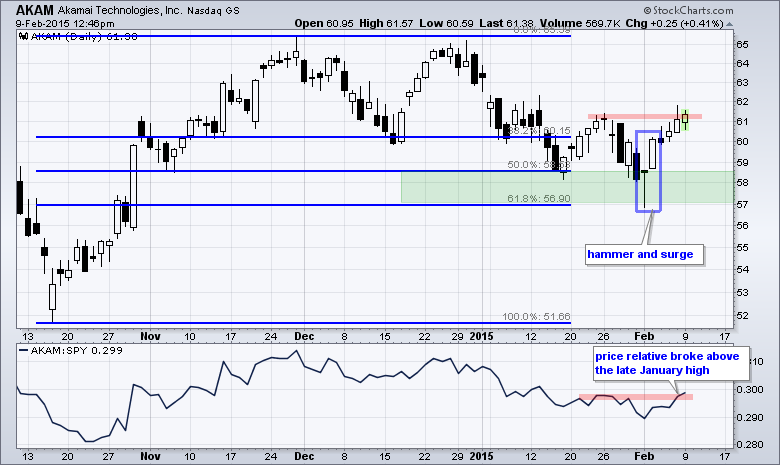
Akamai Forges Candlestick Reversal at Key Retracement
by Arthur Hill,
Chief Technical Strategist, TrendInvestorPro.com
It has been a rough year for Akamai (AKAM), but the decline over the last few months looks like a classic correction. After hitting a new high in late November, the stock retraced 50-62% with a decline to the 57-58 area. This retracement amount is typical for a correction within...
READ MORE
MEMBERS ONLY

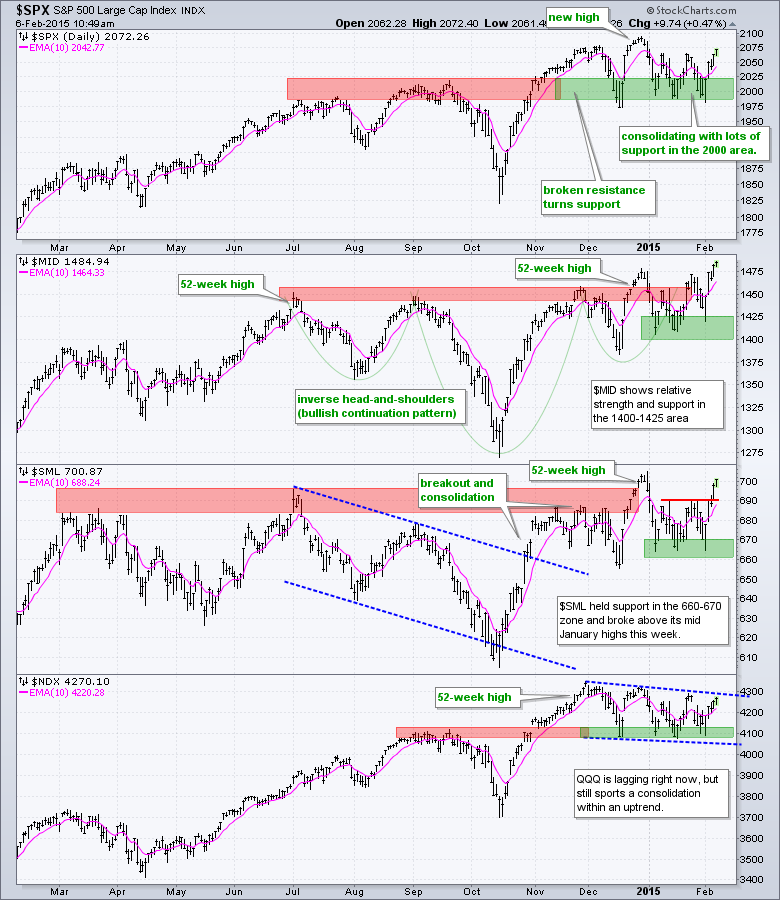
QQQ LAGS WITH LOWER HIGH -- PERFCHART AND RRG FOR MAJOR INDEX ETFS -- MICROSOFT, INTEL AND AMGEN WEIGH -- GOOGLE STALLS AT RESISTANCE -- FACEBOOK NEARS SUPPORT -- AMGEN CORRECTS

by John Murphy,
Chief Technical Analyst, StockCharts.com
QQQ LAGS WITH LOWER HIGH... The Nasdaq 100 ETF (QQQ) is still lagging the broader market with a series of lower highs since December. Chart 1 shows QQQ breaking out in late October and hitting new highs throughout November. Relative weakness started in late December when QQQ failed to take...
READ MORE
MEMBERS ONLY
SPY and IWM Hold Breakouts, QQQ Lags and TLT Breaks
by Arthur Hill,
Chief Technical Strategist, TrendInvestorPro.com
Stocks were hit with some selling pressure on Friday, but the week as a whole showed some pretty positive price action. SPY began its advance on Monday, gapped up on Tuesday and then worked its way higher until Friday morning. Selling pressure hit in the afternoon, but SPY still managed...
READ MORE
MEMBERS ONLY
London Calling, Part Deux
Hello Fellow ChartWatchers!
Friday's jobs report threw things for a bit of a loop as the markets all moved lower on the final day of the week. But all-in-all it was a positive week for every major average with the DJIA leading the way up over 3.8%...
READ MORE
MEMBERS ONLY
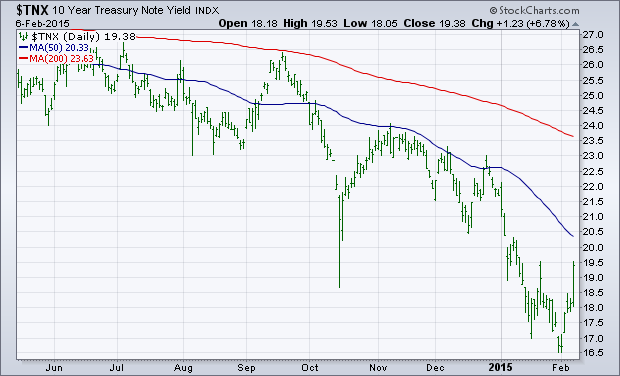
Strong Jobs Report Push Rates Higher
by John Murphy,
Chief Technical Analyst, StockCharts.com
A strong jobs report on Friday pushed interest rates sharply higher all across the yield curve. The daily bars in Chart 1 show the 10-Year Treasury Note yield jumping to the highest close in a month. [Bond prices fell sharply as a result]. Short-term rates jumped even more. Chart 2...
READ MORE
MEMBERS ONLY
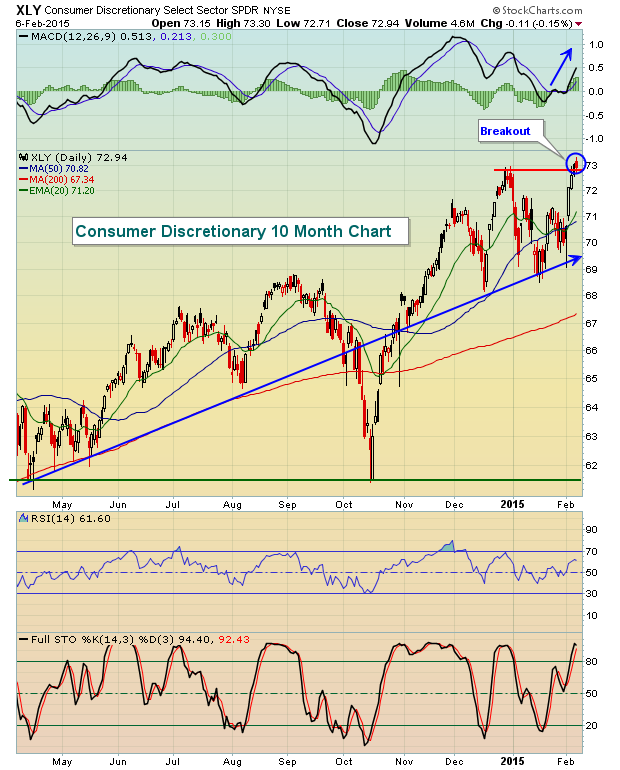
Consumer Discretionary Stocks Fuel Rally

by Tom Bowley,
Chief Market Strategist, EarningsBeats.com
There's been much said and written about rapidly-declining crude oil prices ($WTIC). But one thing makes perfect sense to me. When American consumers save TONS of money when filling up at the pump, they tend to spend it elsewhere. It's simply what we like to do...
READ MORE
MEMBERS ONLY

STRONG JOBS REPORT PUSHES INTEREST RATES SHARPLY HIGHER AND TREASURY BONDS LOWER -- HIGHER RATES BOOST BANKS AND BROKERS -- BUT HURT UTILITIES AND GOLD -- S&P 500 ENDS DAY LOWER WHICH KEEPS IT IN TRADING RANGE
by John Murphy,
Chief Technical Analyst, StockCharts.com
STRONG JOBS REPORT PUSH RATES HIGHER... A strong jobs report on Friday pushed interest rates sharply higher all across the yield curve. The daily bars in Chart 1 show the 10-Year Treasury Note yield jumping to the highest close in a month. [Bond prices fell sharply as a result]. Short-term...
READ MORE
MEMBERS ONLY
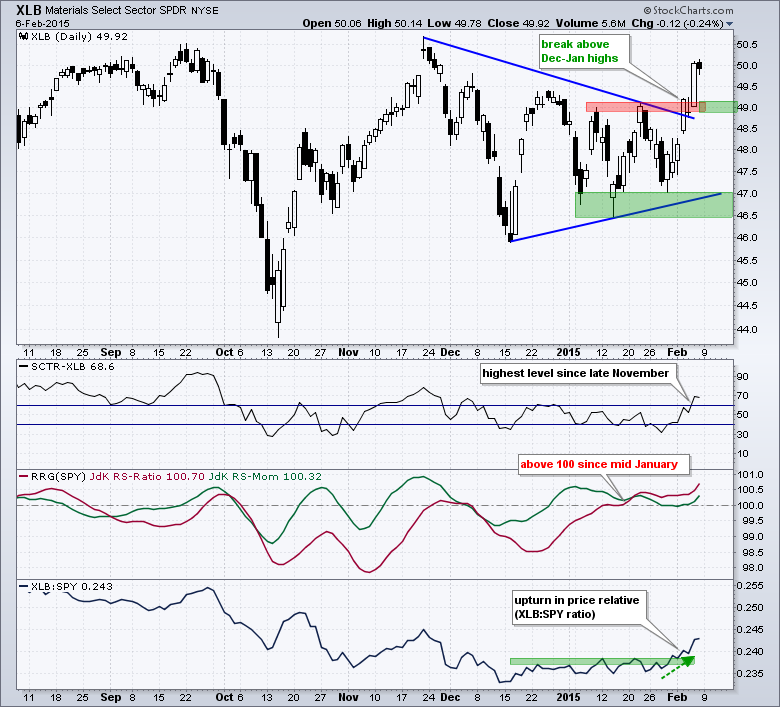
Three Relative Performance Indicators Turn Up for XLB
by Arthur Hill,
Chief Technical Strategist, TrendInvestorPro.com
The Materials SPDR (XLB) sprang to life on the price chart and three relative strength indicators broke out. On the price chart, XLB surged in October-November and then consolidated in December-January with a big triangle. Trading was certainly choppy within the triangle, but the ETF finally made a decisive break...
READ MORE
MEMBERS ONLY
$SPX, $NDX, High Low Indicators, Financial ETFs, Materials ETFs, Semi ETF, Yields, Gold, Economic Indicators
by Arthur Hill,
Chief Technical Strategist, TrendInvestorPro.com
-- S&P 500 and Nasdaq 100 Make Breakout Bids (creating unique charts)
-- High-Low Percent Indicators Stay Bullish
-- Bounce in T-Yields Lifts Financials
-- XSD Shows Chart Strength (finding ETF holdings)
-- Materials Sector Springs to Life
-- Treasury Yields Bounce
-- Dollar Jumps
-- Gold Falls...
READ MORE
MEMBERS ONLY

STRONG JOBS REPORT PUSHES FINANCIALS HIGHER -- BANKS AND BROKERS SURGE -- S&P 500 EXCEEDS JANUARY HIGH -- JUMP IN BOND YIELDS IS CAUSING PROFIT-TAKING IN REITS, UTILITIES, AND GOLD
by John Murphy,
Chief Technical Analyst, StockCharts.com
FINANCIALS LEAD MARKET RALLY ... A strong jobs report is pushing stock prices higher today. Chart 1 shows the Financials Sector SPDR (XLF) jumping above initial resistance at its late January peak (near 24.00) and climbing back over its 50-day line. Banks and brokers are leading the XLF higher. Chart...
READ MORE
MEMBERS ONLY

A Big Trading Mistake I Made So You Won't Have To!

by Gatis Roze,
Author, "Tensile Trading"
I’ve learned that you have to be very thick-skinned to be a trader or a blogger. Many of my blogs are lifted directly from the pages of my old trading journals, and as I write about these former trades, I am very conscious not to sugar-coat it or make...
READ MORE
MEMBERS ONLY
Short-Term Trend, Breadth and Gold Analysis
by Arthur Hill,
Chief Technical Strategist, TrendInvestorPro.com
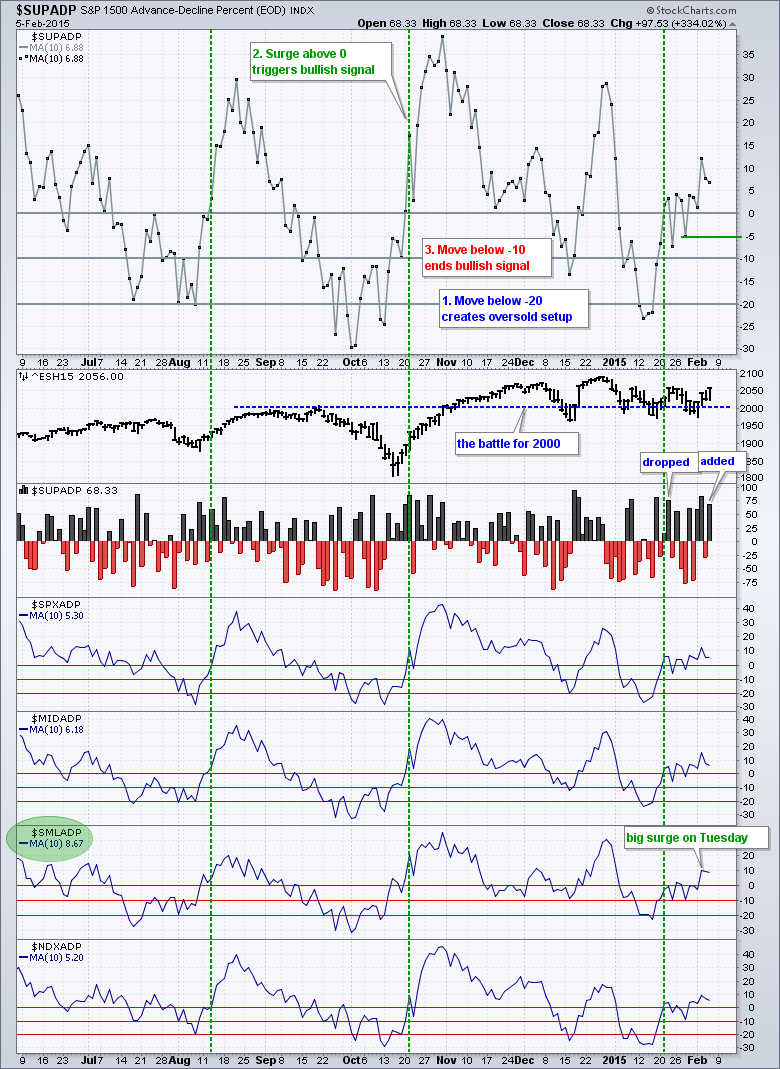
The S&P 500 surged late Monday and early Tuesday with a move from 1990 to 2040, and then worked its way higher. This is positive price action because the index held the surge and continued higher. Small-caps led the way on Thursday with IWM gaining 1.29%. All...
READ MORE
MEMBERS ONLY

HOT: SPY and Financials Equal-Weighted ETF (RYF) - COLD: Gold and the Dollar
by Erin Swenlin,
Vice President, DecisionPoint.com
When I took a look at the DP Alert Daily Report today, I noticed it had some important Price Momentum Oscillator (PMO) crossover BUY/SELL signals that you should know about. Additionally, the DecisionPoint Intermediate-Term Trend Model generated a BUY signal on the equal-weighted Financials ETF (RYF) and that chart...
READ MORE
MEMBERS ONLY
Moment of Truth Approaching for US Equities

by Martin Pring,
President, Pring Research
* Short-term oscillators turn bullish for equities
* EFA breaks above significant down trend line
* Gold short-term momentum reverses to the downside
US Equities
Last week the headline of my Market Roundup article read as follows, ”Will the end-of the month bullish seasonal for equities be enough to avoid a downside domino...
READ MORE
MEMBERS ONLY

DOW BREAKS THROUGH RESISTANCE -- SO DO MIDCAP AND SMALL CAPS -- S&P 500 SHOULD BE NEXT -- ENERGY SHARES ARE AT A LONG-TERM SUPPORT LEVEL AND MAY BE BOTTOMING -- THAT WOULD HINT AT A BOTTOM IN OIL
by John Murphy,
Chief Technical Analyst, StockCharts.com
DOW EXCEEDS CHART RESISTANCE... A 211 point gain in the Dow Industrials was enough to push it through initial chart resistance at its mid-December. That's a strong sign that the sidways price pattern in effect since early December is being resolved on the upside. The Dow isn'...
READ MORE
MEMBERS ONLY
Europe is taking over

by Julius de Kempenaer,
Senior Technical Analyst, StockCharts.com
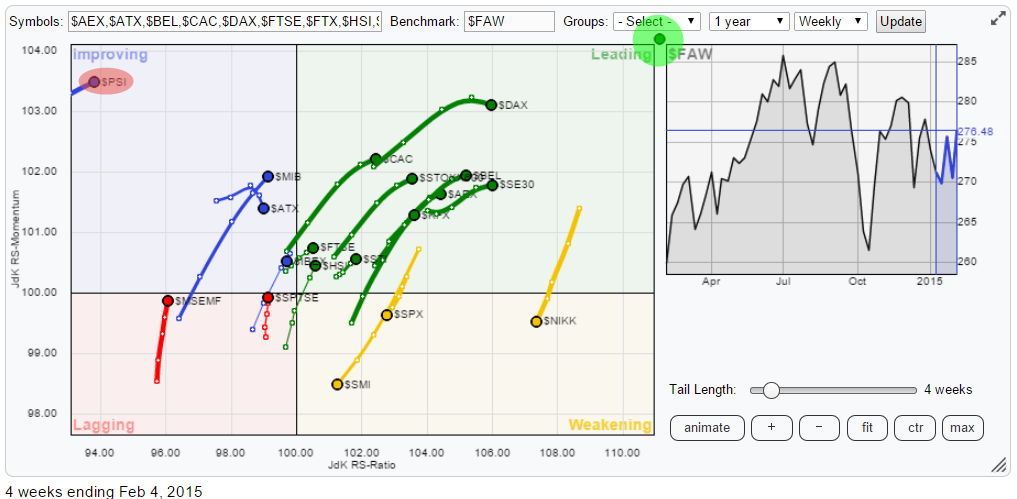
The Relative Rotation Graph below holds a number of international, country and regional, stock indices. In order to get a bit more clarity I have zoomed in to the central area that holds the most observations. You will see one observation "off the grid" in the top right-hand...
READ MORE
MEMBERS ONLY
Keys to the SPY Breakout - GLD Stalls after Break Down
by Arthur Hill,
Chief Technical Strategist, TrendInvestorPro.com
After a surge from 1985 to 2050, trading in the S&P 500 turned choppy on Wednesday with a rather tight range. There was, however, some late selling pressure as the index dropped from 2053 to 2040 in the final 30 minutes. Must have been some news event hitting...
READ MORE
MEMBERS ONLY

FALLING OIL BOOSTS CONSUMER DISCRETIONARY STOCKS -- LEADERS INCLUDE DISNEY, WHIRLPOOL, AND KOHLS -- AUTOS AND HOMEBUILDES ALSO CLIMB -- GENERAL ELECTRIC AND FORD HAVE GOOD DAY -- RYLAND AND TOLL BROTHERS TURN UP
by John Murphy,
Chief Technical Analyst, StockCharts.com
CONSUMER DISCRETIONARY SPDR SHOWS RELATIVE STRENGTH... Consumer discretionary stocks have been among the biggest beneficiaries of falling oil prices. Today is no exception. With crude falling 8% during the day, consumer discretionary stocks are among the day's biggest gainers. The daily bars in Chart 1 show the Consumer...
READ MORE
MEMBERS ONLY
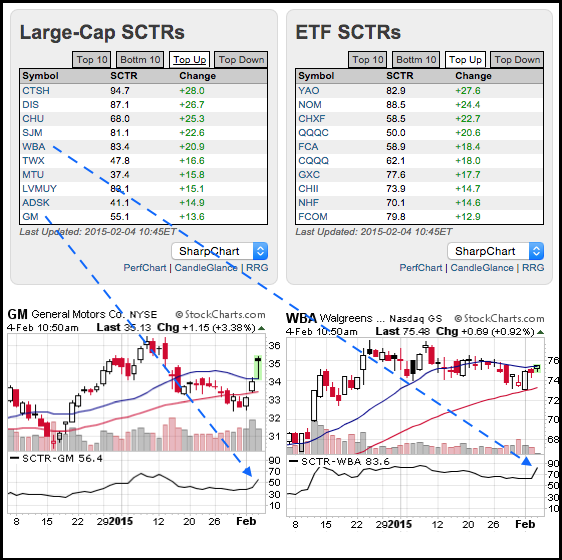
Technical Ranks Surge for Walgreen and GM
by Arthur Hill,
Chief Technical Strategist, TrendInvestorPro.com
The image below shows a screen shot from the home page with SCTR tables for large-caps and ETFs. The "top up" tab was selected to focus on the biggest gainers. Notice that the StockCharts Technical Rank (SCTR) for GM moved above 50 and the SCTR for Walgreens moved...
READ MORE
MEMBERS ONLY
SPY and QQQ Lead with Gaps and Breakouts
by Arthur Hill,
Chief Technical Strategist, TrendInvestorPro.com
Stocks started strong with a surge on the open, traded flat for a few hours and then moved higher the entire afternoon. The ability to open strong and finish strong is positive and the S&P 500 finished strong the last two days. Energy led the way as oil...
READ MORE
MEMBERS ONLY
DP Market Update: Trading Range Holding On - February 3, 2015
by Erin Swenlin,
Vice President, DecisionPoint.com
** Don't forget to sign up for the DecisionPoint LIVE! webinar! Tweet your suggestions for the reader's request chart review @_DecisionPoint **
The market rallied above the previous three days' tops. A weaker dollar and stronger oil prices fueled the rally.
The purpose of the DecisionPoint Market...
READ MORE
MEMBERS ONLY

WEBINAR CHARTS AND LINK -- MARKET REMAINS STUCK, BUT NOT BROKEN -- RISK INDICATOR OVERVIEW -- SECTOR SPDRS AND THEIR SEVEN BREADTH INDICATORS -- 6 ETF CHARTS -- 9 STOCK CHARTS -- Q&A: CREATING SHADED BOXES, USING THE RAFF CHANNEL AND MORE
by John Murphy,
Chief Technical Analyst, StockCharts.com
WEBINAR CHARTS... The major index ETFs and key sector SDPDRs remain stuck in trading ranges, but we are seeing some promising signs over the last two days. As the charts in today's Webinar show, the Consumer Discretionary SPDR (XLY), Industrials SPDR (XLI) and Technology SPDR (XLK) all surged...
READ MORE
MEMBERS ONLY
SPY, QQQ and IWM Bounce off Support
by Arthur Hill,
Chief Technical Strategist, TrendInvestorPro.com
Stocks started the day weak with selling pressure on the open, but quickly firmed around 10AM and the S&P 500 surged above 2000 before lunch. After an early afternoon swoon, buyers stepped in again and pushed this key benchmark back above 2000. In fact, the index closed above...
READ MORE
MEMBERS ONLY
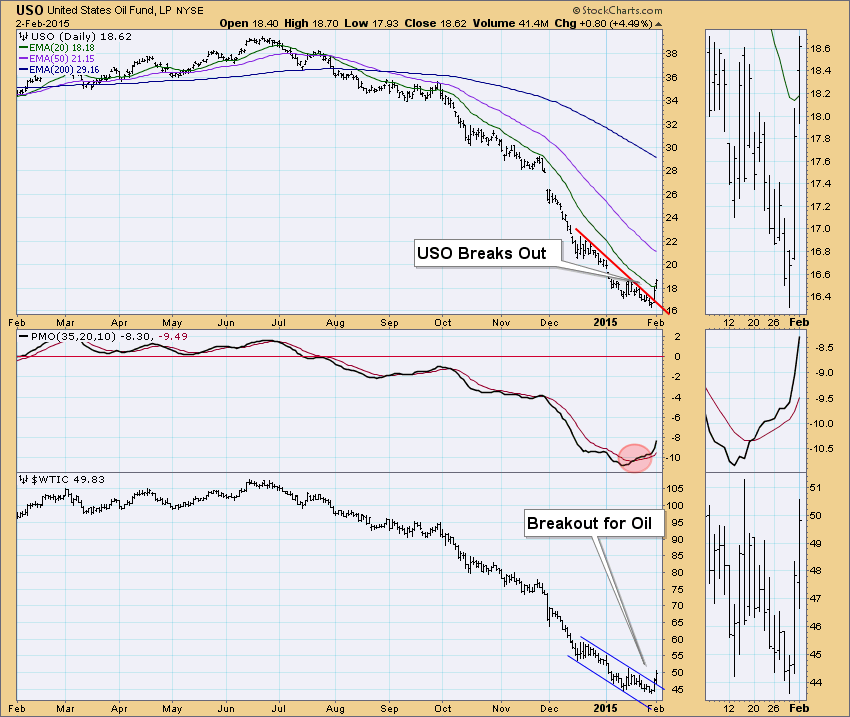
USO Breaks Out - Rydex Asset Analysis - Neutral Signals on Dow (DIA) and Technology Equal-Weight (RYT)
by Erin Swenlin,
Vice President, DecisionPoint.com
There were some exciting charts and interesting Trend Model signal changes today. We will look at the Oil breakout and determine if this is finally a buying opportunity for USO. Rydex Asset analysis suggests a possible price bottom for the market.
United States Oil Fund (USO) finally had a significant...
READ MORE
MEMBERS ONLY
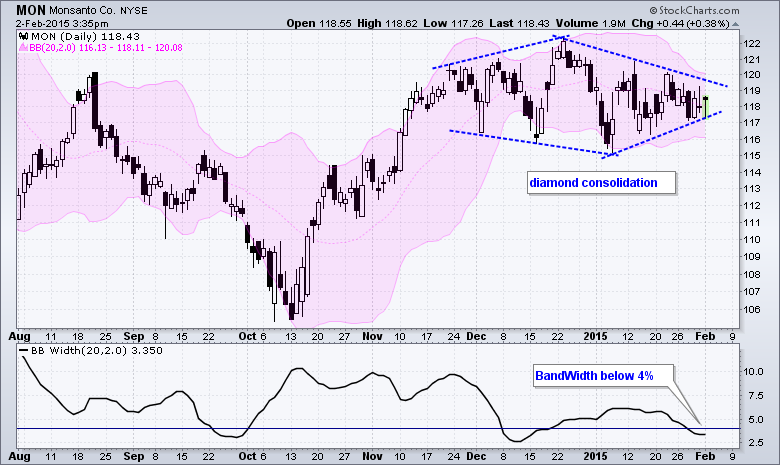
The Noose Tightens on Monsanto
by Arthur Hill,
Chief Technical Strategist, TrendInvestorPro.com
Monsanto (MON) could be poised for a volatility expansion because BandWidth has narrowed over the last few weeks and volatility has contracted signficantly. The BandWidth indicator tells us that the difference between the upper and lower Bollinger Bands is less than 4%, which is relatively low. John Bollinger theorized that...
READ MORE
MEMBERS ONLY

DIA BREAKS TRIANGLE TREND LINE -- EQUAL-WEIGHT S&P 500 ETF TESTS KEY LEVEL -- FIVE SECTOR ETFS WITH REVERSAL PATTERNS -- BPI HITS MOMENT-OF-TRUTH FOR GOLD MINERS ETF -- GOLD TESTS BREAKOUT WITH A THROWBACK
by John Murphy,
Chief Technical Analyst, StockCharts.com
DIA BREAKS TRIANGLE TREND LINE... Link for today's video. Stocks came under selling pressure last week as the major index ETFs gapped down on Tuesday and stayed down. Chart 1 shows the Dow SPDR (DIA) gapping below 175 and closing below the lower trend line of a triangle....
READ MORE
MEMBERS ONLY
Short-Term Trend, Breadth and Risk Analysis
by Arthur Hill,
Chief Technical Strategist, TrendInvestorPro.com
Stocks took it on the chin last week with large-caps leading the way lower. QQQ and the S&P 100 ETF (OEF) lost around 3% last week. Big banks and big techs led the way lower as XLK and XLF lost over 3%. The Consumer Discretionary SPDR (XLY) held...
READ MORE
MEMBERS ONLY

WEAK GDP REPORT PUSHES STOCKS LOWER IN HEAVY TRADING AND THREATENS SUPPORT -- S&P 500 WEEKLY CHART SHOWS NEGATIVE DIVERGENCES -- BONDS ARE OUTPEFORMING STOCKS IN NEW YEAR -- DROP IN TWO-YEAR YIELD SHOWS SOME LOSS OF CONFIDENCE
by John Murphy,
Chief Technical Analyst, StockCharts.com
FRIDAY SELLOFF IN HEAVY TRADING THREATENS CHART SUPPORT... Friday's disappointing fourth quarter GDP report of only 2.6% caused heavy selling of stocks and buying of bonds. The combination of falling stock prices and heavy volume gave the week's performance a negative look, and suggests tht...
READ MORE
MEMBERS ONLY
Trend Model Neutral Signals for SPX, DOW, OEX and NYSE
by Erin Swenlin,
Vice President, DecisionPoint.com
We have been watching the SPX closely in anticipation of an Intermediate-Term Trend Model Neutral signal. It is extraordinarily close to reaching that 20/50-EMA crossover as are many of the other indexes. The DOW, OEX and NYSE are the first to generate Neutral signals as the 20-EMA crossed below...
READ MORE
MEMBERS ONLY

BATTLING SUPPORT AND CONSOLIDATING -- S&P MIDCAP CONSOLIDATES NEAR HIGHS -- SMALL AND MICRO CAPS PERK UP -- GROWTH OUTPERFORMS VALUE -- CONSUMER DISCRETIONARY HOLDING UP WELL, FINANCE NOT -- HOUSING AND RETAIL SPDRS BOUNCE ABOVE SUPPORT
by John Murphy,
Chief Technical Analyst, StockCharts.com
STILL BATTLING SUPPORT AND CONSOLIDATING... Link for today's video. The major stock indices remain range bound since early November, but these ranges still look like consolidations or corrections within bigger uptrends. Chart 1 shows the S&P 500 breaking out in late October on its way to...
READ MORE
MEMBERS ONLY

Know Thyself

by Greg Morris,
Veteran Technical Analyst, Investor, and Author
Welcome to being human! Do you really know that person you see while shaving or applying makeup? If you are going to be a successful investor/trader, you better get to know him/her and know them really well – like the back of your hand. As a human being, you...
READ MORE
MEMBERS ONLY
Utilities leading the (relative) way
by Julius de Kempenaer,
Senior Technical Analyst, StockCharts.com
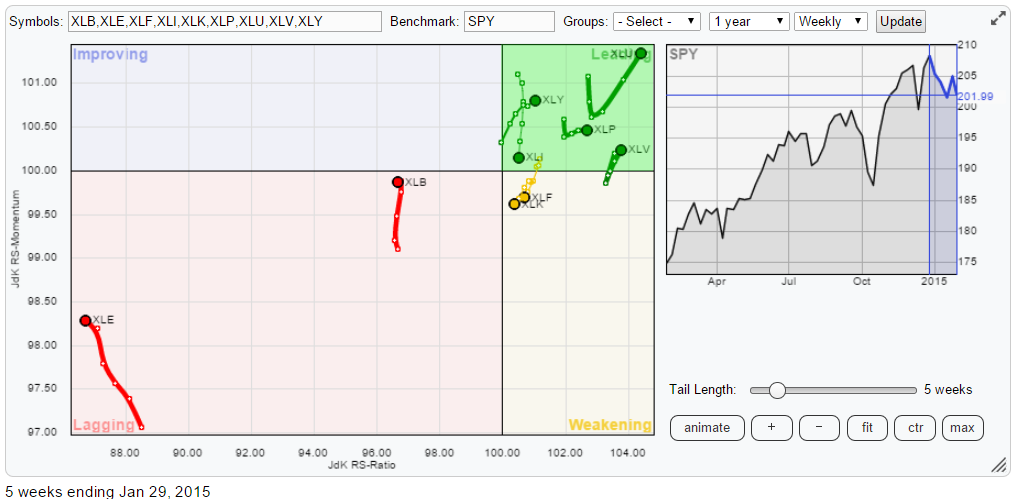
The Relative Rotation Graph below holds the nine S&P sector ETFs showing the weekly relative trends against the S&P 500 (SPY) and against each other.
As you can see it is pretty crowded in the top-right, leading quadrant and a lot less so in the opposite...
READ MORE
MEMBERS ONLY
Short-Term Trend, Breadth and Intermarket Analysis
by Arthur Hill,
Chief Technical Strategist, TrendInvestorPro.com
Stocks started the day with some selling pressure, but firmed around 11AM and moved steadily higher the rest of the day. Small-caps and micro-caps led the way as IWM and IWC gained 1.38% and 1.48%, respectively. The consumer discretionary sector led the SPDRs, the equal-weight sectors and the...
READ MORE
MEMBERS ONLY
DP Trend Model Neutral Signal on Technology ETF (XLK)
by Erin Swenlin,
Vice President, DecisionPoint.com
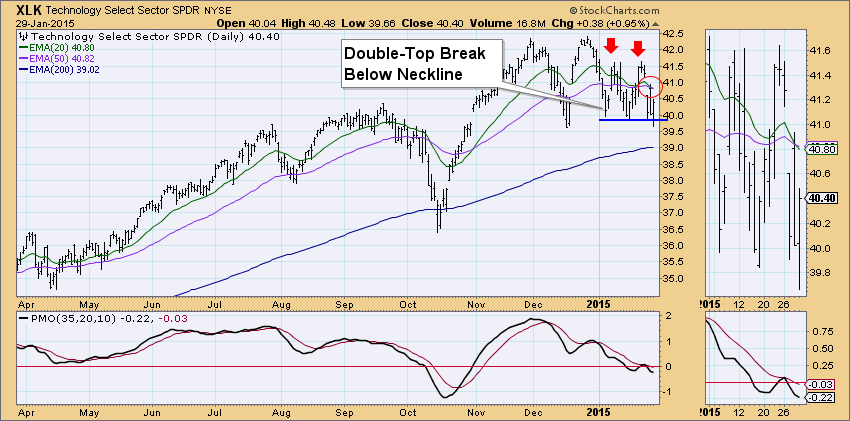
The Technology ETF (XLK) looks a lot like the SPY (see DecisionPoint Blog article, "Double-Top and Initiation Impulse Spell Trouble") which is not a good thing right now.
First, the DecisionPoint Intermediate-Term Trend Model generated a Neutral signal when the 20-EMA crossed below the 50-EMA. It was not...
READ MORE
MEMBERS ONLY
Double-Top and Initiation Impulse Spell Trouble
by Erin Swenlin,
Vice President, DecisionPoint.com
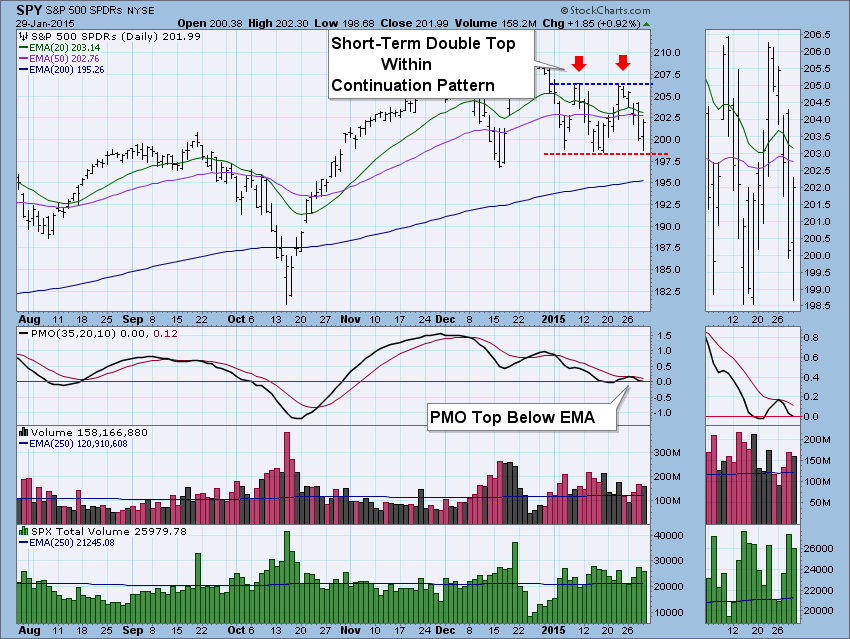
What looked like a short-term double-bottom formation, has now reconfigured into a double-top. So in the matter of a week, we've gone from positive indicators and a bullish double-bottom formation to negative indicators in all three time frames and a bearish double-top formation. We see price has been...
READ MORE
MEMBERS ONLY

Youthful Investors versus Grizzly Veterans: Beer versus Wine
by Gatis Roze,
Author, "Tensile Trading"
At a recent seminar, I was asked by a sharp young investor how much trading rules had changed since I began trading way back in 1905. He didn’t actually say 1905, but the tone and cadence of the question gave him away. By pure chance, I had just picked...
READ MORE
MEMBERS ONLY
Gaps Hold - GLD Triangulates - Oil Breaks Down
by Arthur Hill,
Chief Technical Strategist, TrendInvestorPro.com
Stocks took it on the chin again on Wednesday with the major index ETFs losing over 1%. Well, QQQ managed a 0.5% loss because Apple and Facebook gained. Nevertheless, 89 out of the 100 stocks in QQQ declined and selling pressure was pretty lopsided. Energy-related stocks were hammered as...
READ MORE
MEMBERS ONLY

NEW LOWS IN CRUDE OIL AND TREASURY YIELDS INCREASE DEFLATIONARY CONCERNS -- STOCKS SELLOFF IN AFTERNOON TRADING -- DOW HITS NEW JANUARY LOW -- NASDAQ AND S&P 500 MAY CHALLENGE THEIR JANUARY LOWS -- VIX JUMPS 18%
by John Murphy,
Chief Technical Analyst, StockCharts.com
10-YEAR TREASURY TUMBLES AS OIL HITS NEW LOW... Deflationary forces continue to push commodity prices and bond yields lower. Most commodities fell again today, with most attention on oil. The black line in Chart 1 shows the United States Oil ETF (USO) falling to a new low today. So did...
READ MORE
