MEMBERS ONLY

Will The End-Of-The-Month Bullish Seasonal for Equities Be Enough To Avoid A Downside Domino Effect?

by Martin Pring,
President, Pring Research
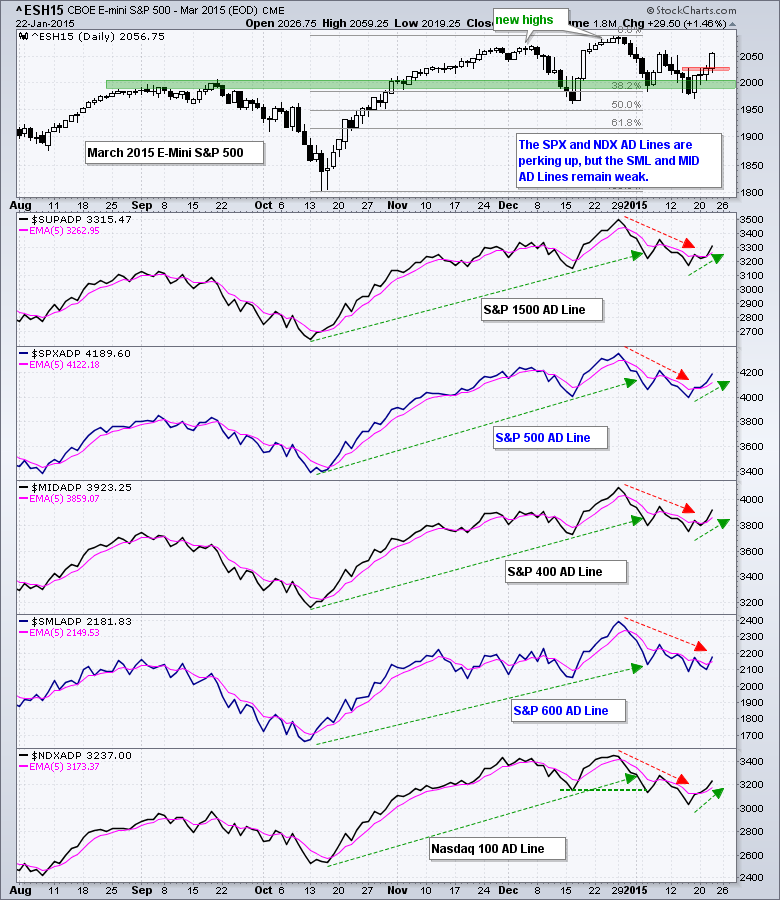
* NYSE Composite is forming a head and shoulders top or is it a bottom?
* IWM experiences false upside breakout
* SPY/EFA ratio is signaling a dollar correction. Will the Index take the bait?
* Wisdom Tree Yuan fund right on a key up trend line
I last wrote about the US...
READ MORE
MEMBERS ONLY
Bond Market Says Lower Rates Ahead

by Arthur Hill,
Chief Technical Strategist, TrendInvestorPro.com
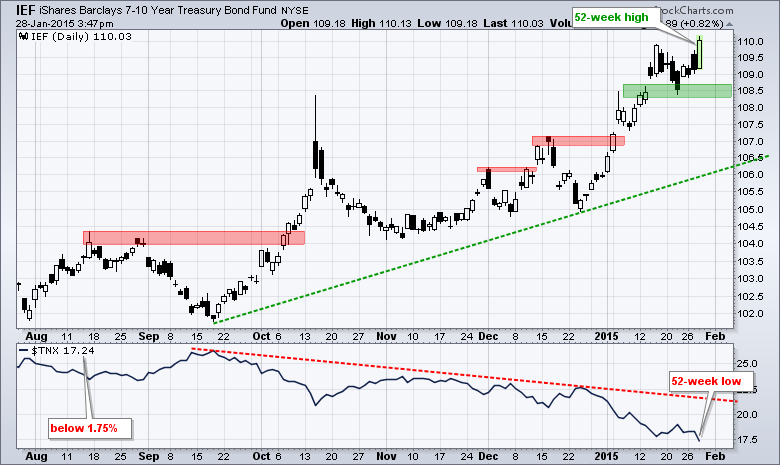
Another Fed statement has come and gone, and Treasury bonds simply continue to march higher. The chart below shows the 7-10 YR T-Bond ETF (IEF) hitting yet another 52-week high today with a big move above 110. The indicator window shows the 10-YR Treasury Yield ($TNX) moving below 1.75%...
READ MORE
MEMBERS ONLY
Short-Term Trend, Breadth and Risk Analysis
by Arthur Hill,
Chief Technical Strategist, TrendInvestorPro.com
Stocks continued their volatile ways as SPY and QQQ fell sharply on the open, rebounded and then sold off in the final hour. Microsoft and Durable Goods got most of the blame. The strong Dollar is also affecting earnings in large-caps. Small-caps held up quite well as IWM fell just...
READ MORE
MEMBERS ONLY
Long Real Estate and Short Commodities .... End of Story

by Julius de Kempenaer,
Senior Technical Analyst, StockCharts.com
The relative rotation of various asset classes continues to tell the same story as it has been doing for quite a while now.
I could make this a very short article by just saying that the short version of this party line remains to be long or overweight real estate...
READ MORE
MEMBERS ONLY
DP Market Update: Double-Bottom Aborts - January 27, 2015

by Erin Swenlin,
Vice President, DecisionPoint.com
Earnings from big companies like Microsoft, P&G and Caterpillar were disappointing and are taking some of the blame for today's drop. On the flip side, Apple crushed previous estimates, but it didn't save it from the tidal wave of selling in the general market,...
READ MORE
MEMBERS ONLY

WEBINAR CHARTS -- DOW DIAMONDS PLUNGES AND EW S&P 500 ETF STALLS -- LARGE-CAP TECHS LEAD THE MARKET LOWER -- WEEKLY CHARTS FOR PERSPECTIVE -- MID-CAP HIGH-LOW PERCENT LEADS -- HIGH-LOW PERCENT FOR XLY AND XLK LAGS -- OIL AND ENERGY ETFS

by John Murphy,
Chief Technical Analyst, StockCharts.com
WEBINAR CHARTS... The major index ETFs have gone nowhere since mid November and continue to go nowhere during earnings season. For example, the S&P 500 SPDR (SPY) surged off support in the 2000 area with a 3% move last week and gave a chunk back with a decline...
READ MORE
MEMBERS ONLY
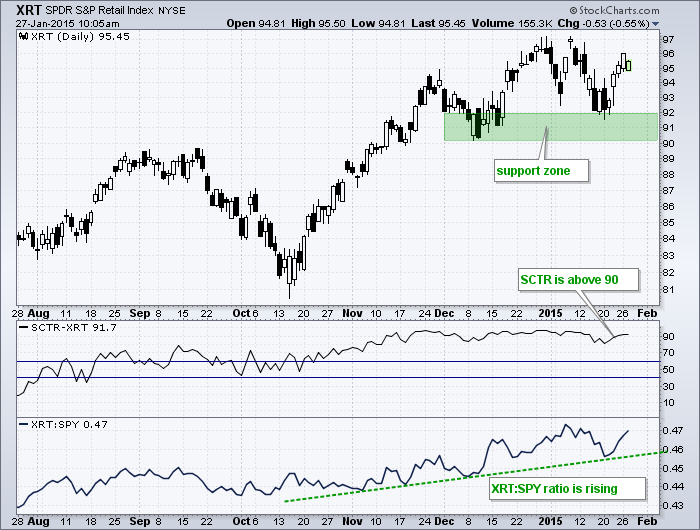
Retail SPDR Holds Key Area and Shows Relative Strength
by Arthur Hill,
Chief Technical Strategist, TrendInvestorPro.com
The chart below shows the Retail SPDR (XRT) bouncing off a support zone and remaining in an uptrend. For relative strength, the first indicator window shows the StockCharts Technical Rank (SCTR) above 90, which means XRT is in the top 10% of our ETF universe. The second window shows the...
READ MORE
MEMBERS ONLY
MDY and IWM Start to Lead - TLT Stalls Ahead of Fed
by Arthur Hill,
Chief Technical Strategist, TrendInvestorPro.com
Stocks started the day weak, but quickly found their footing and moved higher the rest of the day. Despite this recovery, QQQ ended the day with a fractional loss and SPY closed with a fractional gain. Small-caps and mid-caps were another story as IWM gained 1% and MDY led with...
READ MORE
MEMBERS ONLY
Intermediate-Term Indicators Positive Crossovers and Industrials Equal-Weighted ETF (RGI) BUY Signal
by Erin Swenlin,
Vice President, DecisionPoint.com
I've been watching our indicator charts very closely for quite sometime now as we prepare for a possible breakout from the double-bottom formation on the SPY. Additionally, we had a Trend Model signal change on our DP Alert Daily Report (found in the subscriber-only DP Reports Blog).
Intermediate-Term...
READ MORE
MEMBERS ONLY

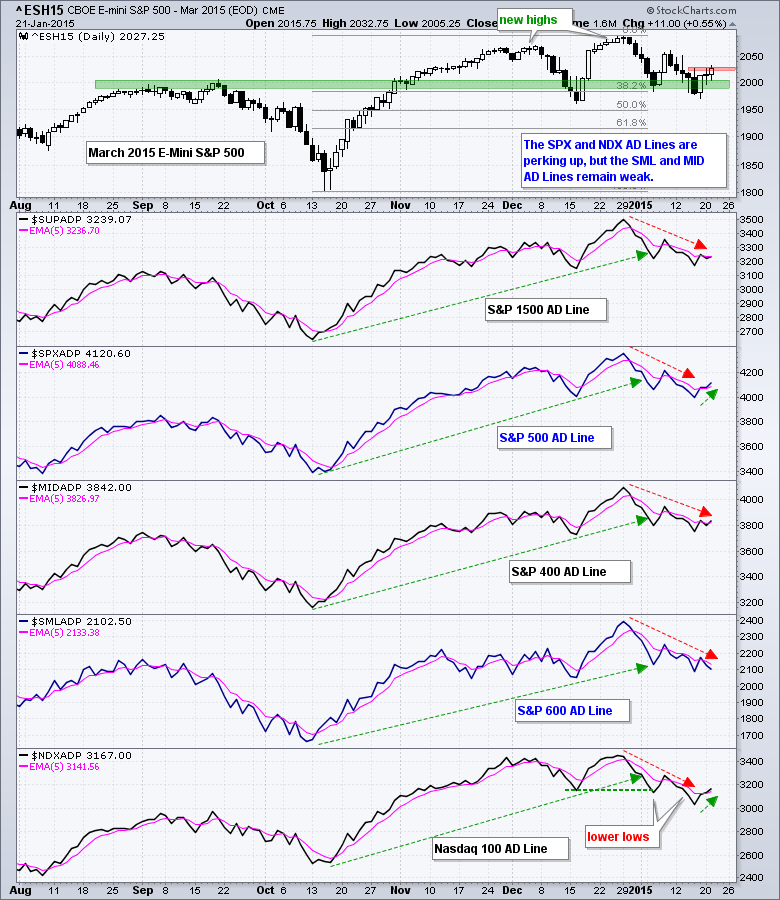
MID CAPS AND LARGE TECHS SHOW RELATIVE STRENGTH -- DR HORTON AND LENNAR LEAD ITB SUPPORT BOUNCE -- BIOTECHS SHOW BROAD STRENGTH -- CARZ BREAKS LATE DECEMBER HIGH -- TOYOTA AND DAIMLER LEAD -- GM HITS SUPPORT ZONE AS F CONSOLIDATES
by John Murphy,
Chief Technical Analyst, StockCharts.com
MID CAPS AND LARGE TECHS SHOW RELATIVE STRENGTH ... Link for today's video. The S&P MidCap SPDR (MDY) and the Nasdaq 100 ETF (QQQ) are starting to show relative strength, but in two different ways. Chart 1 shows QQQ with a breakout in late October and new...
READ MORE
MEMBERS ONLY
Short-term Trend Analysis for QQQ, GLD, TLT, USO and More
by Arthur Hill,
Chief Technical Strategist, TrendInvestorPro.com
Stocks took a breather on Friday, but the Nasdaq 100 ETF (QQQ) and Russell 2000 Growth iShares (IWO) bucked the selling pressure by producing small gains to end the week. Overall, QQQ led the market last week with a 3.41% gain and the Technology SPDR (XLK) led the sector...
READ MORE
MEMBERS ONLY
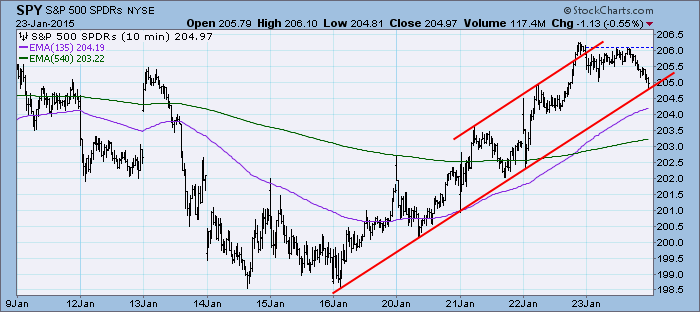
DP Weekly Update: Price Stopped at Double-Bottom Neckline - January 23, 2015
by Erin Swenlin,
Vice President, DecisionPoint.com
**Please note the new DecisionPoint Blog publishing schedule. The Friday DP Weekly Update will only be available in the Subscriber-only DP Reports Blog starting next week.**
Join me Wednesday for the first DecisionPoint LIVE! Webinar at 4:30pm Eastern. Click here to register!
Price took a pause and moved back...
READ MORE
MEMBERS ONLY

S&P 500 CONFIRMS KEY SUPPORT LEVEL -- $NDX FORMS BIG CONTINUATION PATTERN -- LARGE AND MID CAPS LEAD NEW HIGHS -- DEFENSIVE SECTORS LEAD RANKINGS -- XLU, XLP AND XLV HIT NEW HIGHS -- OFFENSIVE SECTORS SURGE OFF SUPPORT -- UPS SHOWS CHALLENGE OF EARNINGS
by John Murphy,
Chief Technical Analyst, StockCharts.com
S&P 500 SURGES TO CONFIRM KEY SUPPORT LEVEL... Link for today's video. Stocks bounced this week with broad strength that reinforced support areas for several key indices. Chart 1 shows the S&P 500 breaking above the 2000 area in November and successfully testing this...
READ MORE
MEMBERS ONLY
Over 150 Fresh Tradeable Insights: The Tensile Trading ChartPack Update 6.0

by Gatis Roze,
Author, "Tensile Trading"
For both existing ChartPack users as well as investors who have not yet downloaded the ChartPack – or perhaps don’t fully understand the many benefits of how to maximize its use – I’m pleased that a free video and user manual is now available for your review. Grab a cup...
READ MORE
MEMBERS ONLY
IWM Follows with a Breakout - USO Forms Another Consolidation
by Arthur Hill,
Chief Technical Strategist, TrendInvestorPro.com
Stocks moved sharply higher on Thursday with IWM getting the biggest gain among the major index ETFs. Note that IWM and IJR were both up over 2%. Even though these two show relative weakness in January, they typically outperform during a broad market move. The Finance SPDR (XLF) sprang to...
READ MORE
MEMBERS ONLY

DecisionPoint LIVE! Webinar Starts Wednesday + New Publishing Schedule
by Erin Swenlin,
Vice President, DecisionPoint.com
I'm pleased to announce that I will be hosting my first webinar, DecisionPoint LIVE! on Wednesday at 4:30pm Eastern. You'll get live market analysis from the DecisionPoint perspective every Wednesday. I'll be presenting my technical views on the markets and then take questions...
READ MORE
MEMBERS ONLY
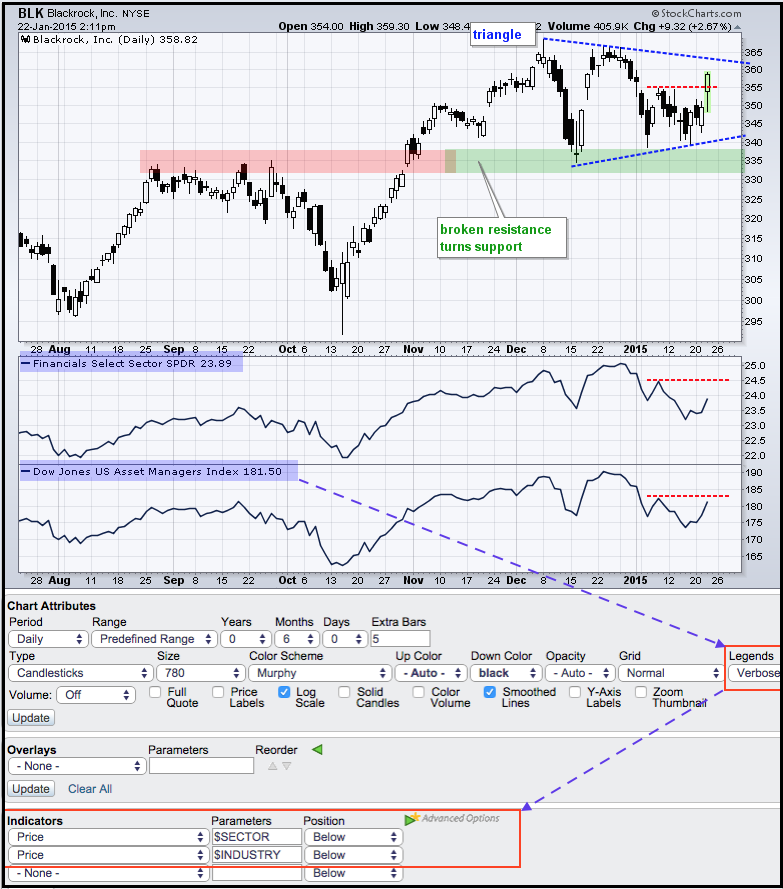
Blackrock Leads Assets Managers Group Higher
by Arthur Hill,
Chief Technical Strategist, TrendInvestorPro.com
The finance sector came to life on Thursday with leadership from banks ($DJUSBK) and asset managers ($DJUSAG). The chart below shows asset manager Blackrock holding its breakout and surging off support with a big move above 355. Notice that the stock shows a little more "chart" strength than...
READ MORE
MEMBERS ONLY

EUROPEAN STOCKS LEAD GLOBAL RALLY ON ECB ACTION -- GERMANY AND FRANCE LEAD EUROPE RALLY -- BUT EURO FALLS TO ELEVEN-YEAR LOW -- WEAK OIL BOOSTS RETAILERS AND TRANSPORTS AS U.S. STOCKS RALLY -- S&P 500 CLEARS 50-DAY LINE -- VIX PLUNGES
by John Murphy,
Chief Technical Analyst, StockCharts.com
ECB COMES THROUGH ... The ECB gave the world's financial markets what they wanted, and a little bit more. Mario Draghi expanded the ECB asset-buying program to include sovereign bonds to the tune of 60 billion euros per month at least until the end of September 2016. That comes...
READ MORE
MEMBERS ONLY
QQQ and SPY Perk Up, but IWM Shows Relative Weakness
by Arthur Hill,
Chief Technical Strategist, TrendInvestorPro.com
Stocks managed to claw out some gains with large-caps leading the way. SPY and QQQ gained around a half percent. Small-caps were weak as IWM fell .32%. The gains and losses were small and not that significant. Energy, materials and utilities led the market higher. This is not the crew...
READ MORE
MEMBERS ONLY
Short-Term Indicators in Question
by Erin Swenlin,
Vice President, DecisionPoint.com
First, thank you for all of your well wishes and comments sent to my Dad, Carl as he continues to recover from quadruple bypass surgery. He's making progress, it is just slow going, especially as far as he's concerned!
My last two blog article titles were...
READ MORE
MEMBERS ONLY
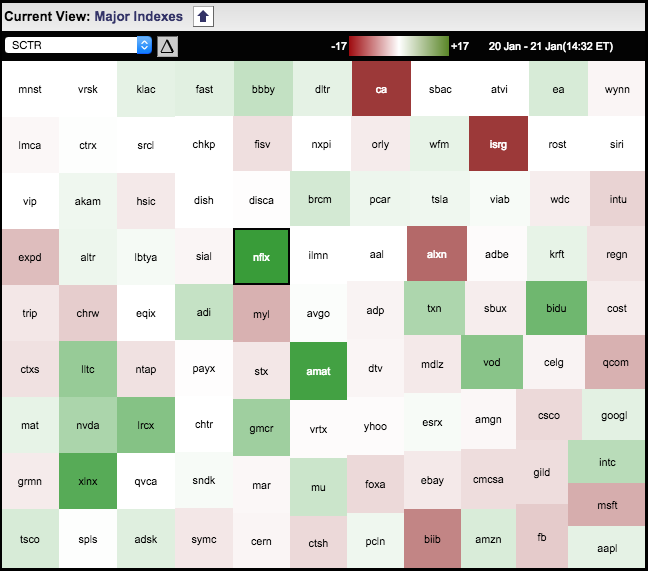
Six Semiconductor Stocks Lead on SCTR MarketCarpet
by Arthur Hill,
Chief Technical Strategist, TrendInvestorPro.com
The image below comes from a MarketCarpet for the Nasdaq 100. It is set to show the biggest changes in the StockCharts Technical Rank (SCTR). The biggest gainers have dark green boxes and the biggest losers have dark red boxes. Notice that seven green boxes come from the semiconductor group...
READ MORE
MEMBERS ONLY

ECB BOND BUYING MIGHT HELP EURO STOCKS, BUT NOT THE CURRENCY -- THE WISDOM TREE EUROPE HEDGED EQUITY FUND HEDGES OUT WEAK EURO -- CURRENCY VOLATILITY PUSHES MONEY INTO GOLD -- HOMEBUILDERS DROP BACK TO 200-DAY AVERAGE
by John Murphy,
Chief Technical Analyst, StockCharts.com
ECB IS EXPECTED TO START QE TOMORROW... The ECB is expected to announce a quantitative easing program tomorrow (Thursday) which will involve buying sovereign bonds. [A leak today outlining some of the details of that program helped stabilize stocks here and in Europe]. Expectations for QE over the past few...
READ MORE
MEMBERS ONLY
Short-term Trend Analysis for QQQ, GLD, TLT, UUP and More
by Arthur Hill,
Chief Technical Strategist, TrendInvestorPro.com
The technology sector came to life with a modest gain on Tuesday, but the consumer discretionary and finance sectors countered with declines. Relative weakness in finance is getting to be a problem for the overall market and may not clear up as long as Treasury yields fall. The consumer discretionary...
READ MORE
MEMBERS ONLY

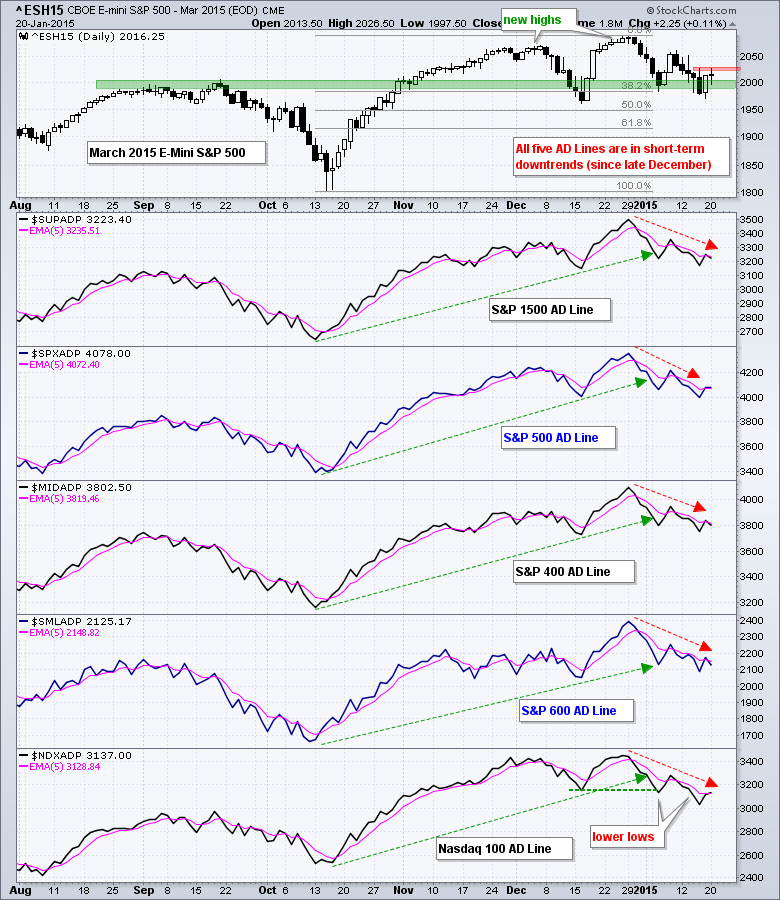
WEBINAR CHARTS -- IWM AND IWC STILL HOLDING BREAKOUTS -- RSP AND SPY STALL AFTER BREAKOUTS -- SECTOR PERFORMANCE REFLECTS A MIXED MARKET -- RANKING 27 SECTORS -- QQQ AND TOP TECHS LAG -- AIRLINES CONTINUE TO LEAD
by John Murphy,
Chief Technical Analyst, StockCharts.com
WEBINAR CHARTS ... Click here for the Webinar recording. These are the charts and commentary from Tuesday's Webinar (20-January). Trading remains quite choppy and we can see this in sector performance since early November. In fact, the stock market as a whole has gone nowhere since early November. Well,...
READ MORE
MEMBERS ONLY
Are US stocks losing their edge?
by Julius de Kempenaer,
Senior Technical Analyst, StockCharts.com
In my first article of this year I talked about more developed markets improving versus Emerging Markets. In the past few weeks however I have been monitoring rotation in international equity markets with interest as I think we are at cross-roads with regard to some relationships in this universe.
Obviously...
READ MORE
MEMBERS ONLY

The Many Faces of Technical Analysts

by Greg Morris,
Veteran Technical Analyst, Investor, and Author
After 40+ years as a technical analyst I have found that this breed of folks comes in my sizes and flavors. I can write about each of them simply because I have at one time or another been there, done that. In doing this I’ll share some stories along...
READ MORE
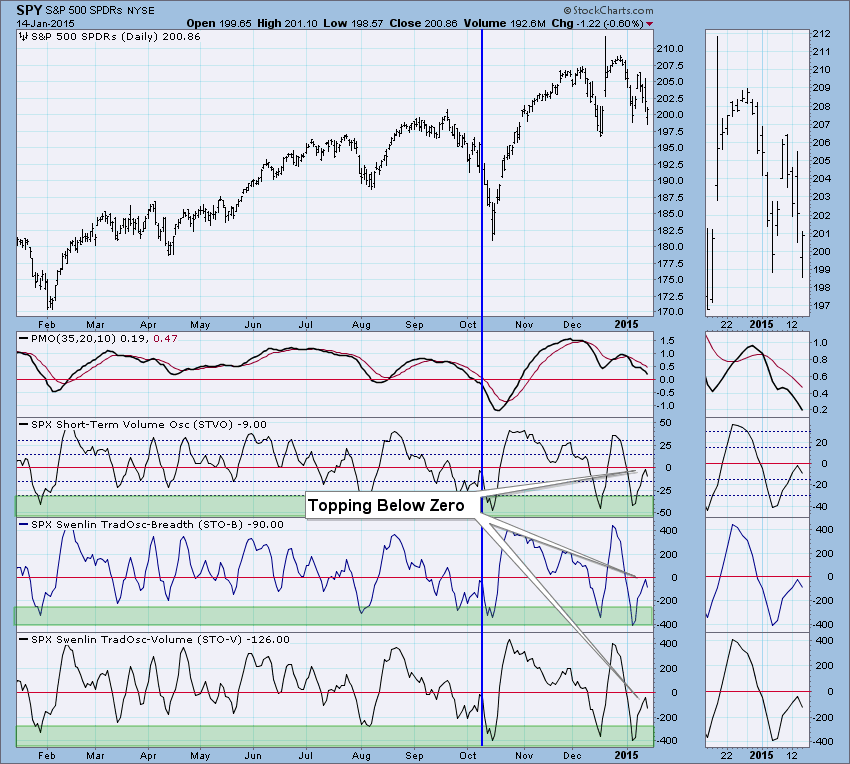
MEMBERS ONLY
Breadth, Risk Indicators and Short-Term Trend Analysis
by Arthur Hill,
Chief Technical Strategist, TrendInvestorPro.com
SPY, QQQ and IWM broke down last week, but rebounded sharply on Friday. Despite this rebound, the major index ETFs closed down for the week. IWM led Friday with a 1.63% advance and small-caps continue to hold up well overall. Energy led the sectors higher as XLE got a...
READ MORE
MEMBERS ONLY

The Rest of the World May be About to Beat US Equities for a While
by Martin Pring,
President, Pring Research
* Europe and Emerging Market equities positioned to move higher.
* Philippine ETF breaks to the upside.
* Silver breaks convincingly to the upside.
* Gold breaks out against US equities.
US versus the World
The trend favoring US equities over most of the rest of the world, may be in the process of...
READ MORE
MEMBERS ONLY
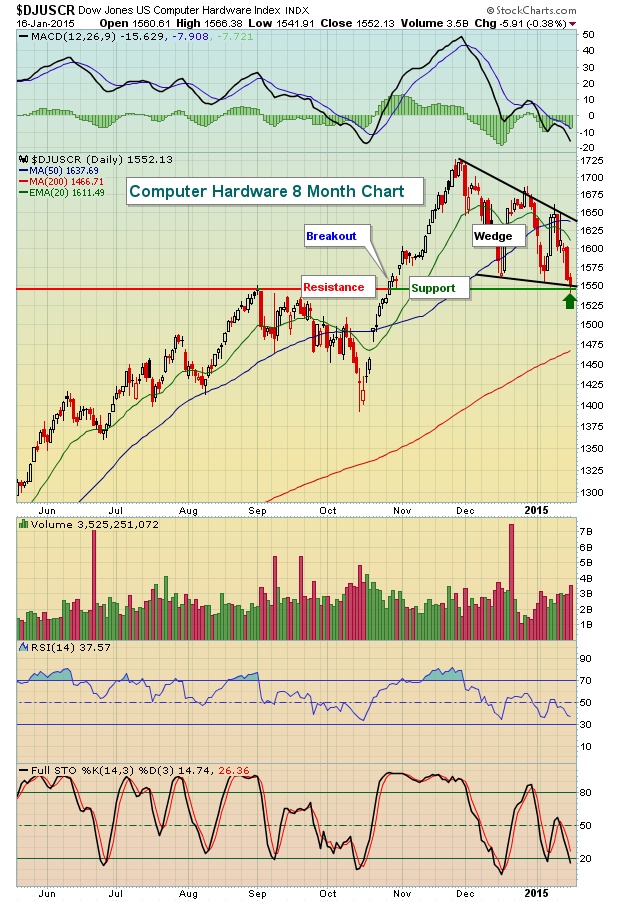
Key Tests Approaching in Technology

by Tom Bowley,
Chief Market Strategist, EarningsBeats.com
The nearly six year bull market lives on, but the bulls have been taking several body blows of late. Whether this bull market continues could depend on a couple of key industry groups within the technology space.
First, let's take a look at computer hardware ($DJUSCR). This is...
READ MORE
MEMBERS ONLY
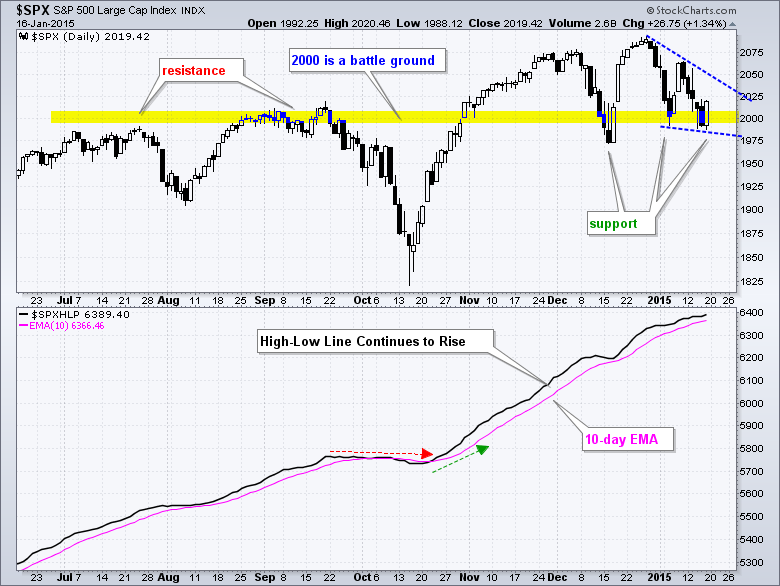
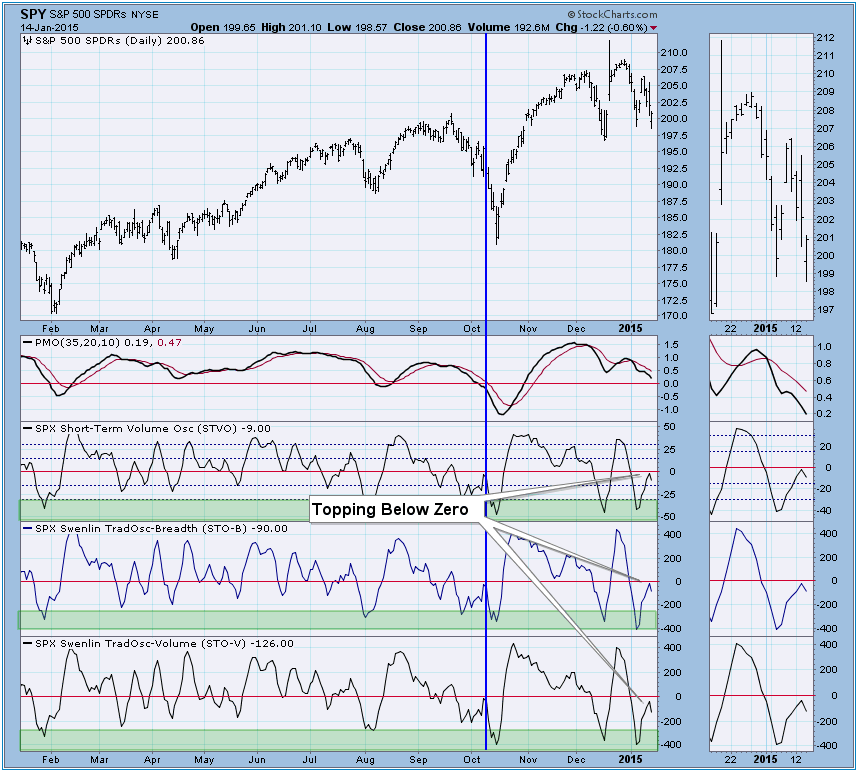
S&P 500 Does Battle with a Big Round Number
by Arthur Hill,
Chief Technical Strategist, TrendInvestorPro.com
Even though big round numbers should not have any technical significance, it is hard to argue with the magnetic pull of 2000 on the S&P 500. The index first neared 2000 when it broke above 1975 in July. After a pullback to the 1900 area in early August,...
READ MORE
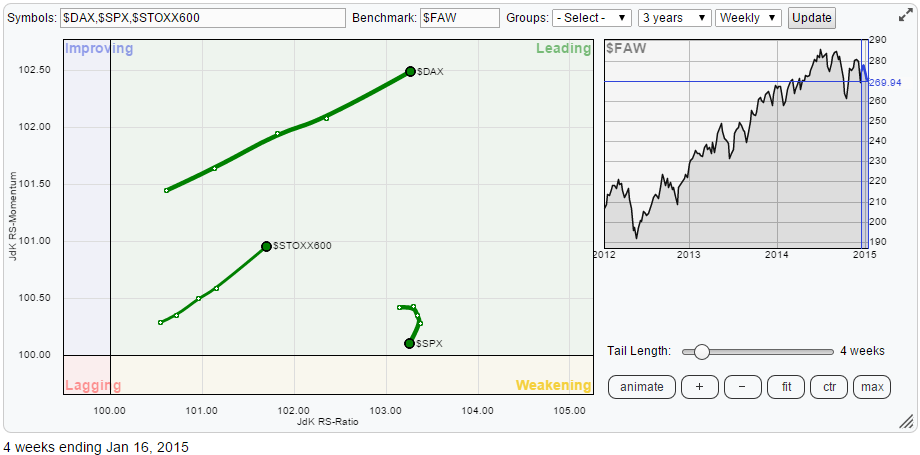
MEMBERS ONLY
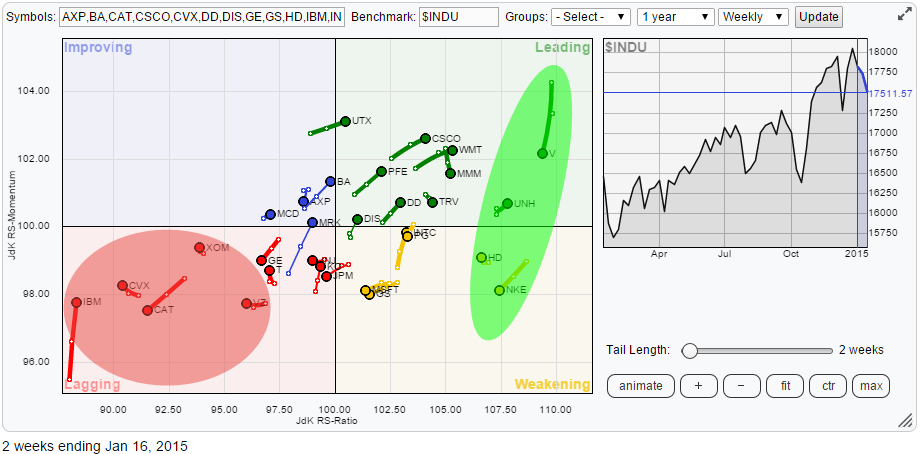
No Mickey Mouse rally for DIS
by Julius de Kempenaer,
Senior Technical Analyst, StockCharts.com
Below is the Relative Rotation Graph holding the 30 stocks that make up the Dow Jones Industrials index.
When I start analysing a universe like this I always start to look at what's going on on the outskirts of the RRG. In this case they are the names...
READ MORE
MEMBERS ONLY
DP Weekly Update: Short-Term Indicators Turn Up - January 16, 2015
by Erin Swenlin,
Vice President, DecisionPoint.com
Price took a break from decline and spent the day climbing. For the past three days, the 10-minute bar chart shows price is trading in a range of possible consolidation. Let's look at the indicators to find out where they are suggesting the market will be heading.
The...
READ MORE
MEMBERS ONLY
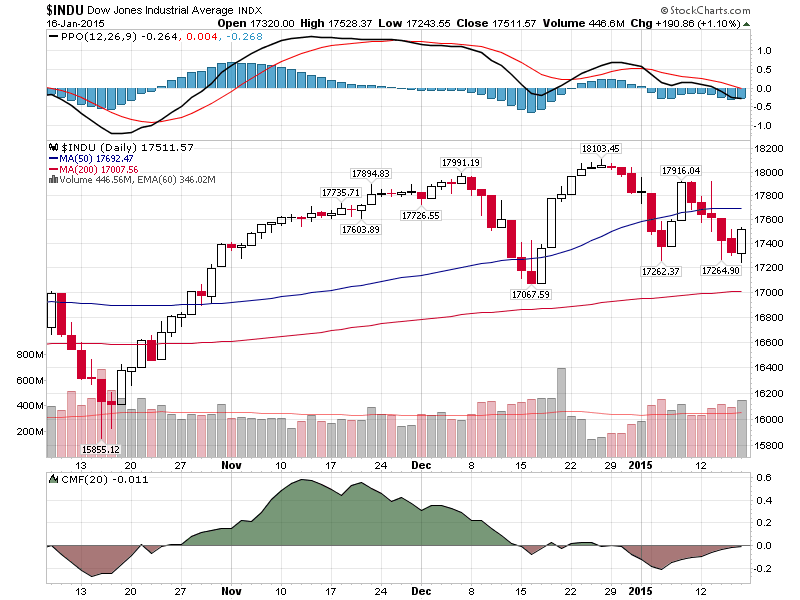
How to Attend a Live StockCharts.com Webinar
Hello Fellow ChartWatchers!
TGIF! Today's big turnaround saved us from an otherwise dreadful week as the Dow bounced off of support around 17260, the low at the beginning of the year. Our standard chart of the Dow shows the situation the best I think:
(Click the chart for...
READ MORE
MEMBERS ONLY

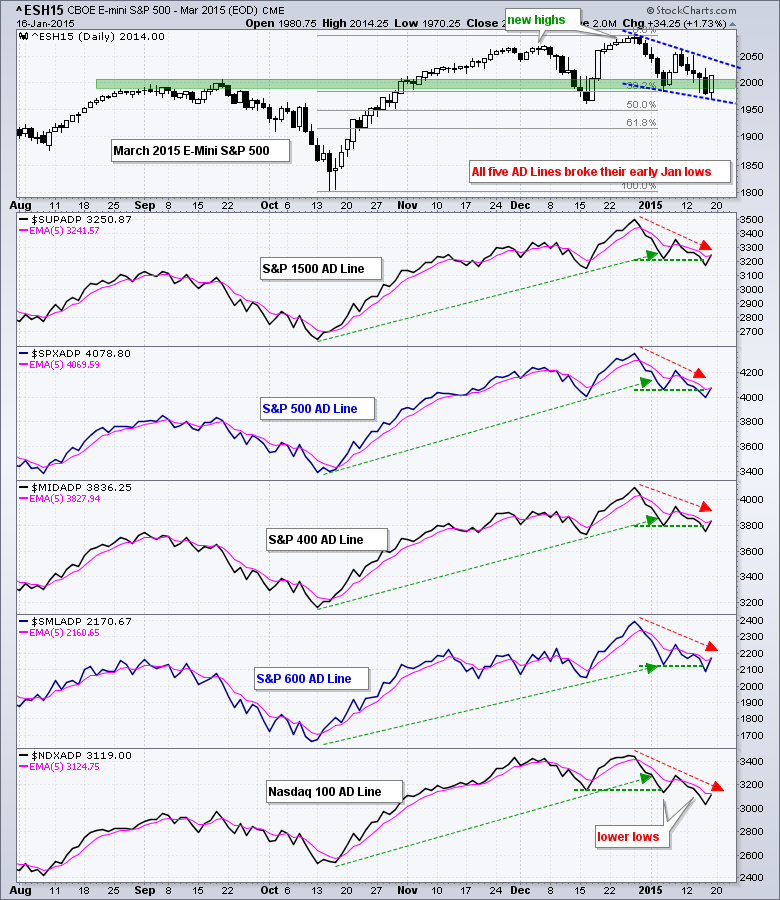
PUTTING THE PULLBACK INTO PERSPECTIVE -- RISK INDICATORS TURN NEGATIVE -- UTILITIES AND REITS CONTINUE TO ROCK -- WHY SO MANY NEW HIGHS IN XLF? -- XLY TESTS SUPPORT AS HIGH-LOW PERCENT TEETERS
by John Murphy,
Chief Technical Analyst, StockCharts.com
PUTTING THE DECLINE INTO PERSPECTIVE... Link for today's video. The financial markets have been quite risk averse lately and the US stock market has been quite defensive over the last few weeks, but the S&P 500 is still less then 5% from an all time closing...
READ MORE
MEMBERS ONLY
My Methodology Allocation Beats Asset Allocation
by Gatis Roze,
Author, "Tensile Trading"
From what I’ve seen of most investors’ asset allocations, it’s a maze. My personal asset allocation is better described as a labyrinth. Unlike a maze that attempts to make you mentally confused and physically lost, a labyrinth provides a path towards inner calm and mental clarity. My labyrinth...
READ MORE
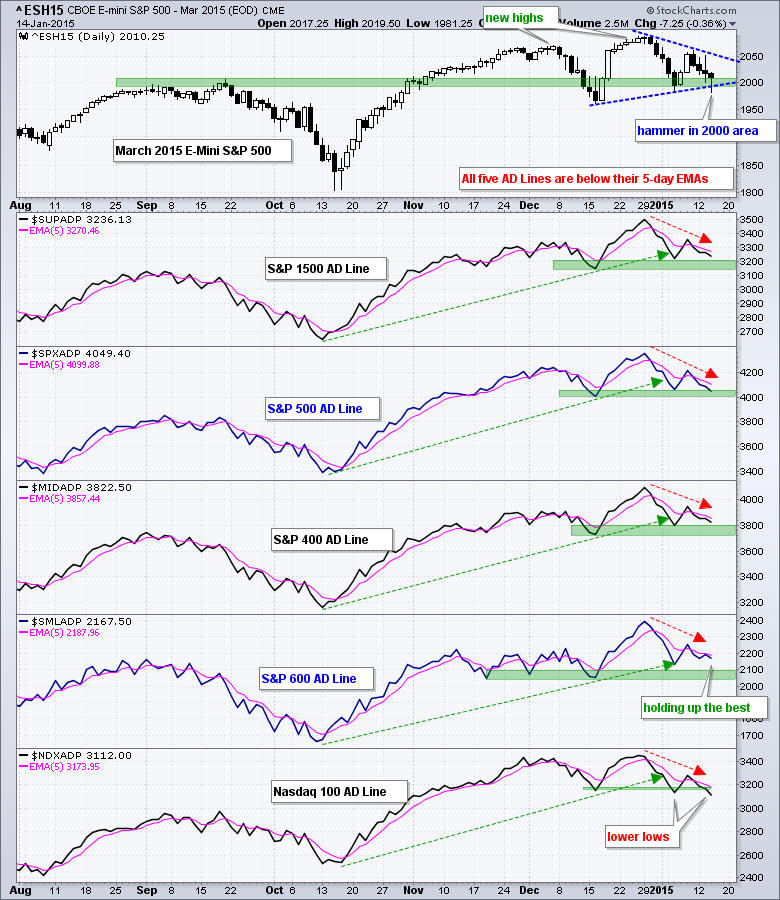
MEMBERS ONLY
Breadth, Risk Indicators and Short-Term Trend Analysis
by Arthur Hill,
Chief Technical Strategist, TrendInvestorPro.com
Stocks tried to bounce on Thursday, but selling pressure soon took over and the major index ETFs closed with losses again. Small-caps and large techs led the way as IWM fell 1.69% and QQQ declined 1.30%. Eight of nine sectors were down with consumer discretionary, technology, finance, energy...
READ MORE
MEMBERS ONLY
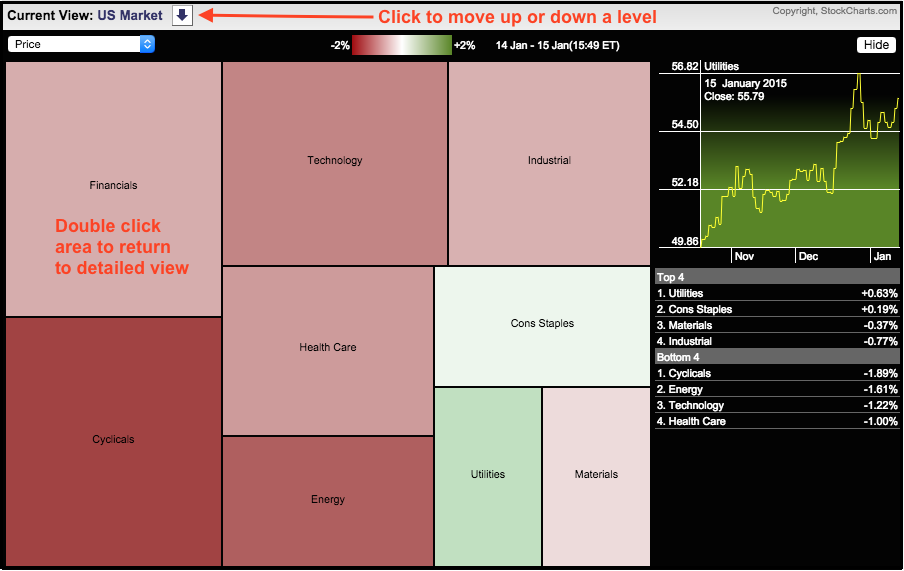
Consumer Discretionary Sector Turns Deep Red, But Utilities See Green
by Arthur Hill,
Chief Technical Strategist, TrendInvestorPro.com
The Sector MarketCarpet shows serious selling pressure in the consumer discretionary (cyclical), energy and technology sectors on Thursday because they are the deepest red. In contrast, the utilities sector is bright green because utility stocks advanced as money sought yield. The consumer staples sector also attracted some buying interest because...
READ MORE
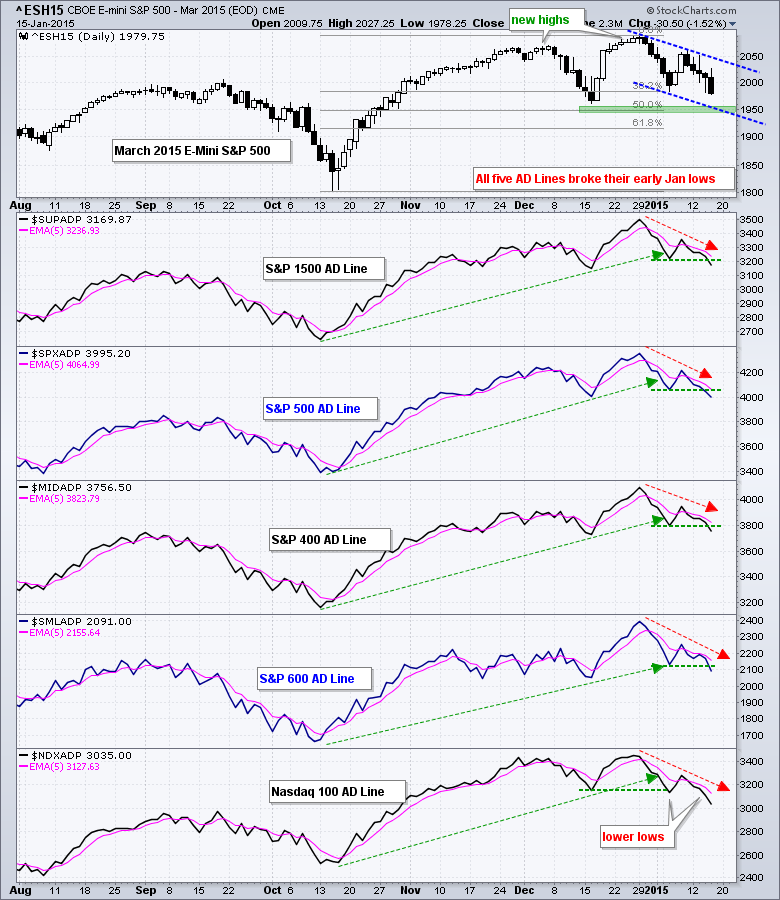
MEMBERS ONLY
Breadth, Risk Indicators and Short-Term Trend Analysis
by Arthur Hill,
Chief Technical Strategist, TrendInvestorPro.com
Stocks started the day under selling pressure as the major index ETFs gapped down on the open. Selling pressure continued into the afternoon, but buyers stepped in around 2PM and pushed stocks off their lows. This bounce was too little too late because SPY did not fill its opening gap....
READ MORE
MEMBERS ONLY
DecisionPoint Short-Term Indicators Move South
by Erin Swenlin,
Vice President, DecisionPoint.com
The DecisionPoint analysis process reviews indicators in three time frames: ultra-short term (typically hours/days), short term (typically days/weeks) and intermediate term (typically weeks). I'll cover short-term indicators today. If you'd like to see where our other indicators stand, you can check out the DP...
READ MORE
MEMBERS ONLY

COPPER PLUNGES TO SIX-YEAR LOW -- FREEPORT MCMORAN PLUNGES ALONG WITH IT -- 10-YEAR BOND YIELD FALLS TO 20-MONTH LOW ON DEFLATION -- FALLING BOND YIELDS HURT BANK STOCKS -- RISING VIX SUGGESTS PERIOD OF LOW VOLATILITY MAY BE ENDING
by John Murphy,
Chief Technical Analyst, StockCharts.com
COPPER FALLS TO SIX-YEAR LOW... It seems all we've hearing about lately is the plunge in the price of oil. That has led to a debate as to whether the plunge in crude is just the result of increased supply, or a sign of a weakening global economy....
READ MORE
