MEMBERS ONLY
SPY and QQQ Give Up their Gaps - IWM Shows Relative Strength

by Arthur Hill,
Chief Technical Strategist, TrendInvestorPro.com
Stocks surged in early trading, worked their way lower in mid morning and then plunged after lunch. With a small rebound in the final hour, the net losses were reduced and the major index ETFs closed fractionally lower. The Russell 2000 held up the best and closed fractionally higher. Energy,...
READ MORE
MEMBERS ONLY

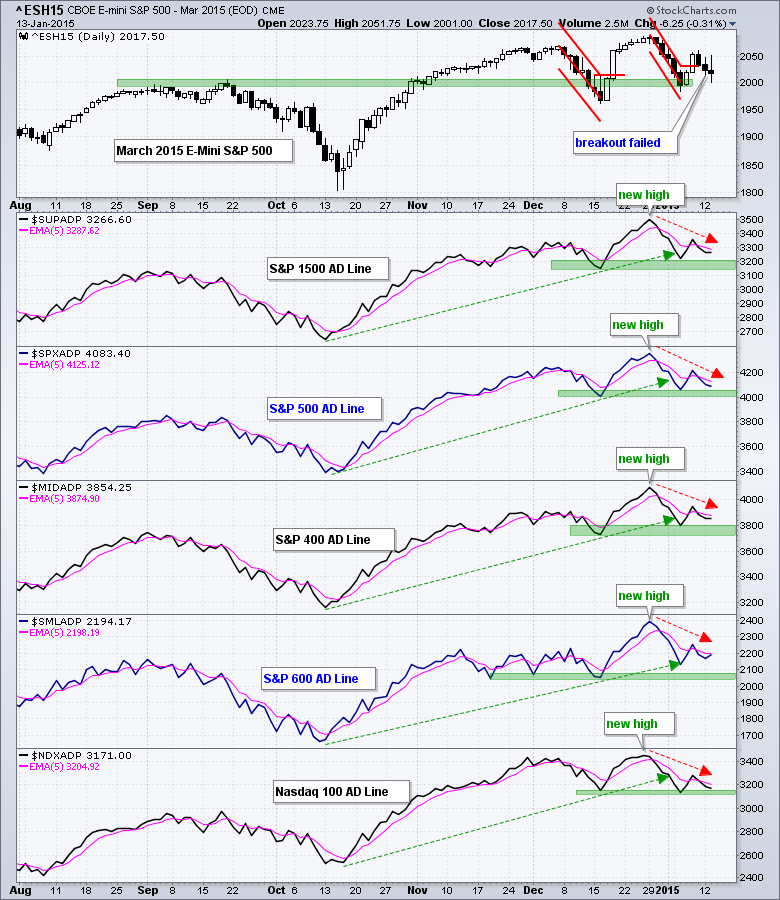
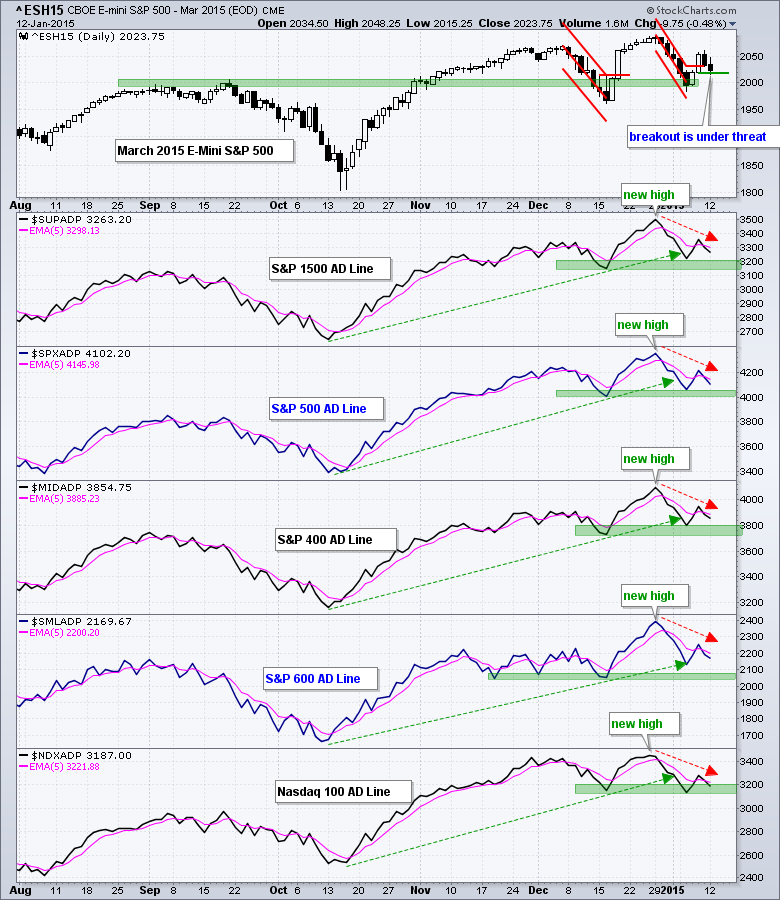
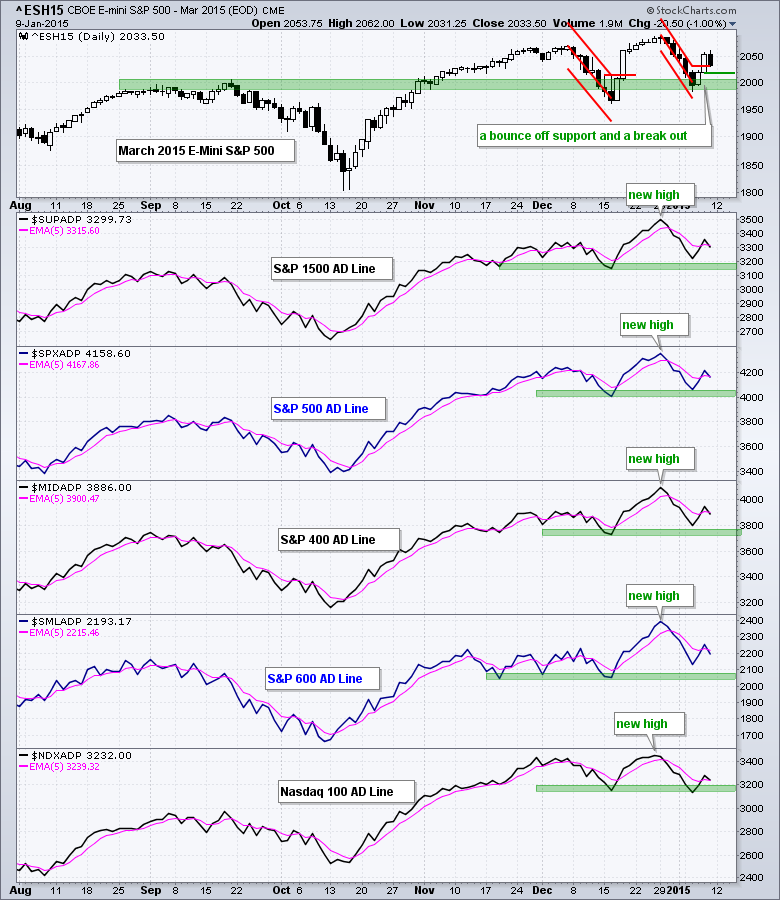
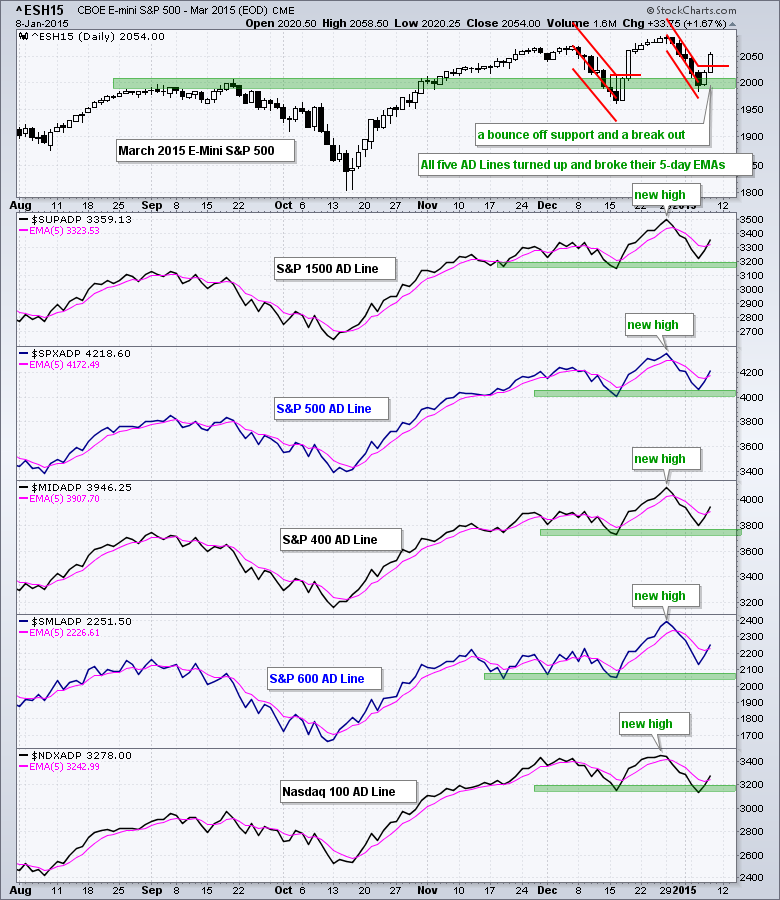
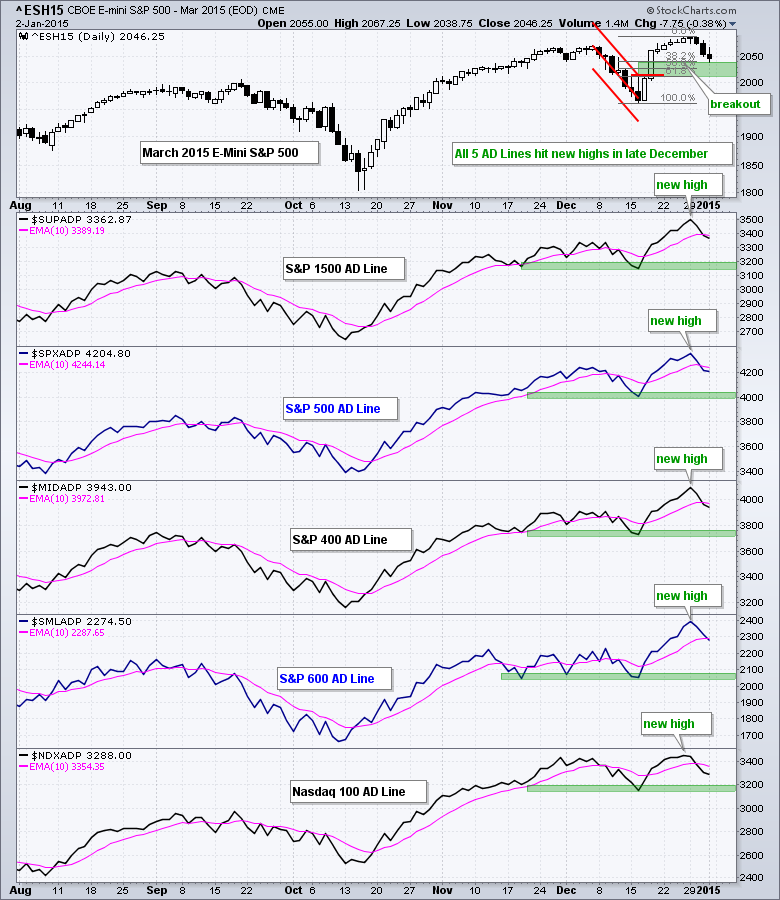
WEBINAR CHARTS - KEEPING YOUR EYE ON THE TREND -- SMALL-CAPS AND MICRO-CAPS ARE STILL OK -- INDEX AD LINES HOLD SUPPORT -- HIGH-LOW PERCENT INDICATORS REMAIN BULLISH -- A NOT-SO-SURPRISING SMALL-CAP LEADER -- FOUR STRONG SMALL-CAP SECTORS

by John Murphy,
Chief Technical Analyst, StockCharts.com
KEEPING YOUR EYE ON THE TREND... Link for today's video. These are the charts and commentary from Tuesday's Webinar (13-January). Trading has turned choppy in the major index ETFs since mid November, but sideways price action is not enough to derail the bigger uptrends. There are...
READ MORE
MEMBERS ONLY
Advance Decline Ratio Indicators (Chapter 5 - CGMBI)

by Greg Morris,
Veteran Technical Analyst, Investor, and Author
Here is the latest "Preview" chapter update from my upcoming book "The Complete Guide to Market Breadth Indicators - Second Edition" I am in the process of re-writing the original version using charts from StockCharts.com. As I complete a chapter (or most of a chapter)...
READ MORE
MEMBERS ONLY
SPY and IWM Hit a Moment-of-Truth - TLT Hits New High
by Arthur Hill,
Chief Technical Strategist, TrendInvestorPro.com
Stocks opened weak with a sharp decline in the first 30 minutes and then traded flat the rest of the day. Even though stocks managed to firm after early weakness, buyers held back and the major index ETFs closed with modest losses. Oil got the blame again as crude fell...
READ MORE
MEMBERS ONLY
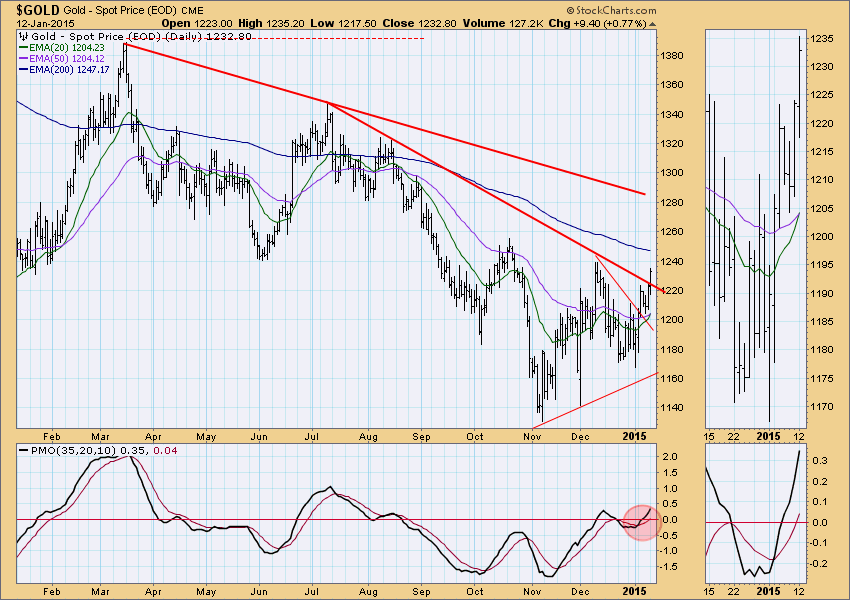
Intermediate-Term Trend Model BUY Signal on GOLD

by Erin Swenlin,
Vice President, DecisionPoint.com
GOLD: As of 1/12/2015 Gold is on a Trend Model BUY signal. The LT Trend Model, which informs our long-term outlook, is on a SELL signal as of 2/15/2013, so our long-term posture is bearish.
The big news for gold is that for the first time...
READ MORE
MEMBERS ONLY

TRACKING 10 KEY INDUSTRY GROUP ETF'S -- BANKS POINT SOUTHWEST AS HOMEBUILDERS POINT NORTHEAST -- ENERGY SHARES LEAD MARKET LOWER -- FINANCE SPDR FILLS A PAIR OF GAPS -- REGIONAL BANKS WEIGH ON FINANCE SECTOR -- 5-YR YIELD AND STOCK MARKET CORRELATION
by John Murphy,
Chief Technical Analyst, StockCharts.com
TRACKING 10 KEY INDUSTRY GROUP ETF'S... Link for today's video. PerfChart 1 shows year-to-date performance for 10 ETFs that represent different groups in the stock market. I normally use the Oil & Gas Equipment & Services SPDR (XES) and the Metals & Mining SPDR (XME) on...
READ MORE
MEMBERS ONLY
Friday's Stock Market Action Hints at Further Weakness to Come Near-term

by Martin Pring,
President, Pring Research
* World Stock ETF getting closer to completing a top.
* Gold in euro and yen build on recent breakouts.
* Dollar denominated gold close to an upside breakout.
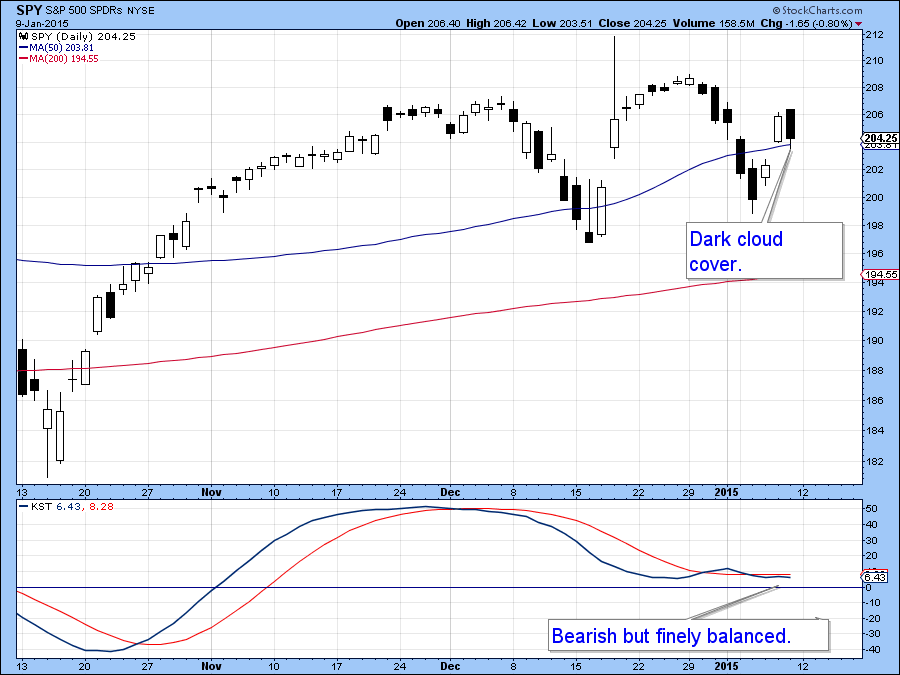
US Equities
On Friday the S & P Composite ($SPX) experienced the second day of a dark cloud cover formation, a bearish candlestick pattern....
READ MORE
MEMBERS ONLY
Sector PerfChart Shows A Defensive Start to 2015
by Arthur Hill,
Chief Technical Strategist, TrendInvestorPro.com
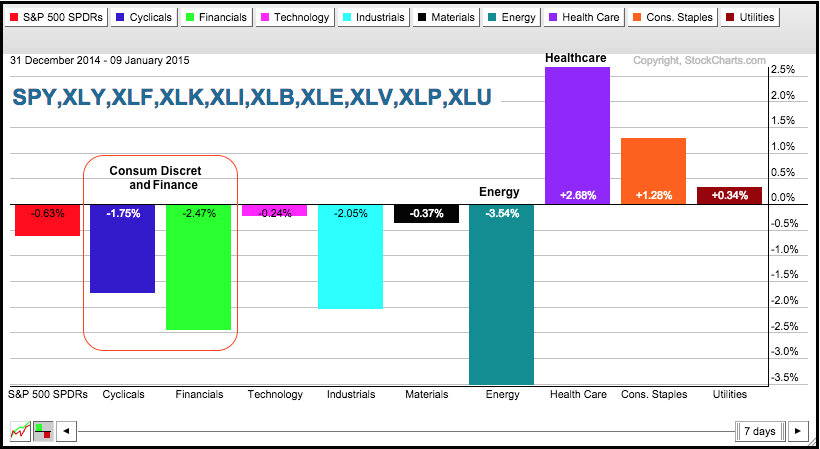
The sector PerfChart shows year-to-date performance for the nine sector SPDRs and SPY. Three sectors are up, six are down and SPY is down fractionally. The HealthCare SPDR (XLV) was the second best performing sector in 2014 and it is the best performing sector so far this year. The Energy...
READ MORE
MEMBERS ONLY
SPY and QQQ Hold Their Gaps - GLD Breaks Flag Trendline
by Arthur Hill,
Chief Technical Strategist, TrendInvestorPro.com
It was a pretty wild week as stocks plunged Monday-Tuesday, surged Wednesday-Thursday and fell back on Friday. After all the pushing and shoving, the major index ETFs ended with small losses for the week. Well, IWM lost 1.14%, which is a modest loss. Energy, industrials and finance weighed on...
READ MORE
MEMBERS ONLY
DP Weekly Update: Backing Off - January 9, 2015
by Erin Swenlin,
Vice President, DecisionPoint.com
Here's the DecisionPoint weekly view of the current market situation. After the recent bounce, price took a break and backed off today.
The purpose of the DecisionPoint Daily Update is to quickly review the day's action, internal condition, and Trend Model status of the broad market...
READ MORE
MEMBERS ONLY

MID-CAP SPDR TURNS CHOPPY, BUT MAINTAINS DIRECTIONAL BIAS -- KEY LEVELS TO WATCH FOR THE OFFENSIVE SECTOR ETFS -- DO SECTOR ROTATIONS SUPPORT THE BULLS? (RRG DEMO) -- ECONOMIC INDICATORS SHOW MORE STRENGTH THAN WEAKNESS
by John Murphy,
Chief Technical Analyst, StockCharts.com
MID-CAP SPDR TURNS CHOPPY, BUT MAINTAINS DIRECTIONAL BIAS... Link for today's video. Establishing support and resistance levels for indices and ETFs with dozens of stocks is a challenge because there are so many moving parts (stocks). Instead of exact support-resistance levels based on one chart feature, I prefer...
READ MORE
MEMBERS ONLY

My One and Only New Year's Resolution

by Gatis Roze,
Author, "Tensile Trading"
Every January, investors throughout the world pledge to improve themselves and their financial management efforts. Only a select few truly succeed in these eager commitments. Let this be your nudge to join the ranks of those select few.
In past years, I’ve often fallen into the trap of making...
READ MORE
MEMBERS ONLY
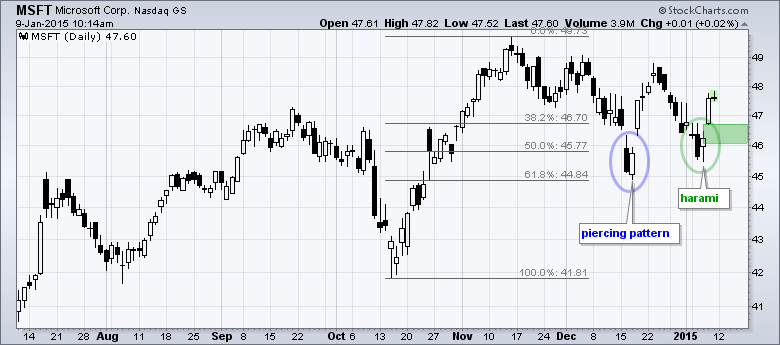
Microsoft Forms Second Candlestick Reversal in Four Weeks
by Arthur Hill,
Chief Technical Strategist, TrendInvestorPro.com
Microsoft (MSFT) sprang to life with a harami on Tuesday-Wednesday and a gap up on Thursday. This gap confirmed the harami and should be considered bullish as long as it holds. A move back below 46 would fill the gap and negate this reversal. Note that the long-term trend is...
READ MORE
MEMBERS ONLY
SPY Breaks out of Raff Channel - GLD Forms Small Flag
by Arthur Hill,
Chief Technical Strategist, TrendInvestorPro.com
It is just like mid December as SPY, IWM and QQQ fell sharply and then suddenly reversed with a two-day surge. As with mid December, traders not getting in before the gap are now stuck wondering how to play this reversal, especially with the employment report on deck this morning....
READ MORE
MEMBERS ONLY

Carl Swenlin, Overachiever
by Erin Swenlin,
Vice President, DecisionPoint.com
I thought our subscribers might appreciate a quick update on why we missed our DP Daily Update in the DP Reports blog for the first time since we started it on the old DecisionPoint website.
Yesterday morning, Carl went in for triple bypass surgery. Well, leave it to Carl to...
READ MORE
MEMBERS ONLY

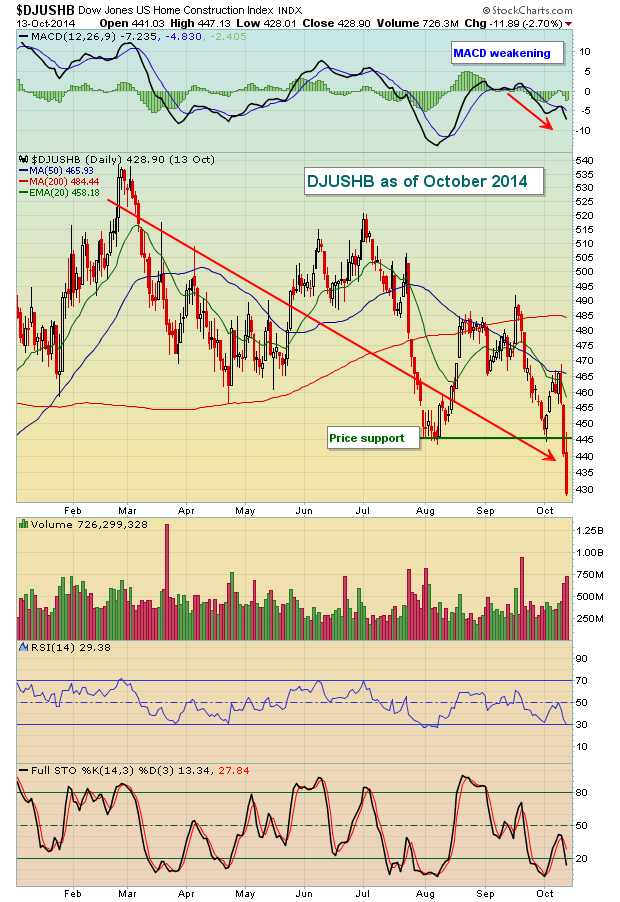
MARKET INDEXES SCORE BIG GAINS -- EUROPE GAINS EVEN MORE AND BOUNCES OFF CHART SUPPORT -- ENERGY SHARES REBOUND WITHIN MAJOR DOWNTREND -- HOMEBUILDER ETF RESUMES UPTREND
by John Murphy,
Chief Technical Analyst, StockCharts.com
STOCK INDEXES SCORE BIG GAINS... Global stocks are experiencing a nice bounce today with major U.S. stock indexes experiencing gains of nearly 2%. Chart 1 shows the Dow Industrials climbing well above its 50-day average after holding above chart support at its mid-December low. Chart 2 shows a similar...
READ MORE
MEMBERS ONLY
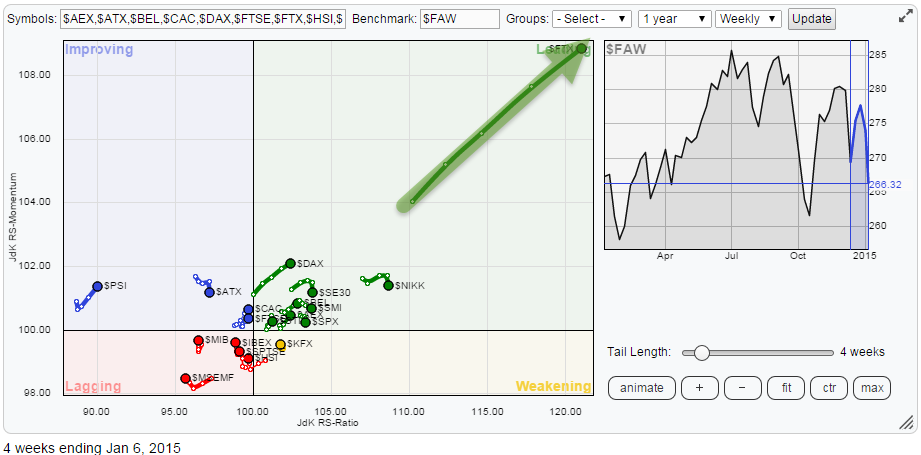
Swap Emerging Markets for something more developed

by Julius de Kempenaer,
Senior Technical Analyst, StockCharts.com
It's time to check the world again.
The Relative Rotation Graph below shows the relative positions and movement of international equity markets against the FTSE All World index. Please note that I am using $ ticker symbols for the actual indices and not the ETFs to avoid the currency...
READ MORE
MEMBERS ONLY
Oversold Bounce Materializes, but Short-Term Downtrends Remain
by Arthur Hill,
Chief Technical Strategist, TrendInvestorPro.com
Stocks finally got an oversold bounce and even closed strong. Most of the bounce occurred with a morning pop, but SPY, IWM and QQQ managed to add to these early gains. In particular, IWM got a late surge and closed near the high of the day. SPY and QQQ closed...
READ MORE
MEMBERS ONLY

NEXT DOWNSIDE TARGET FOR CRUDE OIL RANGES FROM $40 TO THE MID-$30S -- GLOBAL DEFLATIONARY PRESSURES PULL 10-YEAR TREASURY YIELD BELOW 2% -- FALLING FOREIGN CURRENCIES SHOW WEAKNESS ABROAD -- EMU ISHARES HAVE WEIGHED ON U.S. STOCKS
by John Murphy,
Chief Technical Analyst, StockCharts.com
LONGER RANGE VIEW OF CRUDE OIL ... The plunging price of oil is driving financial trends all over the world. Plunging oil is hurting energy companies that produce that commodity, as well as countries that are energy exporters. In addition, its deflationary effect is pulling global bond yields lower and contributing...
READ MORE
MEMBERS ONLY
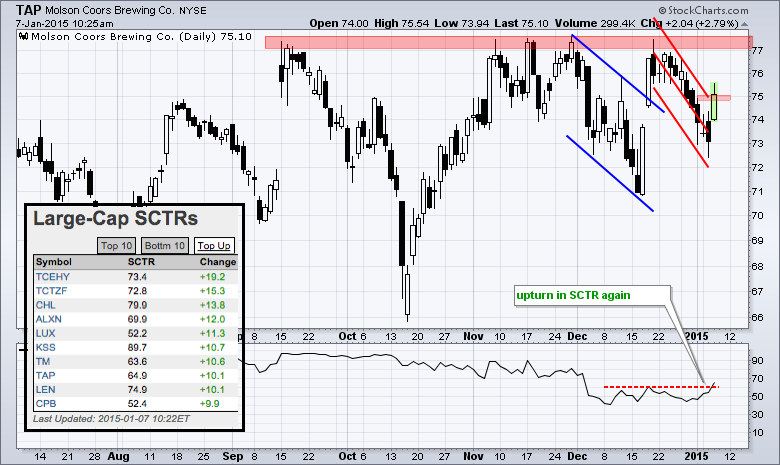
SCTR Surges for Molson Coors
by Arthur Hill,
Chief Technical Strategist, TrendInvestorPro.com
StockCharts users can view the StockCharts Technical Rank (SCTR) tables on the home page and even focus on the big movers by clicking the "top up" tab. I noticed Molson Coors (TAP) with a big move and interesting chart. The stock, which is part of the consumer staples...
READ MORE
MEMBERS ONLY
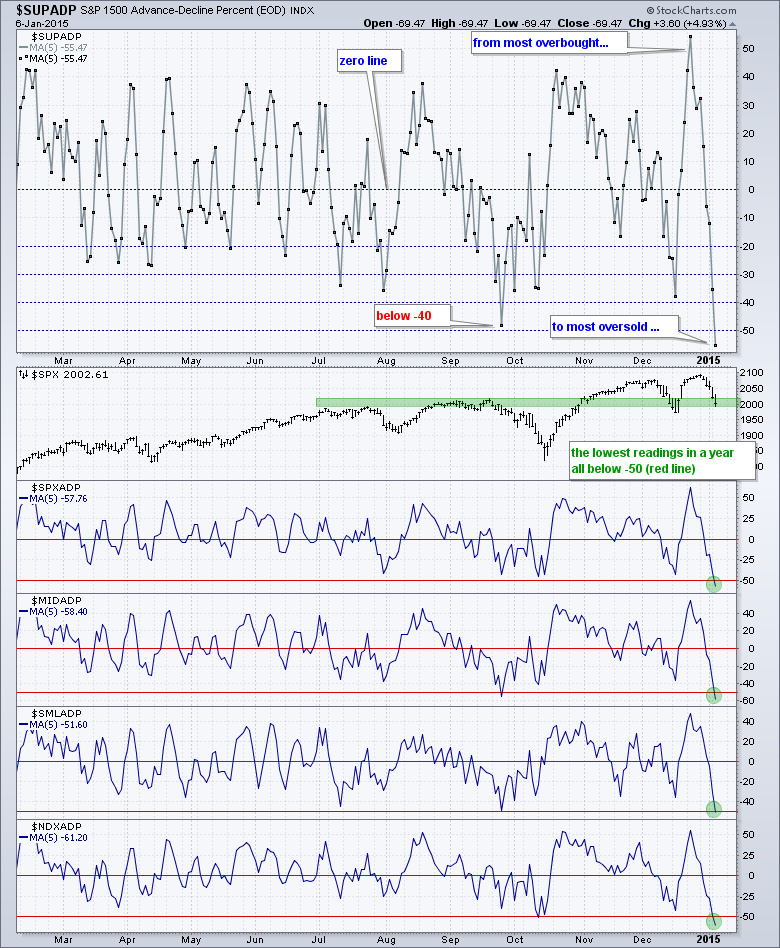
Breadth Indicators Hit Extremes on Both Sides
by Arthur Hill,
Chief Technical Strategist, TrendInvestorPro.com
Stocks took it on the chin again with small-caps leading the way lower. IWM fell 1.73%, QQQ lost 1.34% and SPY declined .94%. All three are down over 4% the last five days and short-term oversold. It was clearly a risk off day as the 20+ YR T-Bond...
READ MORE
MEMBERS ONLY

SPY CORRECTS WITHIN WELL DEFINED UPTREND -- RISK INDICATORS TURNED MIXED -- JUNK BONDS GET SLAMMED AGAIN -- TREASURY YIELDS CONTINUE TO CONVERGE -- NEW HIGHS DRY UP, BUT BREADTH REMAIN BULLISH -- UTILITIES AND FINANCE STILL LEAD SECTOR BREADTH
by John Murphy,
Chief Technical Analyst, StockCharts.com
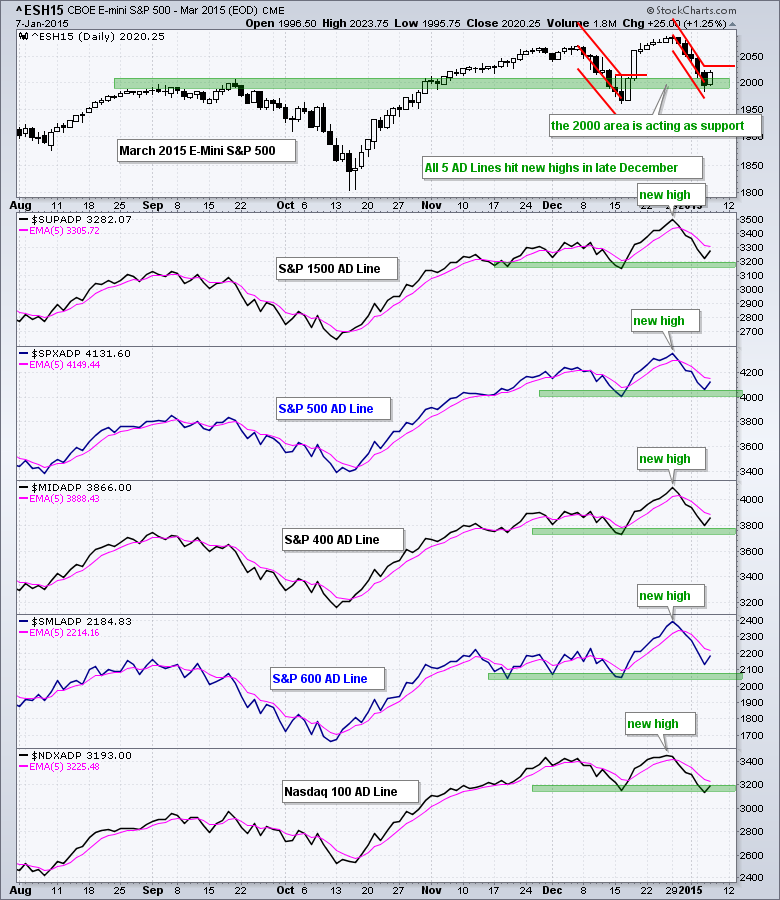
SPY AND DIA CORRECT WITHIN WELL DEFINED UPTRENDS... Stocks were hit with intense selling pressure over the last few days, but these declines have yet to turn key breadth indicators bearish or even test major support levels. Today we will look at three major index charts, some key breadth charts,...
READ MORE
MEMBERS ONLY
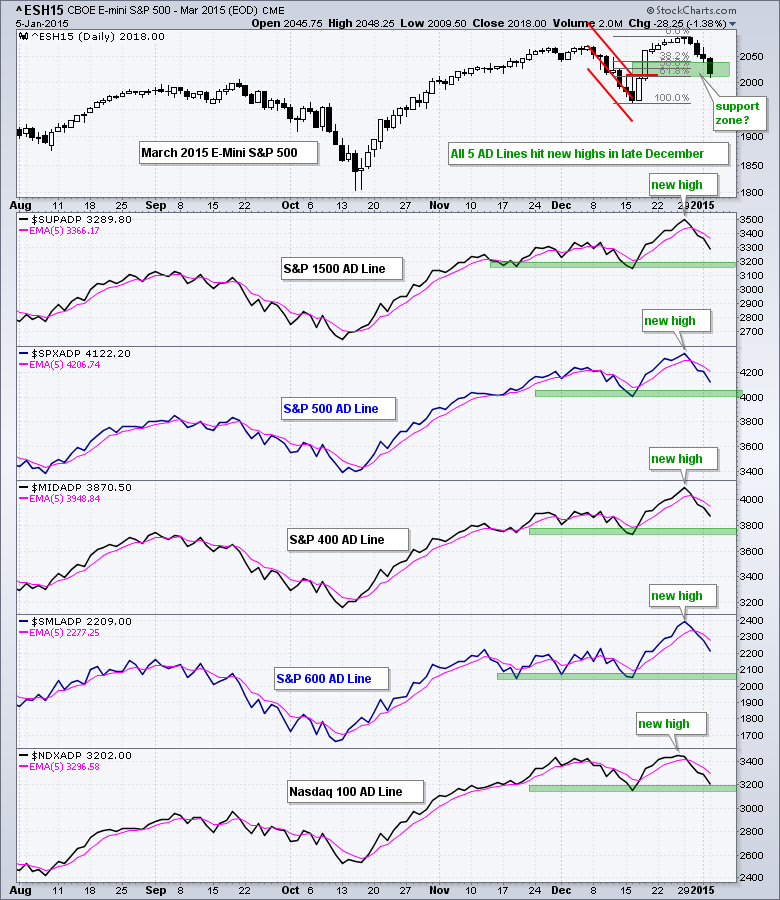
IWM Shows Relative Strength, but QQQ Shows Relative Weakness
by Arthur Hill,
Chief Technical Strategist, TrendInvestorPro.com
Stocks ended the year weak and started the year weak with Greece and oil getting most of the blame. Light Crude fell below $50 and energy stocks got hammered. European stocks plunged on fears of a Greek exit, and Japan followed suit today with a 3% decline. I am not...
READ MORE
MEMBERS ONLY

MSCI World ETF and NYSE Composite Violate their 12-month Moving Averages. Is This the Start of a Primary Bear Market?
by Martin Pring,
President, Pring Research
* Much expected Santa Rally did not happen and that’s bearish.
* MSCI Europe Australia Far East ETF right on the brink of a major breakdown.
* Small caps may have experienced a false upside breakout.
* Chinese ETF breaks out big time on both an absolute and relative basis.
In my mid-December...
READ MORE
MEMBERS ONLY
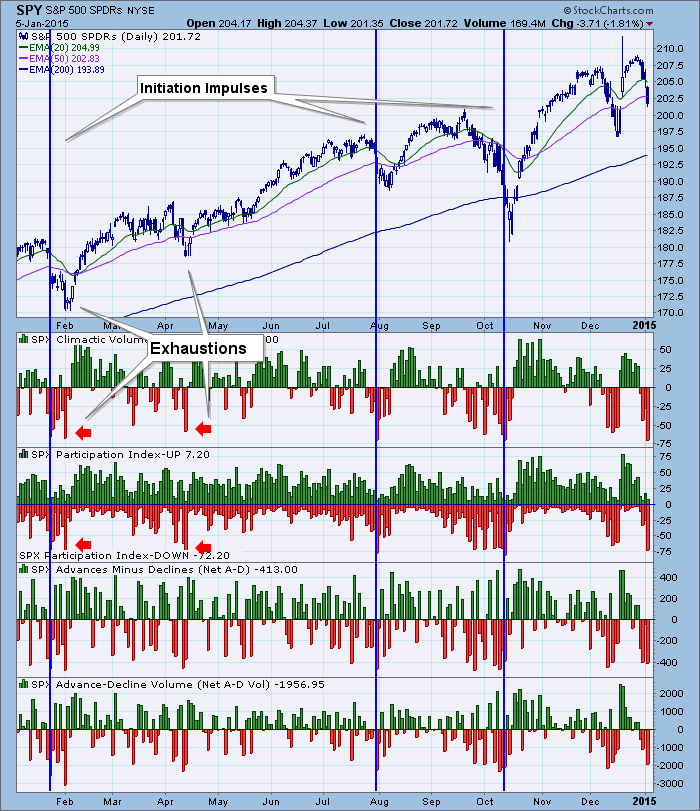
Ultra-Short-Term Initiation Impulses
by Erin Swenlin,
Vice President, DecisionPoint.com
The DecisionPoint ultra-short-term indicator suite consists of the Climactic Volume Indicator (CVI), Participation Index (PI) and Net Breadth Indicators. This indicator set exploded with very negative climactic readings today. When we see these "spikes" or "climaxes", we try to determine whether they are initiation or exhaustion...
READ MORE
MEMBERS ONLY

Do Markets Trend? Why?
by Greg Morris,
Veteran Technical Analyst, Investor, and Author
For the last couple of decades I have classified myself as a trend follower. Mind you, this is not market timing. Market timing involves guessing at tops and bottoms. A trend follower will NEVER get in at the bottom or out at the top. It depends on how quickly his/...
READ MORE
MEMBERS ONLY

OIL SINKS TO YET ANOTHER NEW LOW -- ENERGY SPDR REVERSES IN KEY RETRACEMENT ZONE -- STEEL STOCKS WEIGH ON METALS & MINING SPDR -- GOLD AND THE 2011 EUROPEAN CRISIS -- GOLD AND THE 2015 CHART -- GOLD, THE DOLLAR AND CORRELATION
by John Murphy,
Chief Technical Analyst, StockCharts.com
OIL SINKS TO YET ANOTHER NEW LOW... Link for today's video. Chart 1 shows the USO Oil Fund (USO) falling some 3% on Monday and hitting yet another new low. The pattern since August has been decline, consolidate, break down and repeat. Oil has not really bounced the...
READ MORE
MEMBERS ONLY
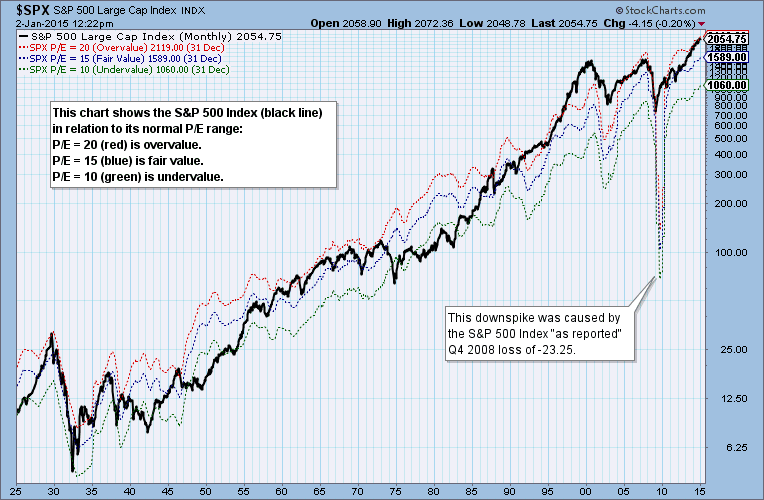
Q3 Earnings Results: Market Overvalued

by Carl Swenlin,
President and Founder, DecisionPoint.com
Standard & Poors has published preliminary S&P 500 results for the third quarter of 2014. Here is an excerpt from the DP Overview of Market Fundamentals report, which is available daily in the DP Reports Blog. We can see that, while the P/E is very close to...
READ MORE
MEMBERS ONLY
IWM Tests Top of Support Zone - GLD Turns Volatile
by Arthur Hill,
Chief Technical Strategist, TrendInvestorPro.com
Stocks got the Santa Claus rally, but it fizzled after Christmas and selling pressure took hold over the last three trading days. After a big advance from 17 to 29 December, the stock market was entitled to a pullback. The major index ETFs are now trading in big support zones...
READ MORE
MEMBERS ONLY
Looking Forward to 2015
Hello Fellow ChartWatchers!
Happy 2015! All signs point to 2015 being a very interesting year for the stock market. The long-term rally that we've had since the lows of 2009 can't continue forever, can it? Regardless of your opinion on that question, remember that StockCharts.com...
READ MORE
MEMBERS ONLY
Industrial Machinery Index Seems Poised for 2015 Rally

by Tom Bowley,
Chief Market Strategist, EarningsBeats.com
It's easy to follow the crowd and buy what keeps going higher. But generally larger gains can be found in healthy areas of the market where we've seen months of consolidation, awaiting that next breakout. As an example, it wasn't that long ago that...
READ MORE
MEMBERS ONLY
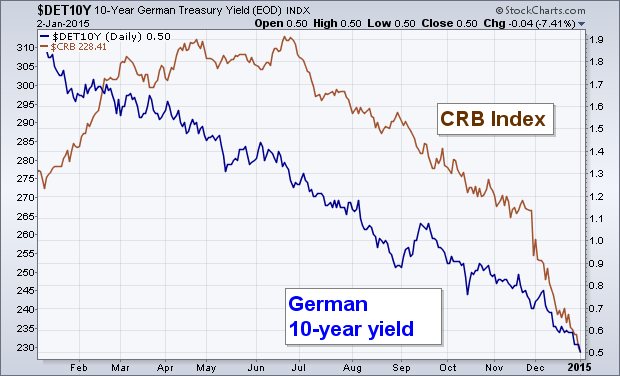
Deflationary Forces Should Hold Treasury Yield Down
by John Murphy,
Chief Technical Analyst, StockCharts.com
One of the biggest concerns for 2015 is the prospect for higher interest rates in the U.S. While it's true that the Fed may start to hike rates later in the year, that doesn't mean that bond yields will rise very much. The Fed controls...
READ MORE
MEMBERS ONLY

THE 18-YEAR REAL ESTATE CYCLE STILL HAS A LONG WAY TO GO BEFORE HITTING ANOTHER PEAK -- THE CASE-SHILLER HOME PRICE INDEX NEARS SIX-YEAR HIGH -- RISING REITS AND HOMEBUILDERS ARE LEADING INDICATORS -- WE'RE STILL IN EARLY STAGES OF REAL ESTATE UPTURN
by John Murphy,
Chief Technical Analyst, StockCharts.com
THERE IS AN 18-YEAR REAL ESTATE CYCLE ... My 2013 book entitled "Trading With Intermarket Analysis" described the existence of an 18-year real estate cycle. In other words, real estate tends to peak about every 18 years. This reliable pattern has been traced back to the 1800s. Credit for...
READ MORE
MEMBERS ONLY
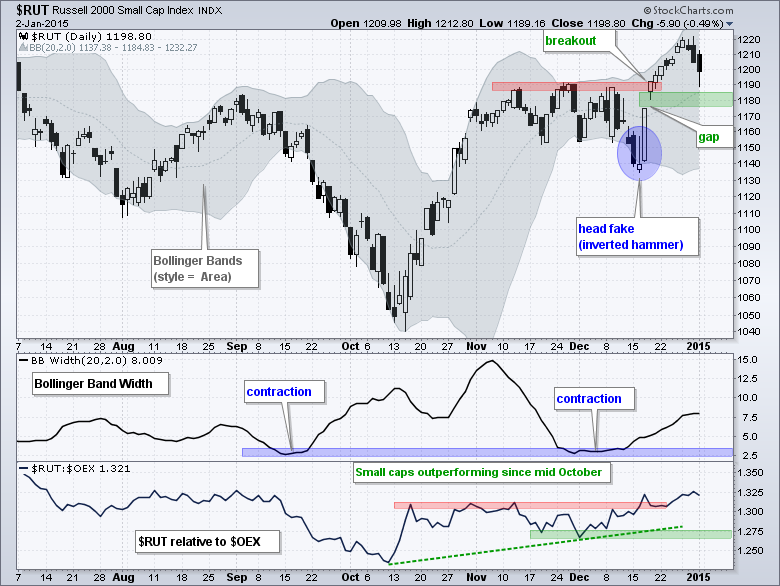
Russell 2000 Survives Bollinger Band Head Fake
by Arthur Hill,
Chief Technical Strategist, TrendInvestorPro.com
A month ago in ChartWatchers I wrote about the bullish seasonal pattern for small-caps and featured a big flag pattern on the chart for the Russell 2000 ETF. Trading turned volatile in mid December, but the bullish seasonal pattern held up and the Santa Claus rally ultimately materialized. The Russell...
READ MORE
MEMBERS ONLY
The DecisionPoint Trend Model Picture for 2015
by Erin Swenlin,
Vice President, DecisionPoint.com
Now that 2014 has drawn to a close, analysts are reviewing history and hoping to prognosticate about 2015. I'd like to review some of the DecisionPoint Trend Model charts for not just the S&P 500 (SPY), but also for the dollar, gold, oil, commodities and bonds....
READ MORE
MEMBERS ONLY
DP Weekly Update: The Pullback Continues
by Erin Swenlin,
Vice President, DecisionPoint.com
Despite the low volume of holiday trading, there was still a distinct price top that formed during the past two weeks. An ultra-short-term positive is that price broke out from overhead resistance that had formed starting Wednesday.
The purpose of the DecisionPoint Daily Update is to quickly review the day&...
READ MORE
MEMBERS ONLY
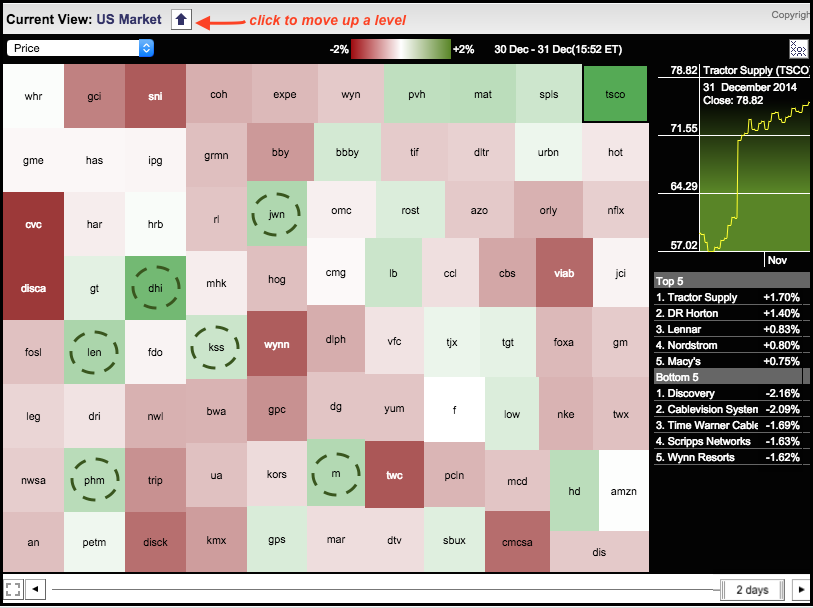
Home Construction and Retail Finish the Year Strong
by Arthur Hill,
Chief Technical Strategist, TrendInvestorPro.com
The S&P 500 took a dip on the last trading day of 2014, but several home construction and retail stocks bucked the selling pressure. Chartists can easily separate the winners and losers using the Sector Market Carpet. The image below focuses on the cyclicals (consumer discretionary) sector and...
READ MORE
MEMBERS ONLY

Champagne Toast to a Martini, Shaken Not Stirred
by Erin Swenlin,
Vice President, DecisionPoint.com
As we close out 2014 and prepare to toast in the New Year, I thought it would be interesting to research one of the companies that produces champagne. Turns out one of the largest producers of champagne and other alcoholic beverages is LVMH - Moet Hennessy Louis Vuitton (LVMUY). As...
READ MORE
MEMBERS ONLY
An Important Move is Likely for Gold and Silver in Early 2015. Here are the Chart Points to Watch
by Martin Pring,
President, Pring Research
* Dollar based gold is in a bear market.
* Yen and euro denominated gold are in primary bull markets.
* Gold shares complete a massive top.
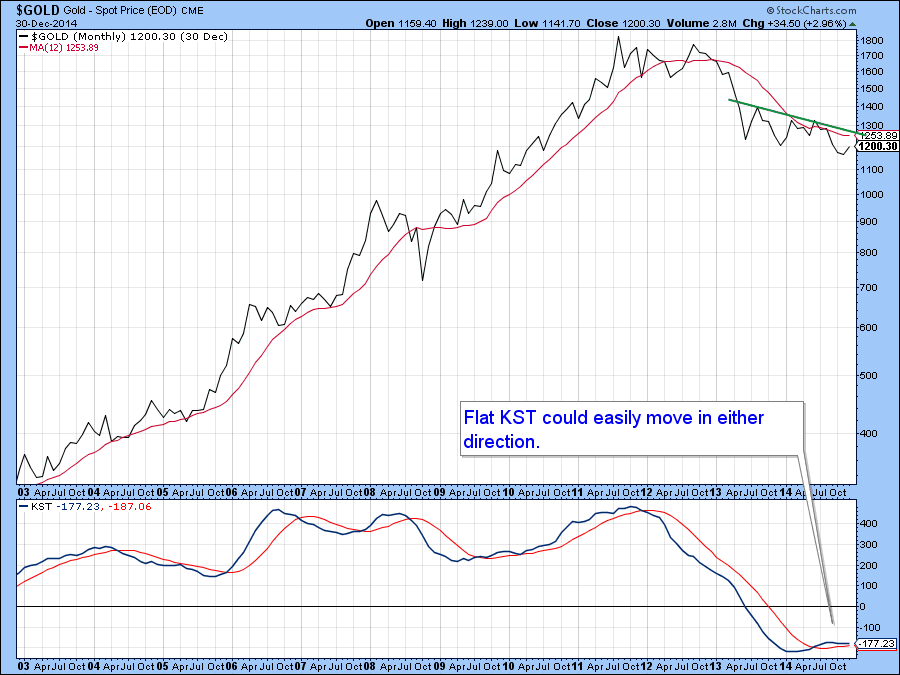
Last week we reviewed the technical picture of the major currencies. This week it is the turn of the precious metals because the finely balanced technical...
READ MORE
MEMBERS ONLY

CHINA AND INDIA ARE EMERGING MARKET WINNERS -- FALLING OIL HURTS BRAZIL AND RUSSIA -- SHANGHAI STOCKS END YEAR AT THREE YEAR HIGH -- NEW ETFS OFFER EXPOSURE TO SHANGHAI A-SHARES, BUT MAY NOT BE LIQUID ENOUGH
by John Murphy,
Chief Technical Analyst, StockCharts.com
BRIC DIVERGENCE... The year 2014 saw very diverging trends among the world's largest emerging market stocks. The lines in Chart 1 show those diverging trends among the four BRIC countries that are Brazil, Russia, India, and China. I'm using exchange traded funds here because they take...
READ MORE
