MEMBERS ONLY
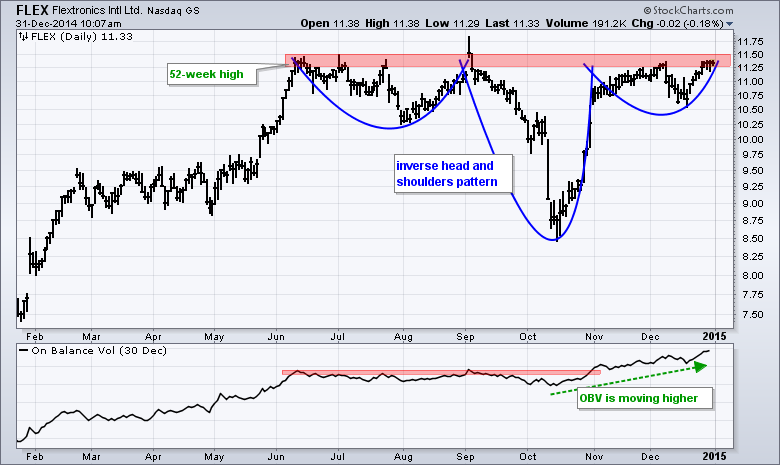
FLEX Forms Big Continuation Pattern

by Arthur Hill,
Chief Technical Strategist, TrendInvestorPro.com
Flextronics (FLEX) hit a 52-week high in June and then formed an extended consolidation that looks like an inverse head-and-shoulders pattern. It is not picture perfect, but the "essence" of the pattern is there. There is a prior uptrend, a left shoulder dip, a deeper dip for the...
READ MORE
MEMBERS ONLY

BROADCASTING AND ENTERTAINMENT INDEX HITS NEW HIGH -- MEDIA ETF BREAKS FROM MASSIVE WEDGE -- CARNIVAL AND ROYAL CARIBBEAN LIFT PEJ TO NEW HIGH -- IS CBS COMING OUT OF A BIG CORRECTION? -- BBT GETS BACK IN SYNC WITH SPY -- FITB FORMS BIG REVERSAL PATTERN

by John Murphy,
Chief Technical Analyst, StockCharts.com
BROADCASTING AND ENTERTAINMENT INDEX HITS NEW HIGH... Link for today's video. Chart 1 shows the DJ US Broadcasting and Entertainment Index ($DJUSBC) in the main window and the S&P 500 in the indicator window. Instead of using the price relative ($DJUSBC:$SPX ratio) to compare performance,...
READ MORE
MEMBERS ONLY
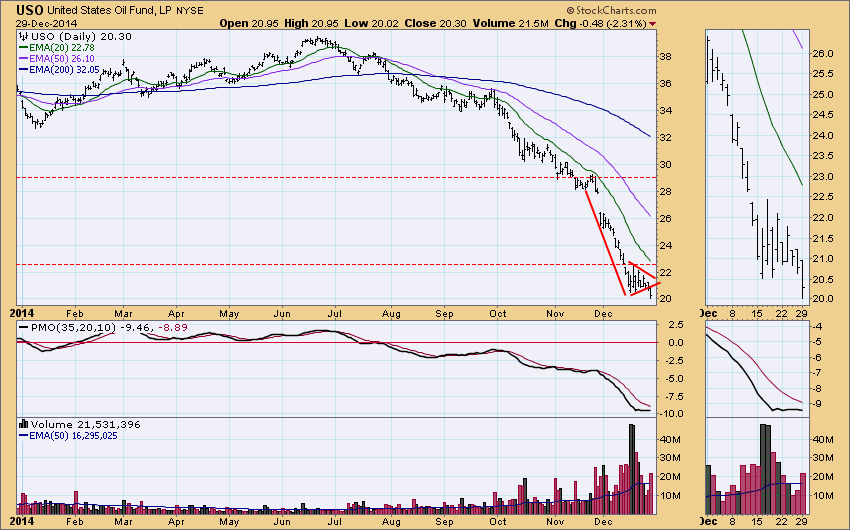
USO Breaks Down Again - TLT Surges off Support
by Arthur Hill,
Chief Technical Strategist, TrendInvestorPro.com
Stocks were mixed on Monday. The Russell 2000 iShares and S&P MidCap SPDR led with modest gains, while the Dow Diamonds and Nasdaq 100 ETF lagged with fractional losses. Consumer staples and technology were weak. Utilities and consumer discretionary were strong. The Utilities SPDR has been on a...
READ MORE
MEMBERS ONLY
Carl, Again With the Crude?!!

by Carl Swenlin,
President and Founder, DecisionPoint.com
My last two articles have been about crude oil, so I thought I should give it a rest, but as I cast about for possible topics for a new article, crude is still the most interesting to me. Actually, it seems as though it is still interesting to our readers...
READ MORE
MEMBERS ONLY

IWM AND IJR SCORE NEW HIGHS -- FINANCIALS LEAD SMALL-CAPS HIGHER -- SMALL AND MID CAP AD LINES LEAD -- SECTOR AD LINES SHOW BROAD STRENGTH -- UTILITIES AND FINANCE LEAD HIGH-LOW RANKING
by John Murphy,
Chief Technical Analyst, StockCharts.com
IWM AND IJR SCORE NEW HIGHS... Link for today's video. Barring a big plunge the next few days, small-caps are going out with a bang this year. Small-caps lagged the broader market throughout 2014 because the Russell 2000 iShares (IWM) and the S&P SmallCap iShares (IJR)...
READ MORE
MEMBERS ONLY
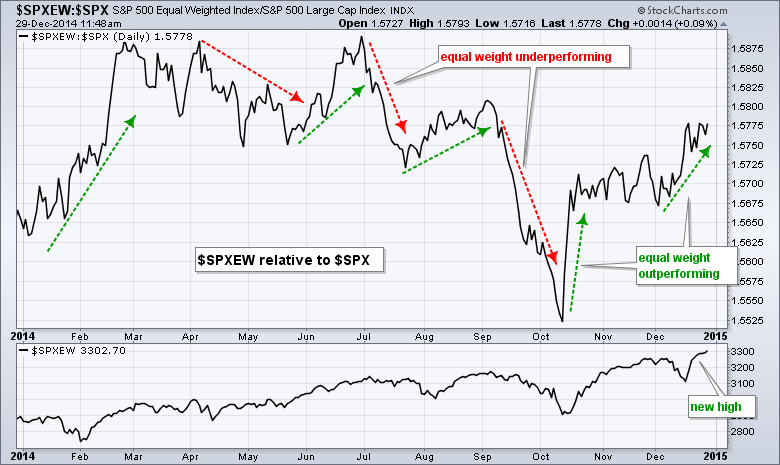
Equal-weight S&P 500 Outperforming Cap-weight S&P 500
by Arthur Hill,
Chief Technical Strategist, TrendInvestorPro.com
The chart below shows the ratio of the S&P 500 Equal-Weight Index to the S&P 500 ($SPXEW:$SPX). Also known as the price relative, this ratio chart compares the performance of the S&P 500 Equal-Weight Index to the S&P 500. $SPXEW outperforms...
READ MORE
MEMBERS ONLY
Stocks Outperforming Bonds - GLD Gets Oversold Bounce
by Arthur Hill,
Chief Technical Strategist, TrendInvestorPro.com
Stocks continued higher in slow trading last week, which is pretty typical for yearend price action. The existing trend is up and prices extend in the direction of the existing trend, but in a much slower manner. Even though it is hard to read into low-volume price movements during a...
READ MORE
MEMBERS ONLY
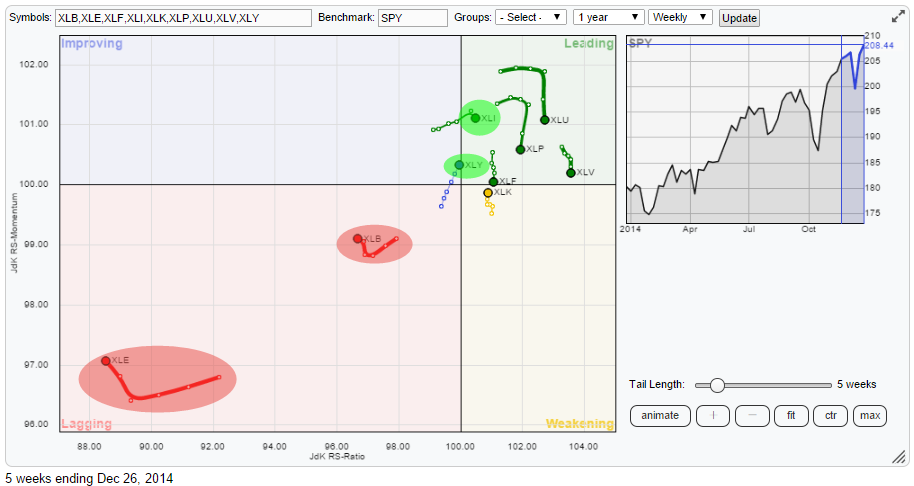
Avoid Materials and Energy

by Julius de Kempenaer,
Senior Technical Analyst, StockCharts.com
It's sector rotation time again!
For those of you who haven't noticed it by now. I am (trying to) maintain some sort of subject-rotation in my blogs as well.... The subjects being; Asset Class rotation, (US) Sector rotation, International equity markets rotation, and (DOW 30) Individual...
READ MORE
MEMBERS ONLY
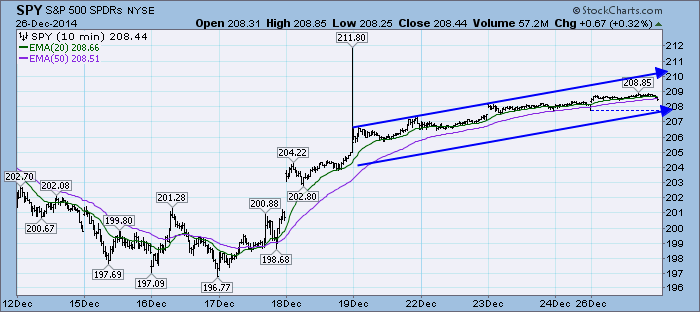
DP Weekly Update - December 26, 2014

by Erin Swenlin,
Vice President, DecisionPoint.com
In general, price has been consolidating in a slightly elevated trend. The holiday week has been uneventful as far as market action, although we did see a Price Momentum Oscillator (PMO) crossover on the SPY.
The purpose of the DecisionPoint Daily Update is to quickly review the day's...
READ MORE
MEMBERS ONLY
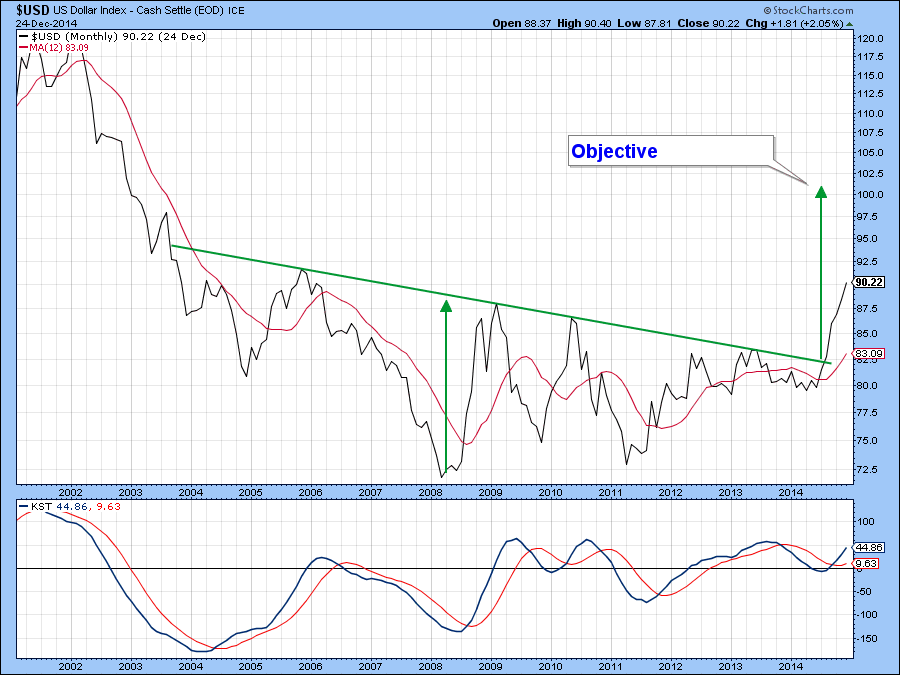
End Of The Year Dollar Index Review

by Martin Pring,
President, Pring Research
* Long-term dollar rally likely to continue.
* Yuan on the edge of a breakdown.
* January is tied with November as the most bullish month for the dollar.
* Short-term dollar momentum overstretched but re-accelerating to the upside.
Currencies
At the end of August the US Dollar Index ($USD) broke out from a...
READ MORE
MEMBERS ONLY
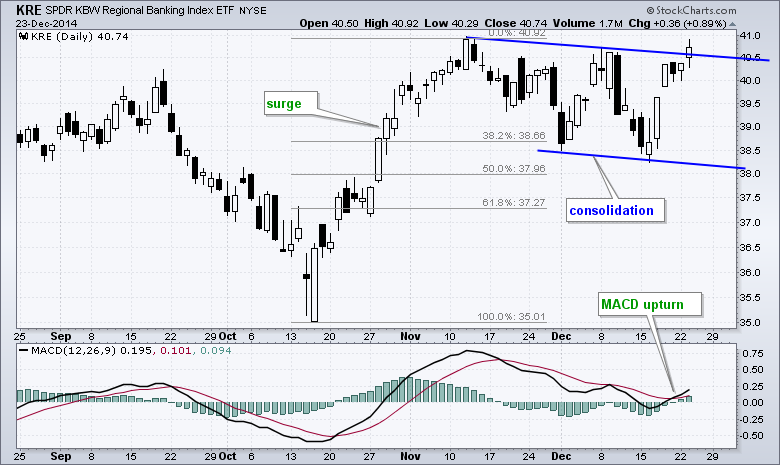
Regional Bank SPDR Goes for a Breakout
by Arthur Hill,
Chief Technical Strategist, TrendInvestorPro.com
The Regional Bank SPDR (KRE) is showing potential with a break above the flag trend line. Notice how the ETF surged and then corrected with the falling flag. This correction alleviated overbought conditions from mid November and the breakout signals a continuation of the prior surge. The indicator window shows...
READ MORE
MEMBERS ONLY

SOME NEW AND CONTINUING THEMES FOR 2015 -- SHORT-TERM T-YIELDS RISE AND HALF NORMALIZE -- EURO MOVES CLOSER TO PARITY -- SMALL-CAPS LEAD THE MARKET -- XLF AND IAI TARGET 2007 HIGH -- XLE CONFIRMS LARGE REVERSAL PATTERN
by John Murphy,
Chief Technical Analyst, StockCharts.com
SOME NEW AND CONTINUING THEMES FOR 2015... Today's Webinar will look at long-term charts to extrapolate some themes to consider in 2015. This written commentary shows most of the Webinar charts with some brief notes. Tune into the Webinar for full details. Every so often we get a...
READ MORE
MEMBERS ONLY
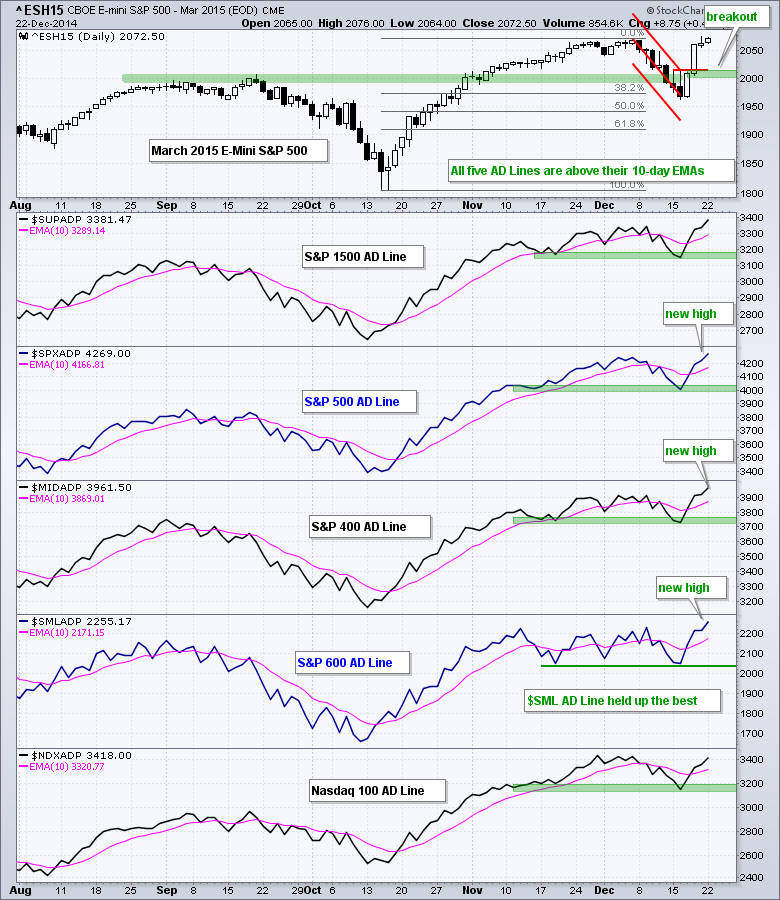
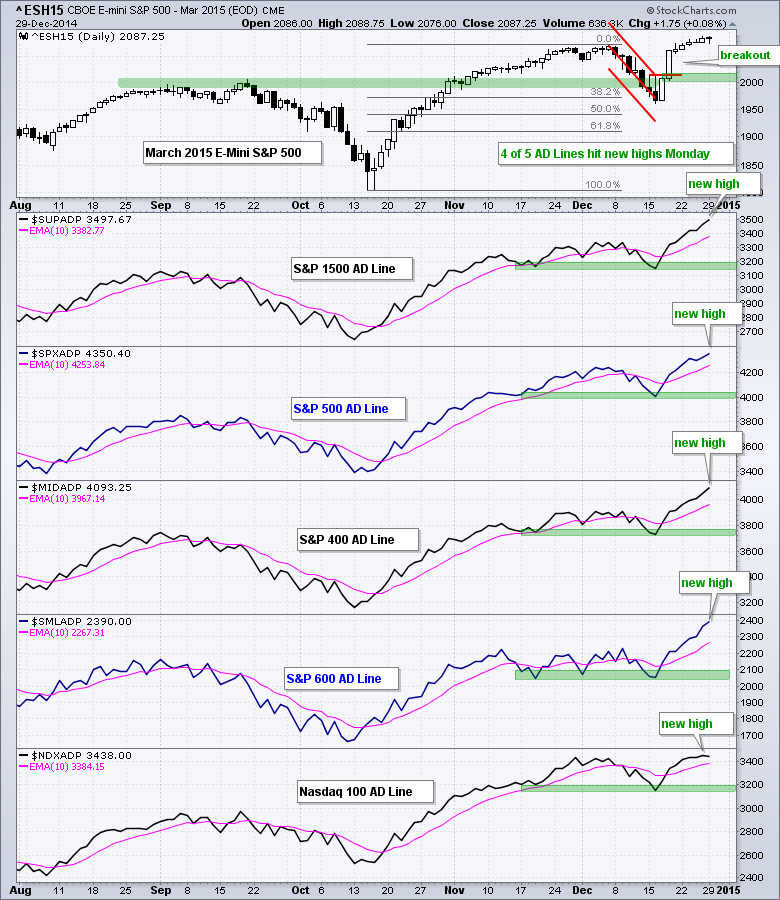
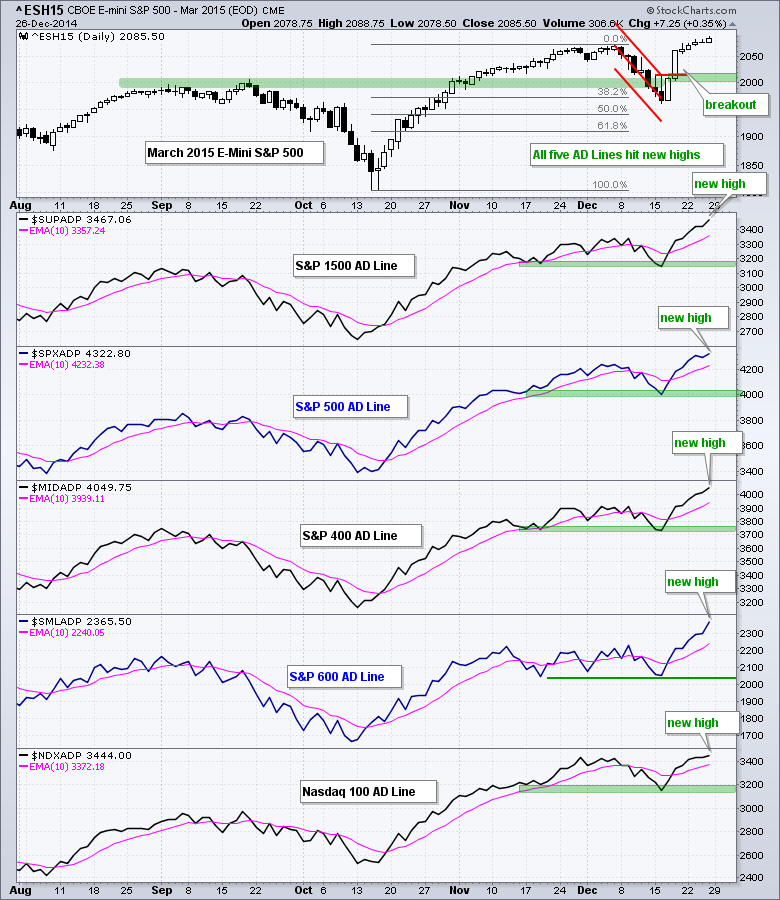
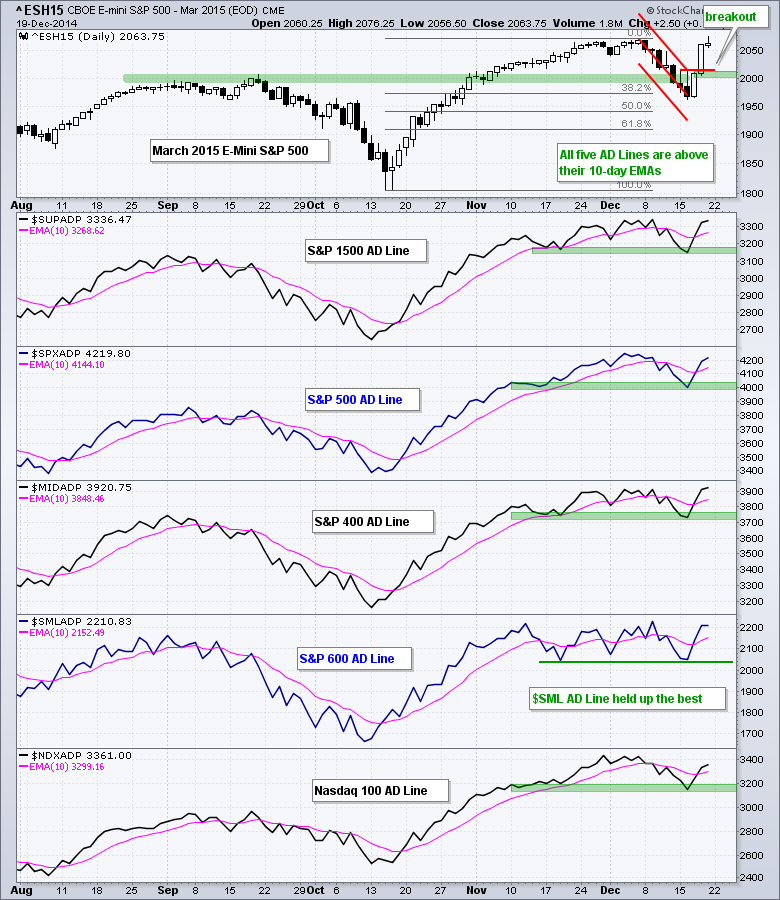
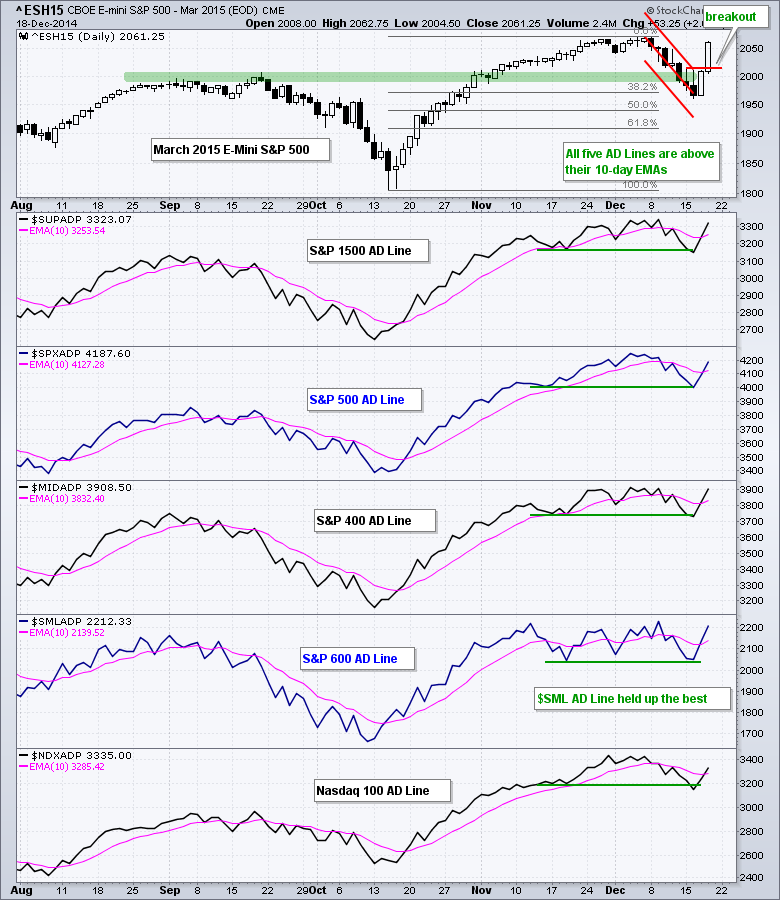
Four AD Lines Hit New Highs - GLD Breaks Down Further
by Arthur Hill,
Chief Technical Strategist, TrendInvestorPro.com
Programming note: I will be taking off the rest of the week and Art's Charts will return on Monday, December 29th. Have a great Christmas holiday! It was a mixed day on Wall Street with QQQ closing fractionally higher and IWM closing fractionally lower. Energy and healthcare led...
READ MORE
MEMBERS ONLY
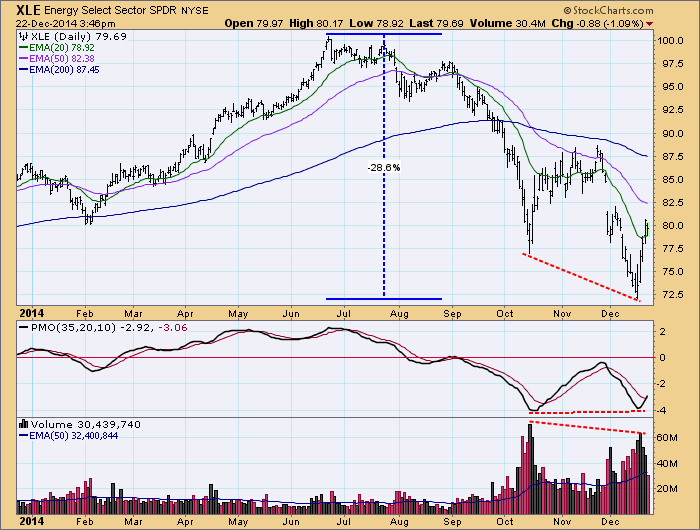
Energy Rebound Suspicious
by Carl Swenlin,
President and Founder, DecisionPoint.com
A few weeks ago we looked at the possibility that the Energy SPDR (XLE) was setting up for a double bottom, which, unfortunately did not happen. More recently it has rallied strongly off the low of the XLE bear market, with a PMO positive divergence and contracting volume at the...
READ MORE
MEMBERS ONLY
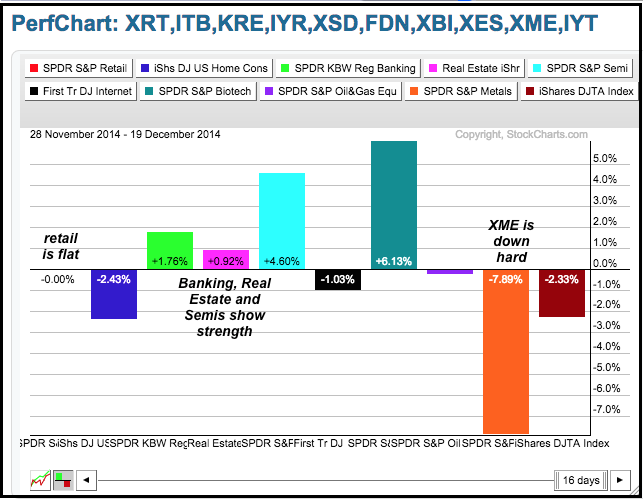
Three Leading Industry Group ETFs for December
by Arthur Hill,
Chief Technical Strategist, TrendInvestorPro.com
December has been one mixed up month. The Nasdaq 100 ETF (QQQ) is down around 1.1%, the Russell 2000 iShares (IWM) is up around 2% and the S&P 500 SPDR (SPY) is up .30%. We can also see mixed results when looking at the Performance for 10...
READ MORE
MEMBERS ONLY

S&P MIDCAP INDEX FORMS BIG CONTINUATION PATTERN -- EQUAL-WEIGHT STARTS OUTPERFORMING CAP-WEIGHT -- SMALL-CAP FINANCE AND TECH SECTORS HIT NEW HIGHS -- SEMICONDUCTOR SPDR EXTENDS STRONG UPTREND -- CAVIUM AND RF MICRO LEAD SEMIS
by John Murphy,
Chief Technical Analyst, StockCharts.com
S&P MIDCAP INDEX FORMS BIG CONTINUATION PATTERN... Link for today's video. Chart 1 shows the S&P MidCap 400 hitting a new high at the beginning of July and then forming a large consolidation the last six months. Actually, the index hit another all time...
READ MORE
MEMBERS ONLY
MidCap AD Line Leads - GLD Holds Break Down
by Arthur Hill,
Chief Technical Strategist, TrendInvestorPro.com
Stocks started the week with selling pressure, but the bulls found their footing on Wednesday and produced a strong two-day surge. The Russell 2000 iShares (+3.65%) and Russell MicroCap iShares (+4.09%) led the charge and both have been outperforming the S&P 500 SPDR (SPY) this month....
READ MORE
MEMBERS ONLY
US Stocks End Week on a Strong Note
by John Murphy,
Chief Technical Analyst, StockCharts.com
A combination of factors pushed U.S. (and global) stocks sharply higher during the second half of the week. One big factor was the Wednesday Fed statement that it would be "patient" in raising rates next year. Another was a bounce in a very oversold oil market late...
READ MORE
MEMBERS ONLY
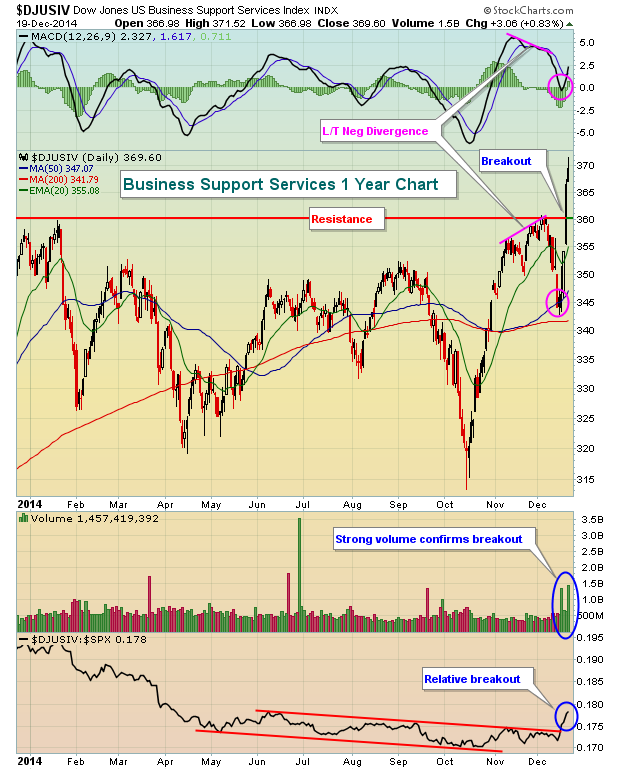
Business Support Services Index Breaks Out After Long Base

by Tom Bowley,
Chief Market Strategist, EarningsBeats.com
Stock market action played out the past two weeks almost perfectly according to historical plan. In my last article, I discussed the bearish tendencies of equities from December 7th through December 15th and the S&P 500 promptly lost 85 points, or more than 4% during this period in...
READ MORE
MEMBERS ONLY

ENERGY SHARES LEAD U.S. STOCKS HIGHER -- SMALL CAPS BREAKOUT -- FOREIGN STOCKS ALSO BOUNCE ON FIRMER CRUDE PRICE -- SO DO HIGH YIELD BONDS -- OIL SERVICE STOCKS BOUNCE FROM DEEP OVERSOLD CONDITION AND MAJOR SUPPORT
by John Murphy,
Chief Technical Analyst, StockCharts.com
US STOCKS END WEEK ON A STRONG NOTE... A combination of factors pushed U.S. (and global) stocks sharply higher during the second half of the week. One big factor was the Wednesday Fed statement that it would be "patient" in raising rates next year. Another was a...
READ MORE
MEMBERS ONLY

Creating a Workflow ChartList
by Erin Swenlin,
Vice President, DecisionPoint.com
With the release of several DecisionPoint ChartPacks (to learn more about them and how to install them click here), many users have expressed that they are overwhelmed by the quantity of quality indicator charts. This is not news to me, we had the same feedback from new users to the...
READ MORE
MEMBERS ONLY
Why a StockCharts.com Membership is More Valuable in 2014 Than It Has Ever Been
Hello Fellow ChartWatchers!
Stocks rose this past week with the large-, mid-, and small-cap S&P indexes all finishing up around 3.2%. For the year, the S&P 500 is up over 12%, the mid-caps are up 7.98% and the small-caps are up only 3%; however...
READ MORE
MEMBERS ONLY
Two Nasdaq 100 Stocks With RS and Bullish Price Action
by Arthur Hill,
Chief Technical Strategist, TrendInvestorPro.com
Chartists can improve their odds by looking for stocks that show relative strength and bullish price action. It is a two-pronged approach that has stood the test of time. I use relative strength to narrow the field and then look for charts with bullish signals. The first image shows a...
READ MORE
MEMBERS ONLY
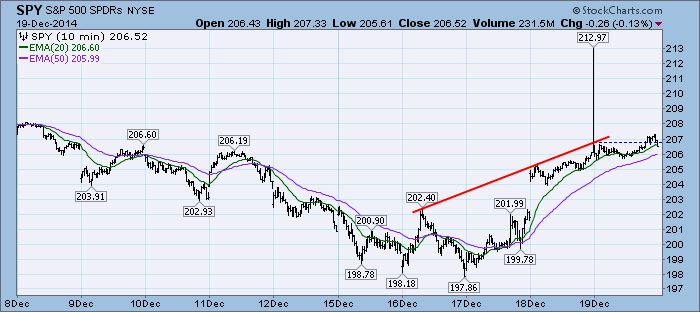
DP Weekly Update: Market Digests Rally on Options Expiration - December 19, 2014
by Erin Swenlin,
Vice President, DecisionPoint.com
After two days of a strong rally, the market paused today, likely digesting the big move. Additionally, we usually see flat market action on options expiration days accompanied by high volume. The strange spike from the last 10 minutes yesterday held up so it wasn't a mistake.
The...
READ MORE
MEMBERS ONLY

MICRO-CAPS TAKE THE LEAD ON RELATIVE ROTATION GRAPH -- MICROCAP ETF BREAKS BIG CHANNEL -- HIGH-LOW PERCENT INDICATORS WHIP BACK TO BULLISH -- MINDING THE GAPS -- UTILITY ETFS BREAK OUT ACROSS THE BOARD -- SYMBOLS FOR SECTOR ETFS
by John Murphy,
Chief Technical Analyst, StockCharts.com
MICRO-CAPS TAKE THE LEAD ON RELATIVE ROTATION GRAPH ... Link for today's video. Small-caps, mid-caps and micro-caps are starting to show some relative strength. John Murphy noted that the January effect was boosting small-caps as the Russell 2000 started outperforming the Russell 1000 recently. We can also see an...
READ MORE
MEMBERS ONLY

Only the 58 Navigators Matter

by Gatis Roze,
Author, "Tensile Trading"
Of the approximately 6,000 stars visible to the naked eye, only 58 are considered navigator stars. Since antiquity, these essential stars have guided mankind to many new horizons. This wisdom came to me on a brokerage house Holiday card.
If you have ever stood atop a mountain at night...
READ MORE
MEMBERS ONLY
QQQ and SPY Gap thru Resistance - TLT Tumbles
by Arthur Hill,
Chief Technical Strategist, TrendInvestorPro.com
Stocks continued higher with a broad advance that lifted most boats - again. The two-day surge in SPY is the biggest since 2011 and the two day decline in TLT is the largest since November 2013. Clearly, money moved out of the Treasury market and found its way into the...
READ MORE
MEMBERS ONLY

"Tracking" Investment Opportunities
by Erin Swenlin,
Vice President, DecisionPoint.com
We all want to find the best available investment opportunities, but sometimes it isn't that easy. With the market turning around and a bottom forming on the recent correction, many are looking for a way to get in. A great scan can help, but if you are in...
READ MORE
MEMBERS ONLY

TRADERS ARE BUYING IN ANTICIPATION OF YEAREND SANTA CLAUS RALLY -- JANUARY EFFECT STARTS BOOSTING SMALL CAPS IN MID-DECEMBER -- WE'RE NOW IN THE SWEET SPOT OF THE MIDTERM ELECTION CYCLE -- AND FOREIGN STOCKS ARE REBOUNDING
by John Murphy,
Chief Technical Analyst, StockCharts.com
SANTA CLAUS RALLY IS STILL AHEAD ... The stock market is benefiting from a number of seasonal trends which should last well into the new year. For one thing, the month of November starts the "best three months" span that lasts into January, and the "best six months&...
READ MORE
MEMBERS ONLY
Small-Caps Lead Broad Market Advance
by Arthur Hill,
Chief Technical Strategist, TrendInvestorPro.com
Stocks moved sharply higher with a broad advance that lifted most boats. The Russell MicroCap iShares (IWC) and Russell 2000 iShares (IWM) led the charge with 3+ percent moves. As noted on Monday-Tuesday, small-caps have been outperforming in December and small-cap breadth was holding up better than large-cap breadth. Relative...
READ MORE
MEMBERS ONLY

MARKET LIKES FED INTENTION TO STAY PATIENT -- OVERSOLD ENERGY STOCKS LEAD GLOBAL STOCK RALLY -- XLE IS ALSO IN POTENTIAL SUPPORT ZONE-- US STOCK INDEXES REGAIN 50-DAY LINE -- CANADIAN STOCKS BOUNCE SHARPLY OFF OCTOBER LOW
by John Murphy,
Chief Technical Analyst, StockCharts.com
STOCKS AND BOND YIELDS JUMP... The Fed promised to remain "patient" in raising rates next year. Stocks liked the news, Treasuries didn't. Fixed income yields rose with the bigger gains in the shorter end of the yield curve. Chart 1 shows the 5-Year T-Note Yield ($FVX)...
READ MORE
MEMBERS ONLY
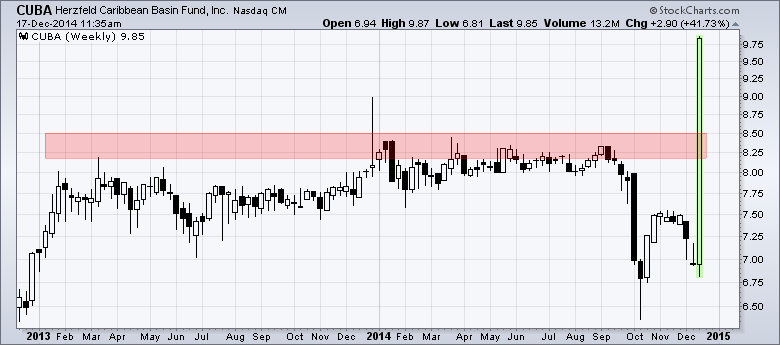
Caribbean Fund Surges to Multi-year High
by Arthur Hill,
Chief Technical Strategist, TrendInvestorPro.com
Cuba is in the news today on the announcement that the US and Cuba will start talks to normalize ties. What does Cuba have to do with a Technical Analysis website? Well....I was looking at the most actives on the Nasdaq and saw CUBA with a 40+ percent gain...
READ MORE
MEMBERS ONLY
Equities still Look Vulnerable Notwithstanding a Possible Reflexive Bounce
by Martin Pring,
President, Pring Research
* Dichotomy in the credit markets is extending.
* Dim Sum bonds at a critical juncture.
* Gold asset markets weakening again.
US Equities
Statistics tell us that December is the most bullish month of the year for equities. Interestingly, the November-January period offers the best performing consecutive months of the year (S&...
READ MORE
MEMBERS ONLY
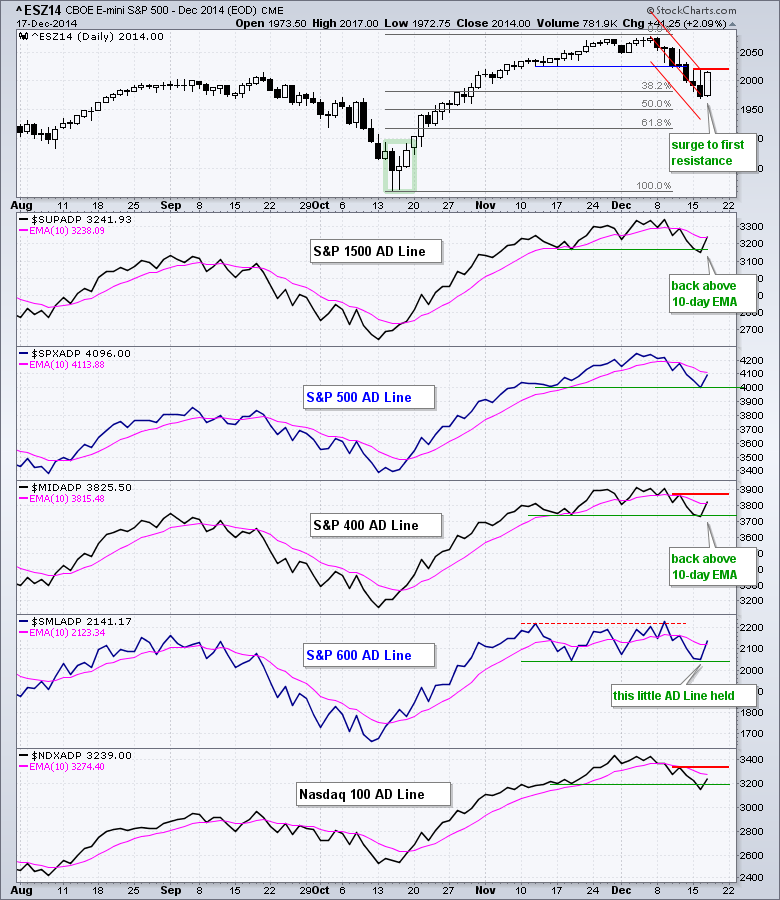
IWM Holds Up Better than SPY - TLT Hits New High
by Arthur Hill,
Chief Technical Strategist, TrendInvestorPro.com
The S&P 500 is less than 6% from its all time high and the Nasdaq 100 is less than 7% below its all time high. While the December decline looks dramatic on its own and the short-term trend is down, keep in mind that the major index ETFs...
READ MORE
MEMBERS ONLY

WEBINAR CHARTS -- RISK ON OR RISK OFF? -- PUTTING A 5% DECLINE INTO PERSPECTIVE -- HIGH-LOW PERCENT INDICATORS REMAIN BULLISH -- HIGH-LOW PERCENT FOR XLI TURNS BEARISH -- SHORT-TERM BREADTH REMAINS BEARISH -- GOLD, OIL, DOLLAR AND BONDS
by John Murphy,
Chief Technical Analyst, StockCharts.com
WEBINAR CHARTS... The charts below are from Tuesday's Webinar and include some basic commentary. See the webinar recording for more details. I also covered eleven stocks (AAPL, ORCL, CSCO, BAC, UTX, EOG, CIEN, JSDU, UPS, CHRW, JBHT). There was a demo showing the different ways to measure relative...
READ MORE
MEMBERS ONLY
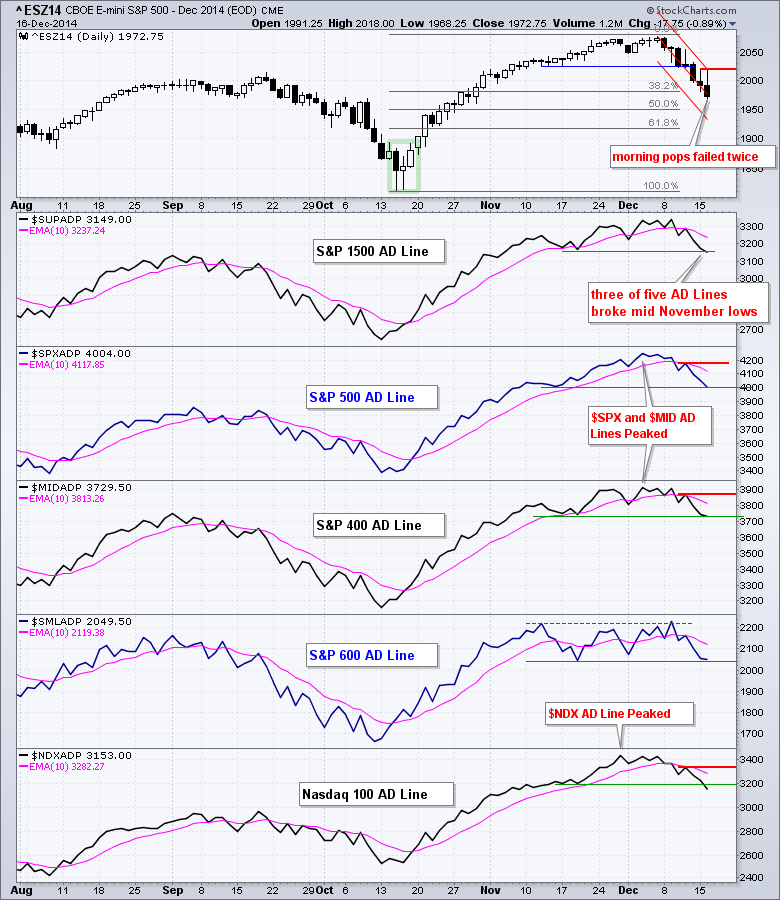
IWM and QQQ Join SPY with Support Breaks
by Arthur Hill,
Chief Technical Strategist, TrendInvestorPro.com
Even though correlation is not always causation, selling pressure extended in stocks and oil got the blame. Light Crude Futures (^CLF15) fell another 3+ percent and hit $55.02 on the low. Stocks, and oil, got an early bounce Monday morning, but buying pressure soon dissipated and prices turned lower....
READ MORE
MEMBERS ONLY
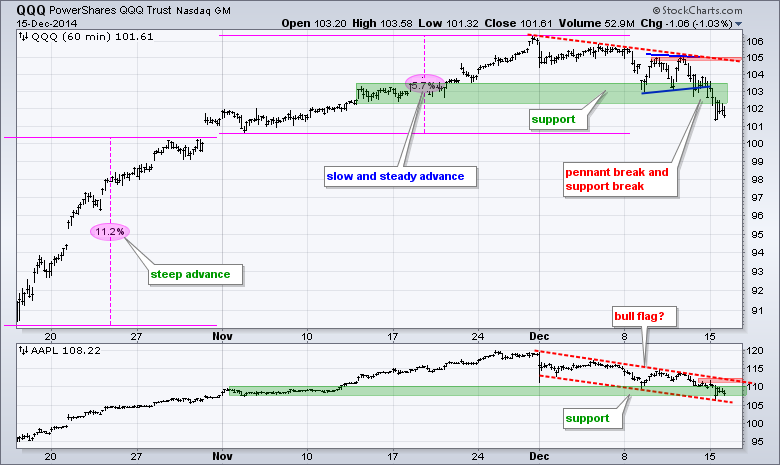
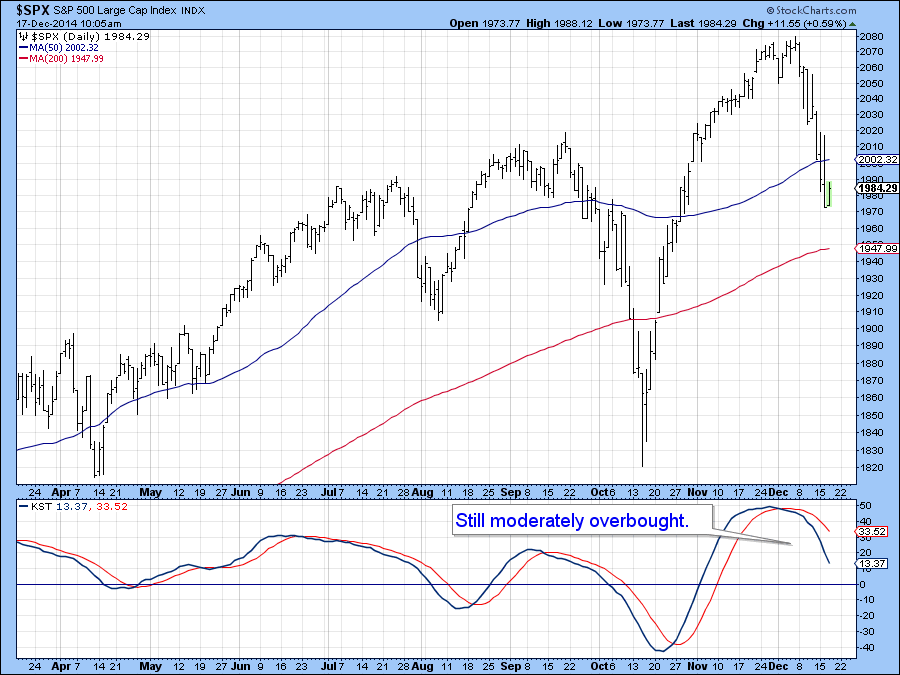
IWM and QQQ Break Support - GLD Breaks Channel Line
by Arthur Hill,
Chief Technical Strategist, TrendInvestorPro.com
QQQ broke pennant support on Friday and continued below 102 on Monday to break its support zone. The early December trend line and last week's highs mark resistance at 105. Apple continues to work its way lower and I am marking resistance at 112.
**************************************************************
IWM is still holding...
READ MORE
MEMBERS ONLY
Relatively Rock Solid Real-Estate
by Julius de Kempenaer,
Senior Technical Analyst, StockCharts.com
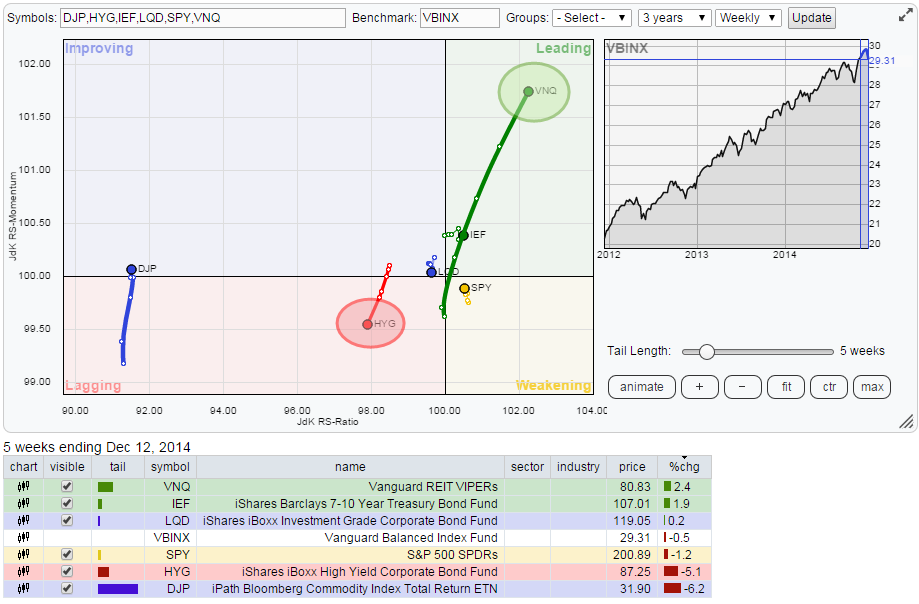
The Relative Rotation Graph below holds a number of ETFs that represent various asset classes while using VBINX (Vanguard Balanced Index Fund) as the benchmark.
For sure that long fat green tail on VNQ catches my attention...
In my last blog on asset class rotation I mentioned in the conclusions...
READ MORE
MEMBERS ONLY
Several Consumer Discretionary Stocks are Bucking the Market
by Arthur Hill,
Chief Technical Strategist, TrendInvestorPro.com
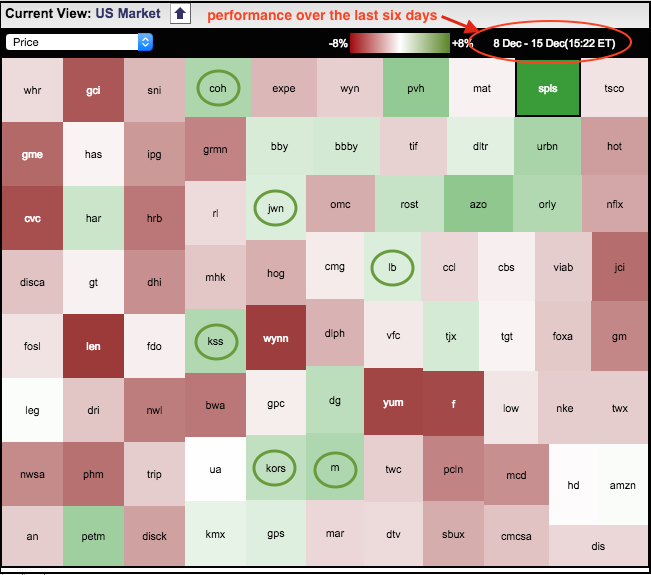
The S&P 500 was hit pretty hard over the last six days with all nine sectors losing ground. There were, however, some pockets of strength in the consumer discretionary. The Sector Market Carpet shows performance for the consumer discretionary sector since last Monday, 8-December. Over a dozen green...
READ MORE
MEMBERS ONLY
Price Relative to Moving Averages: Decline Not Over
by Carl Swenlin,
President and Founder, DecisionPoint.com
One of our favorite analysis methods is to compare price to one of its moving averages. It is not infallible, but it is thoroughly objective. In particular we track stocks in relation to their 20EMA, 50EMA, and 200EMA because that gives us views of the short, medium, and long term....
READ MORE
