MEMBERS ONLY

HIGH-LOW PERCENT SURGES ACROSS THE BOARD -- FINANCE SECTOR LEADS OFFENSIVE SECTOR BREADTH -- MATERIALS AND ENERGY SHOW WEAKEST BREADTH -- CRUDE OIL CONSOLIDATION EVOLVES -- GASOLINE SLIGHTLY OUTPERFORMS CRUDE -- PALLADIUM HOLDS UP BETTER THAN GOLD

by John Murphy,
Chief Technical Analyst, StockCharts.com
HIGH-LOW PERCENT SURGES ACROSS THE BOARD... Link for today's video. Chartists can use High-Low Percent to measure participation in a market move and compare the degree of participation. High-Low Percent equals the difference between 52-week highs and new 52-week lows divided by the total number of stocks in...
READ MORE
MEMBERS ONLY
Stocks Overbought, but Still Strong - USO Extends Consolidation

by Arthur Hill,
Chief Technical Strategist, TrendInvestorPro.com
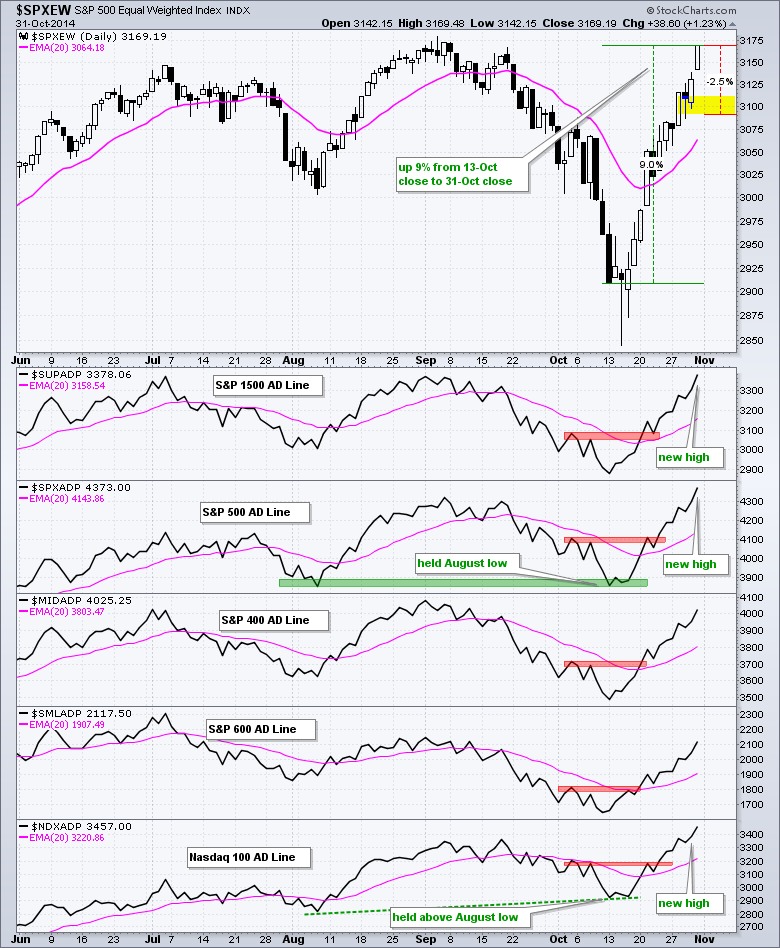
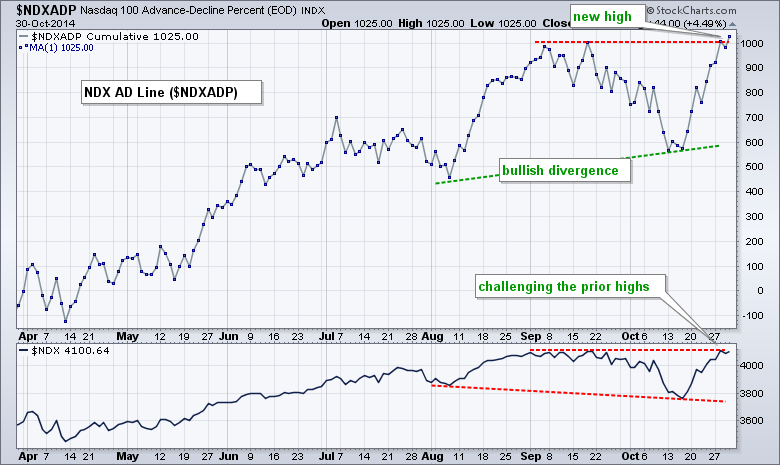
Breadth behind the most recent advance was quite strong as the AD Lines for the S&P 500, S&P 1500 and Nasdaq 100 recorded new highs. Of these three, notice that the S&P 500 AD Line held its August low and the Nasdaq 100 AD...
READ MORE
MEMBERS ONLY
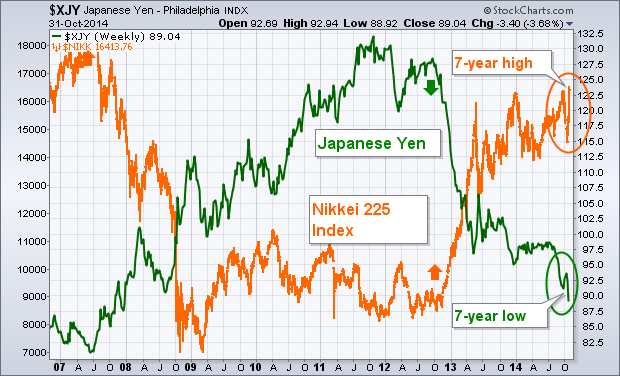
Japan Announces Big Jump in Asset Buying
by John Murphy,
Chief Technical Analyst, StockCharts.com
Japanese authorities surprised everyone on Friday by increasing their already aggressive bond purchases (QE) by a third. In addition, it will expand those purchases to include stocks and real estate investments. The Japanese pension fund also announced that it will increase its allocation to domestic and foreign stocks. That gave...
READ MORE
MEMBERS ONLY
Is The Latest Breakout A Trick or Treat?

by Tom Bowley,
Chief Market Strategist, EarningsBeats.com
First, let me say Happy Halloween to all! It's an exciting time for many, but especially the children. I know our neighborhood is always buzzing with kids anticipating the sugarfest! :-)
Unfortunately, the stock market bears were SPOOKED on Halloween this year. I've said for months...
READ MORE
MEMBERS ONLY

BIG MOVE BY JAPAN PUSHES GLOBAL STOCKS SHARPLY HIGHER -- THE PLUNGING YEN PUSHES JAPANESE STOCKS TO SEVEN-YEAR HIGH -- DOW RECORD HIGH CONFIRMS TRANSPORTATION BREAKOUT -- S&P 500 HITS RECORD CLOSE AS SMALL CAPS JUMP
by John Murphy,
Chief Technical Analyst, StockCharts.com
JAPAN ANNOUNCES BIG JUMP IN ASSET BUYING... Japanese authorities surprised everyone on Friday by increasing their already aggressive bond purchases (QE) by a third. In addition, it will expand those purchases to include stocks and real estate investments. The Japanese pension fund also announced that it will increase its allocation...
READ MORE
MEMBERS ONLY
Array of New Highs Reflects Broad Market Strength
by Arthur Hill,
Chief Technical Strategist, TrendInvestorPro.com
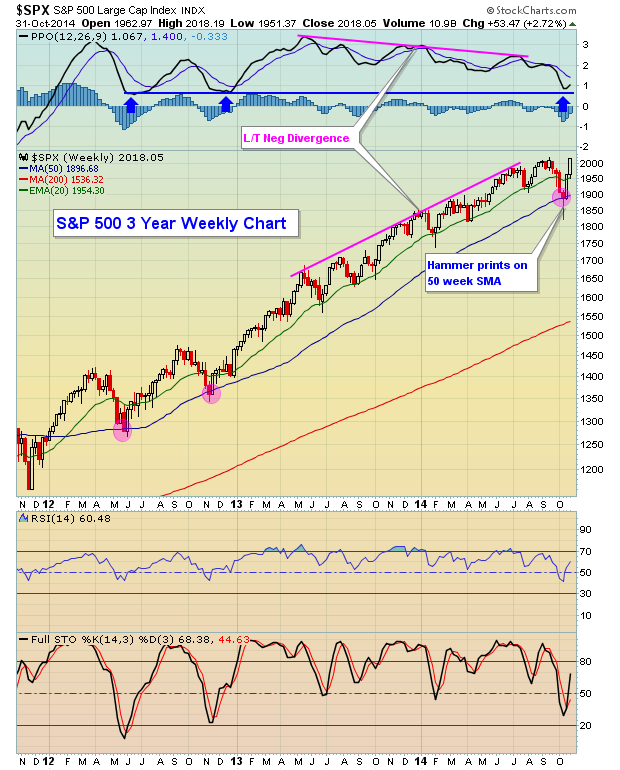
Not every index and not every sector recorded a new high this week, but several key indexes recorded new highs and the majority of sectors hit new highs. This shows broad market strength that validates the long-term uptrend in stocks. The only negative is that stocks are short-term overbought after...
READ MORE
MEMBERS ONLY

Six-Month Seasonality Turns Favorable

by Erin Swenlin,
Vice President, DecisionPoint.com
With the end of October, which is sometimes referred to as "Black October", six-month seasonality switches from Bearish to Bullish. You'll find our seasonality table in the DP Reports blog on the DP Alert Daily Report. You'll see the section extracted below:
This is...
READ MORE
MEMBERS ONLY
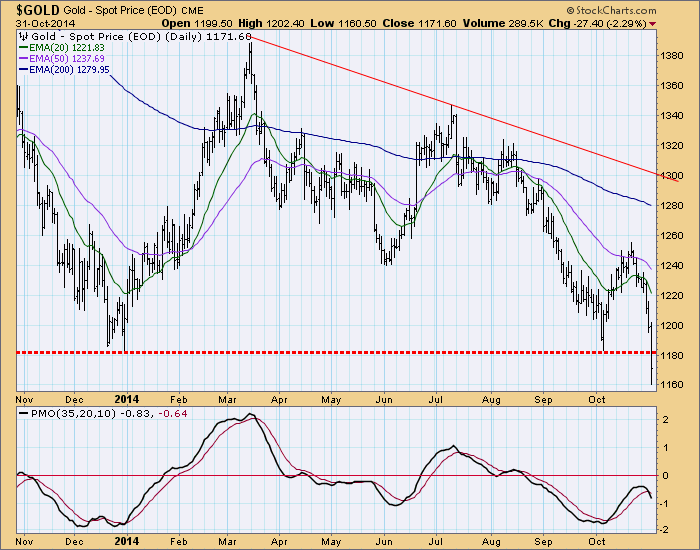
GOLD: Support Fails

by Carl Swenlin,
President and Founder, DecisionPoint.com
We have been watching gold for a possible triple bottom, a base for the next strong rally. Earlier this month gold bounced off an important support line, offering hope to gold bulls that the third bottom in the series would be successful. However, the price of gold has slipped badly...
READ MORE
MEMBERS ONLY
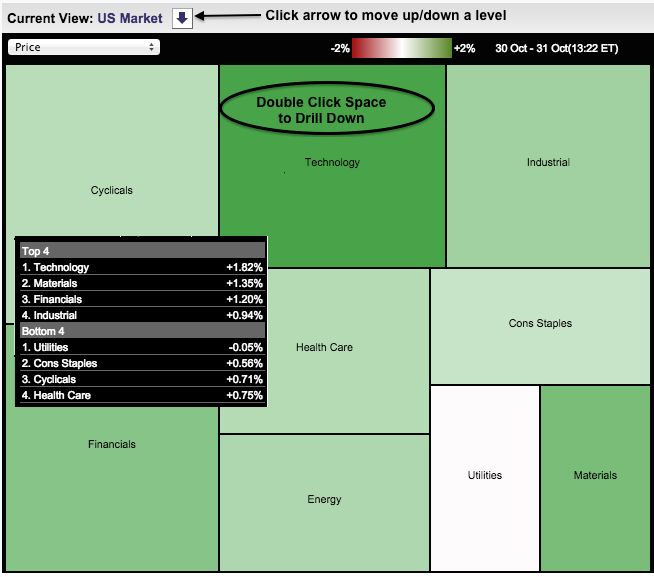
Sector Carpet Shows a Preference for Risk
by Arthur Hill,
Chief Technical Strategist, TrendInvestorPro.com
Stocks moved sharply higher on Friday with the Technology sector leading and the Utilities sector lagging. As the Market Carpet shows, the average utilities stock is down .05% and the average technology stock is up 1.82%. This shows a preference for higher risk stocks (offense). Notice that the tech...
READ MORE
MEMBERS ONLY

S&P 500 RECLAIMS 2K -- SMALL-CAPS RIP HIGHER -- SEASONALITY FAVORS SMALL-CAPS (LIVE DEMO) -- SHORT-TERM TREASURY YIELDS SURGE -- FINANCE SECTOR LEADS WITH NEW HIGH -- PUTTING RECENTLY VOLATILITY INTO PERSPECTIVE
by John Murphy,
Chief Technical Analyst, StockCharts.com
S&P 500 RECLAIMS 2K... Link for today's video. Stocks may be short-term overbought and some of the indices may be near their prior highs, but the trends are up and the breadth indicators are bullish. These short-term overbought conditions could give way to a pullback or...
READ MORE
MEMBERS ONLY

Definition of Money Management

by Gatis Roze,
Author, "Tensile Trading"
Google “money management” and you’ll get back a quagmire of non-sequiturs, disjointed, inconsistent and incomplete information. There is no single comprehensive definition. There isn’t even any number of consistently similar definitions. Yet what do most Market Wizards disclose as one of the keys to their success: money management....
READ MORE
MEMBERS ONLY
QQQ Continues to Lead - USO Remains in a Trading Range
by Arthur Hill,
Chief Technical Strategist, TrendInvestorPro.com
The major index ETFs notched another gain with the Dow Diamonds (DIA) leading the way (+1.30%). The gains in the other major index ETFs were, however, modest. Stock futures are pointing sharply higher after the Bank of Japan announced another round of quantitative easing. The European Central Bank (ECB)...
READ MORE
MEMBERS ONLY
Inflation Hedge Assets Continue to Break to the Downside (Video)

by Martin Pring,
President, Pring Research
* Outside day hints that the short-term downtrend for bonds may be over.
* Dollar Index may be completing an inverse head and shoulders.
* Stronger dollar forces gold to test its lows.
* Stronger dollar causes gold to break down from a 2-year trading range.
Here is a link to the the text...
READ MORE
MEMBERS ONLY

Inflation Hedge Assets Continue to Break to the Downside
by Martin Pring,
President, Pring Research
* Outside day hints that the short-term downtrend for bonds may be over.
* Dollar Index may be completing an inverse head and shoulders.
* Stronger dollar forces gold to test its lows.
* Stronger dollar causes gold to break down from a 2-year trading range.
Here is a link to the video version...
READ MORE
MEMBERS ONLY
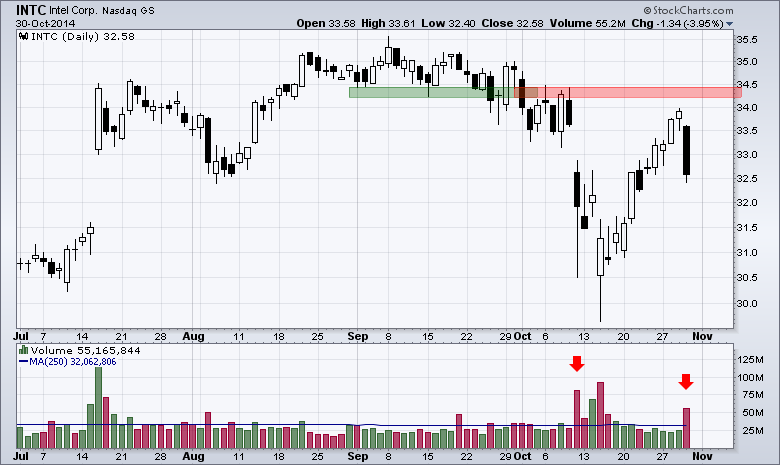
Intel Gaps Down to Lead Semis Lower
by Arthur Hill,
Chief Technical Strategist, TrendInvestorPro.com
Intel (INTC) weighed on the semiconductor group Thursday with a gap down and high volume decline. The chart below shows the stock reversing near broken support, which turned into resistance. This is classic technical analysis: broken support turns first resistance and broken resistance turns first support....
READ MORE
MEMBERS ONLY
Dollar Extends Breakout, Gold Extends Break Down, Plus CSCO, IMAX, MON, PEP and PLCE
by Arthur Hill,
Chief Technical Strategist, TrendInvestorPro.com
Stocks turned mixed as the Fed nixed quantitative easing. While I do not think this is the reason for mixed trading, the end of QE provides a good excuse for a rest. Stocks went on a tear the last two weeks and the market is entitled to a breather at...
READ MORE
MEMBERS ONLY

Announcing the NEW "DP Weekly Update"!
by Erin Swenlin,
Vice President, DecisionPoint.com
For those of you who don't know, I publish a DP Daily Update in the DP Reports blog. Everyday I analyze the same charts to give you continuity and the opportunity to truly understand our premier market indicators. Along with the S&P 500, I review '...
READ MORE
MEMBERS ONLY
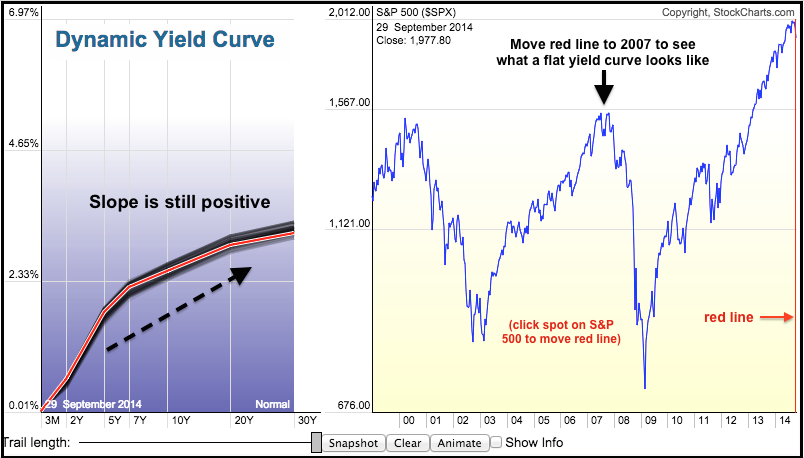
Never mind QE, the Yield Curve Reflects a Dovish Fed
by Arthur Hill,
Chief Technical Strategist, TrendInvestorPro.com
The end of QE may be on the table, but the yield curve shows that the Fed remains dovish overall. The image below comes from the Dynamic Yield Curve. Notice that short-term yields are the lowest and the yields rise as the maturities extend. This is a "normal"...
READ MORE
MEMBERS ONLY

MARKET INDEXES BREAK MORE RESISTANCE BARRIERS -- SMALLER STOCKS SHOW RELATIVE STRENGTH -- BREADTH FIGURES ALSO SHOW IMPROVEMENT -- BUT DEFENSIVE STOCKS STILL SHOW MARKET LEADERSHIP -- TREASURIES SLIDE AS HIGH YIELD BONDS JUMP
by John Murphy,
Chief Technical Analyst, StockCharts.com
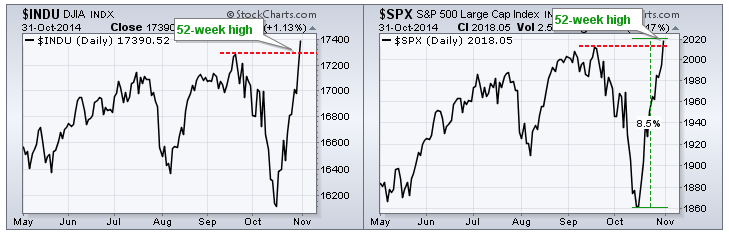
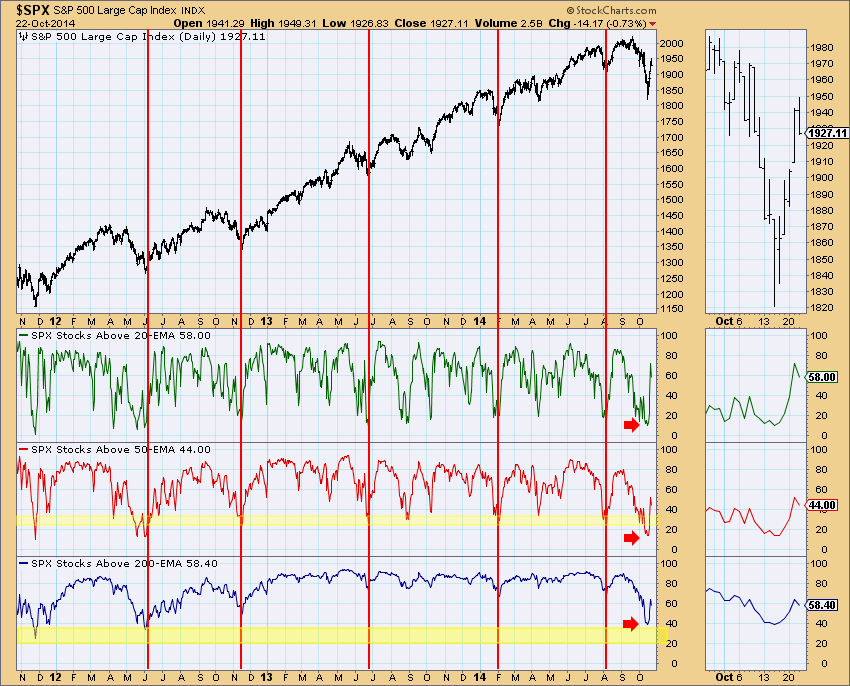
S&P 500 HITS NEW OCTOBER HIGH ... The S&P 500 reflects continued improvement in the stock market's short-term trend. The daily bars in Chart 1 show the SPX climbing above its 50-day moving average (blue line) and chart resistance at its early October intra-day peak...
READ MORE
MEMBERS ONLY
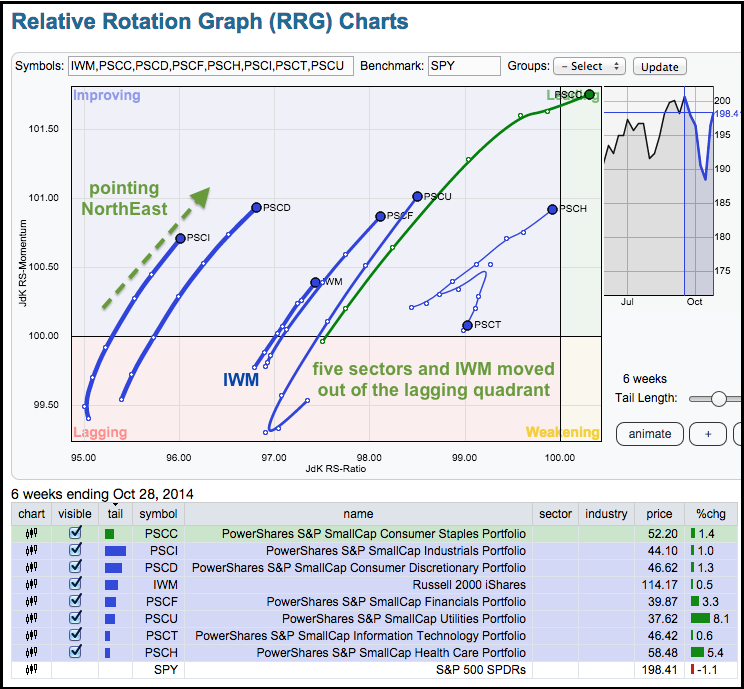
Small-Cap Sectors Make a Move on the Relative Rotation Graph
by Arthur Hill,
Chief Technical Strategist, TrendInvestorPro.com
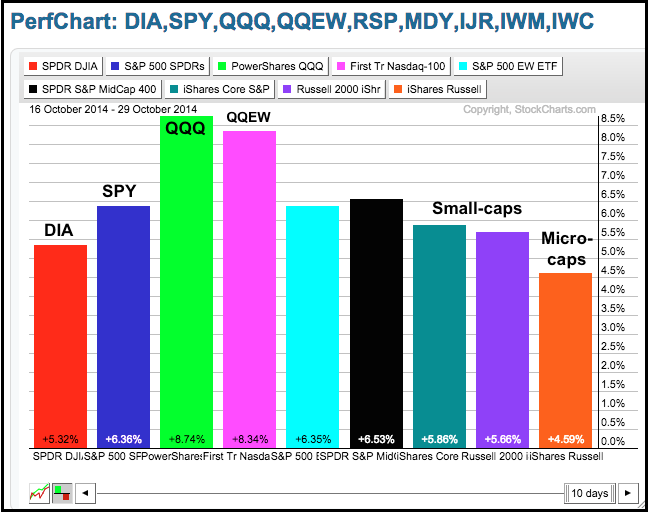
Stocks moved higher again on Tuesday with small-caps and micro-caps leading the charge. The Russell 2000 iShares gained 2.85% and the Russell MicroCap iShares was up over 3%. Keep in mind that it only takes a small rotation to move the needle for small-caps. The S&P 500...
READ MORE
MEMBERS ONLY

Bullish Flags are Waving
by Erin Swenlin,
Vice President, DecisionPoint.com
Today I ran my regular scan to find stocks or ETFs that are rising on fresh momentum. (The scan is listed at the bottom of this blog article.) The results were very interesting as nearly half of the charts showed bullish flag formations. These formations are short-term continuation patterns that...
READ MORE
MEMBERS ONLY
Additional and Necessary Information about Market Breadth (CGMBI)

by Greg Morris,
Veteran Technical Analyst, Investor, and Author
As I dive further into updating “The Complete Guide to Market Breadth Indicators,” I want to ensure I have laid the groundwork for a solid introduction to breadth before writing about the book’s contents. Additionally I have decided to include an occasional article about other subjects in technical analysis...
READ MORE
MEMBERS ONLY

VIX TRIGGERS THIRD SIGNAL OF 2014 -- KRE AND IWM CHALLENGE ANOTHER SUPPORT BREAK -- SOME REFINERS SHOW RELATIVE STRENGTH WITHIN ENERGY SECTOR -- TESORO AND PHILLIPS BOUNCE OFF KEY RETRACEMENTS -- REFINERS ON THE RELATIVE ROTATION GRAPH
by John Murphy,
Chief Technical Analyst, StockCharts.com
VIX TRIGGERS THIRD SIGNAL OF 2014... Link for today's video. The S&P 500 Volatility Index ($VIX) is largely a coincident indicator that rises when the S&P 500 falls and falls when the S&P 500 rises. As with the S&P 500,...
READ MORE
MEMBERS ONLY
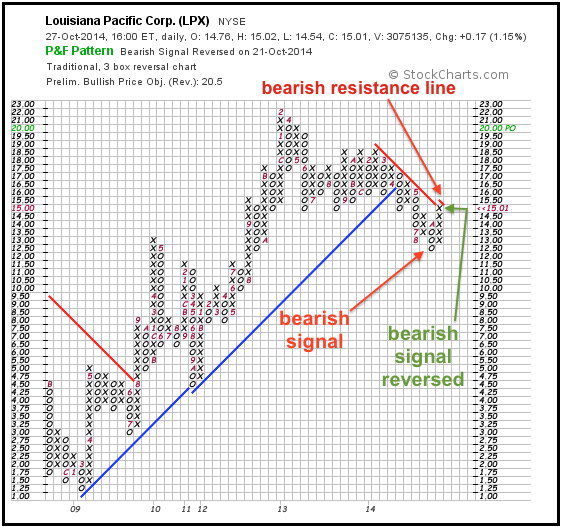
Louisiana Pacific Hits the Bearish-Signal-Reversed Scan
by Arthur Hill,
Chief Technical Strategist, TrendInvestorPro.com
A failed signal is sometimes as good as a signal. In other words, a failed bearish signal is sometimes just as good as a bullish signal. StockCharts users can find failed P&F signals on the Predefined Scans page. The example below shows LPX with a bearish signal when...
READ MORE
MEMBERS ONLY
UUP Holds Breakout, GLD Holds Break Down, Plus BBBY, EXPR, FL and VEEV
by Arthur Hill,
Chief Technical Strategist, TrendInvestorPro.com
Stocks dipped in early trading as selling pressure hit, but firmed and moved higher in the afternoon. DIA and QQQ closed with fractional gains, while IWM and SPY closed with fractional losses. The sectors were mixed with five up and four days. Energy and materials were slammed. The Oil &...
READ MORE
MEMBERS ONLY

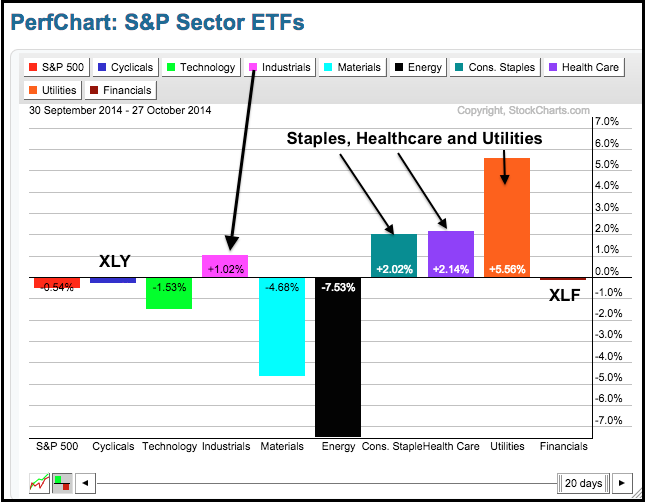
CONSUMER STAPLES AND UTILITIES SPDRS SURGE TO NEW HIGHS -- OIL ETFS BREAK PENNANT LINES -- XOP AND XES FOLLOW OIL LOWER -- INITIAL CLAIMS AND INDUSTRIAL PRODUCTION FAVOR LESS QE -- TIP SHOWS INFLATIONARY PRESSURES DECREASING
by John Murphy,
Chief Technical Analyst, StockCharts.com
CONSUMER STAPLES AND UTILITIES SPDRS SURGE TO NEW HIGHS... Link for today's video. The defensive sectors took the lead on Monday with the Consumer Staples SPDR (XLP) and the Utilities SPDR (XLU) hitting fresh 52-week highs. Relative strength and upside leadership in these two sectors shows a preference...
READ MORE
MEMBERS ONLY
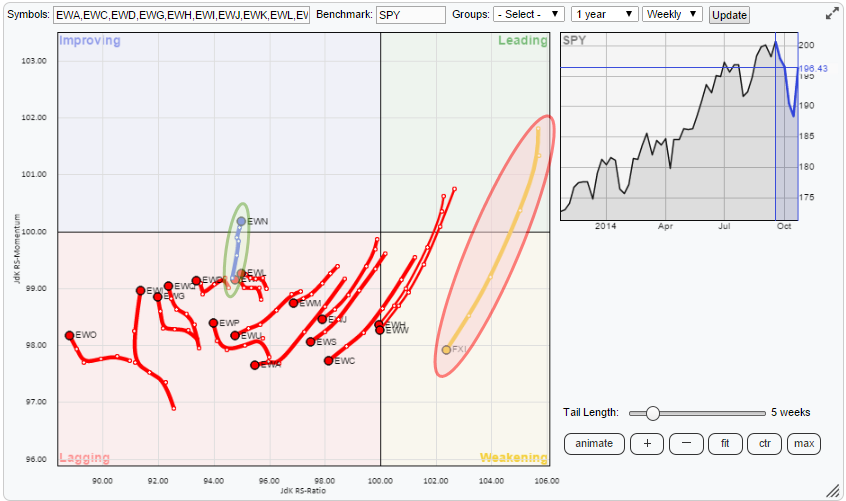
US Equities remain firmly in the lead

by Julius de Kempenaer,
Senior Technical Analyst, StockCharts.com
The landscape for international equities continues to show a rotation out of Emerging Markets into more developed markets. At least that is the big picture. There are a few ways that we can use to approach this equity universe and I will use three different relative rotation graphs in this...
READ MORE
MEMBERS ONLY
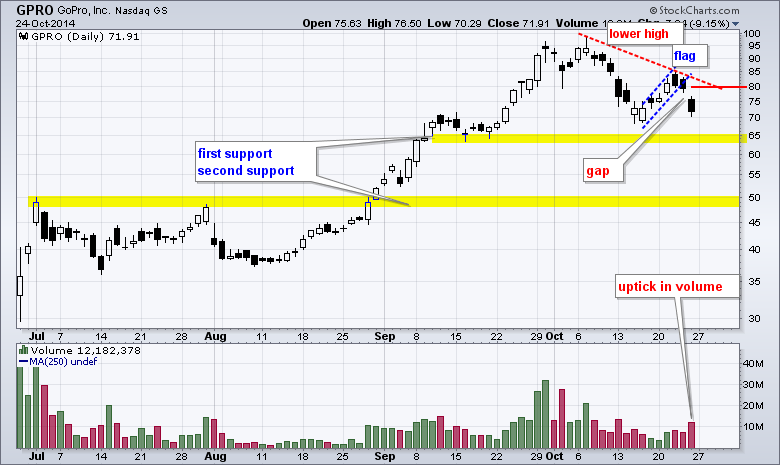
GoPro Gaps with Uptick in Volume GPRO
by Arthur Hill,
Chief Technical Strategist, TrendInvestorPro.com
GoPro (GPRO) came under pressure last week as a lower high formed and the stock gapped down. Even though the Nasdaq 100 moved higher the last two days, GPRO moved lower and formed three black (filled) candlesticks. With the decline and gap over the last two days, the stock broke...
READ MORE
MEMBERS ONLY
AD Line Gets a Break - USO Stalls after Pennant Break
by Arthur Hill,
Chief Technical Strategist, TrendInvestorPro.com
It was another strong week for stocks as the market put in another broad-based rally. Month-to-date, SPY and QQQ are still slightly lower, but IWM is up around 1.5% for October. This suggests that small-caps are showing some upside leadership as we head into November-December. Chart XX shows the...
READ MORE
MEMBERS ONLY
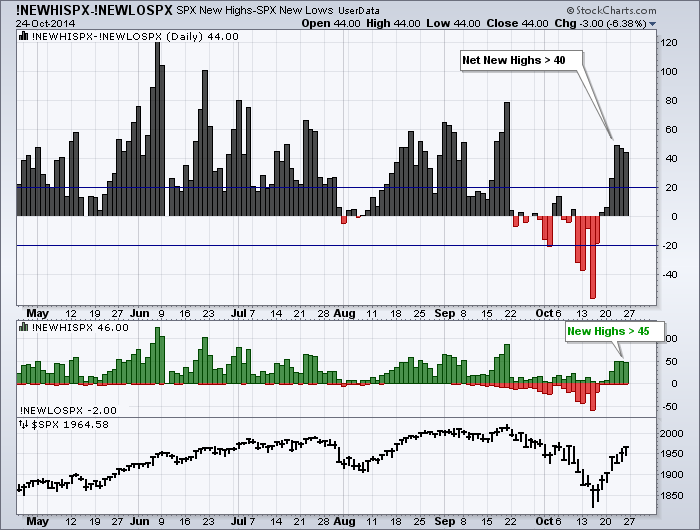
New Highs Surge on the S&P 500
by Arthur Hill,
Chief Technical Strategist, TrendInvestorPro.com
The surge in the S&P 500 over the last six days was accompanied by a surge in new highs the last few days. Notice that Net New Highs exceeded 40 the last three days and new highs exceeded 45 the last three days. There were only two new...
READ MORE
MEMBERS ONLY

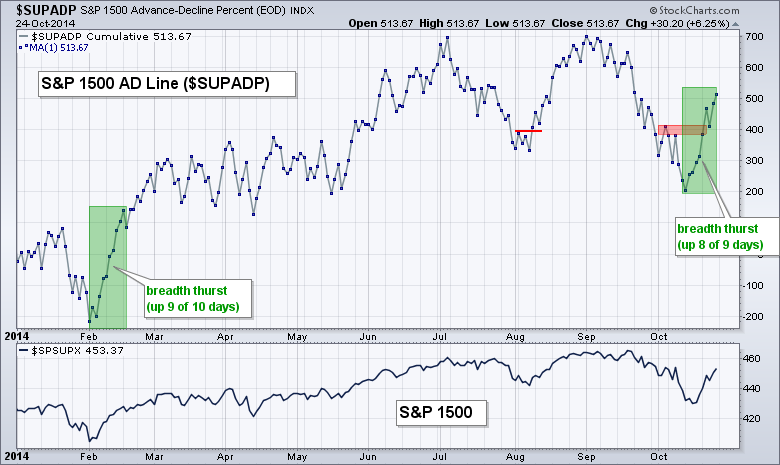
THE KEY TO THE UPSWING IN IWM -- RAFF REGRESSION CHANNEL DEMO -- BREADTH THRUST IS BULLISH UNTIL IT ISN'T -- ELEMENTS OF RISK AVERSION REMAIN -- MEDICAL DEVICES ETF CHALLENGES PRIOR HIGHS -- OIL AND GASOLINE CONSOLIDATE WITHIN DOWNTRENDS
by John Murphy,
Chief Technical Analyst, StockCharts.com
THE KEY TO THE UPSWING IN IWM (RAFF REGRESSION CHANNEL DEMO)... Link for today's video. Chart 1 shows the Russell 2000 iShares (IWM) with Raff Regression Channels marking the swings over the last six months. The overall trend is down because the ETF formed a lower high in...
READ MORE
MEMBERS ONLY

A Virtual PhD in Institutional Style Investing: Tensile Trading ChartPack Update 5.0
by Gatis Roze,
Author, "Tensile Trading"
Each quarter, I present you with the ultimate equity shopping list. A virtual 5-star smorgasbord of alluring delights, showcasing the stocks that Fidelity is presently buying in each of its 40 Select Sector Funds. This is no newsletter XXX hypothetical model portfolio of recommendations. Rather, it is the actual equities...
READ MORE
MEMBERS ONLY
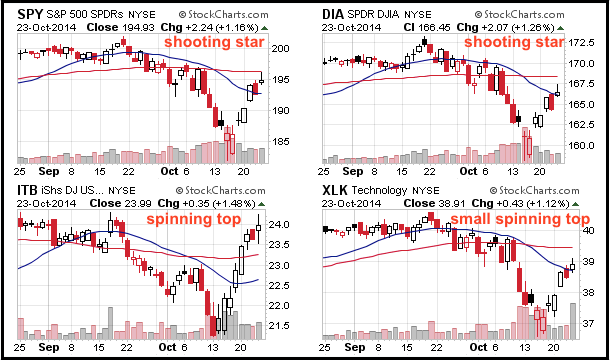
SPY and QQQ Hit Resistance Zones, but Uptrends Hold
by Arthur Hill,
Chief Technical Strategist, TrendInvestorPro.com
Stocks put in another bullish performance on Thursday with small-caps leading the way. The Russell 2000 Growth iShares (IWO) led the style ETFs with a 2.11% gain. Seven of the nine sectors were up with industrials leading. Several small-cap sectors made big moves with energy, materials and technology surging...
READ MORE
MEMBERS ONLY

MARKET RALLY CONTINUES -- RAILS LEAD TRANSPORTS HIGHER -- MMM LEADS INDUSTRIAL SPDR ABOVE 50-DAY LINE -- SMALL CAPS ALSO IMPROVE -- DIVIDEND PAYERS ATTRACT BUYERS ON FALLING BOND YIELDS -- VIX PLUNGES BACK BELOW 20 -- OVERSOLD FOREIGN SHARES REBOUND
by John Murphy,
Chief Technical Analyst, StockCharts.com
RAILS LEAD TRANSPORTS HIGHER ... Not only are stocks extending their recent rally with a strong day, they're being led higher by economically-sensitive groups like transports. The daily bars in Chart 1 show the Dow Jones Transportation Average trading 2% higher today and trading above its 50-day moving average....
READ MORE
MEMBERS ONLY
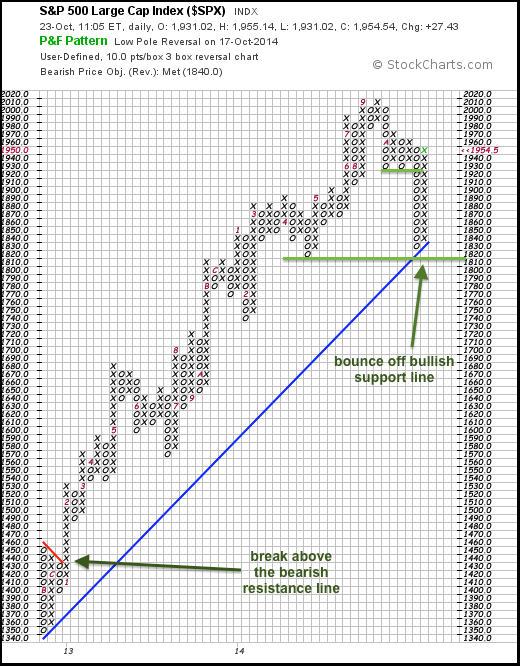
P&F Chart Nails it for the S&P 500
by Arthur Hill,
Chief Technical Strategist, TrendInvestorPro.com
The chart below shows a long-term Point & Figure chart for the S&P 500. Each box is 10 points and a 30+ point move is needed for a reversal (3 boxes). This chart starts with the rally off the November 2012 low. The blue bullish support line was...
READ MORE
MEMBERS ONLY

Bearish Candle Patterns Indicate a Test of Last Week's Lows are Likely
by Martin Pring,
President, Pring Research
* Short-term momentum is still oversold, so a rally is probable once the expected test is over.
* Any rally likely to be part of an overall topping out process.
* Europe experiences primary trend sell signal.
* Japanese and Asian Ex Japan ETF’s look vulnerable from a long-term aspect.
This week we...
READ MORE
MEMBERS ONLY
Dollar Breaks Wedge Trendline - Plus INTC, JPM and WFC
by Arthur Hill,
Chief Technical Strategist, TrendInvestorPro.com
Stocks came under selling pressure on Wednesday with small-caps and micro-caps leading the way lower. These two led the rebound, but this upside leadership faded over the last five days. Seven of the nine sector SPDRs were down with industrials and energy leading the way. Oil fell over 1% and...
READ MORE
MEMBERS ONLY
DP Chart Gallery - Indicators that are Talking
by Erin Swenlin,
Vice President, DecisionPoint.com
I actually review most of the charts in the DP Chart Gallery for my DecisionPoint Daily Update everyday, but there are a few that I don't often survey. With the market correcting, bottoming and today, pausing, I wanted to see all of what we have in the Chart...
READ MORE
MEMBERS ONLY
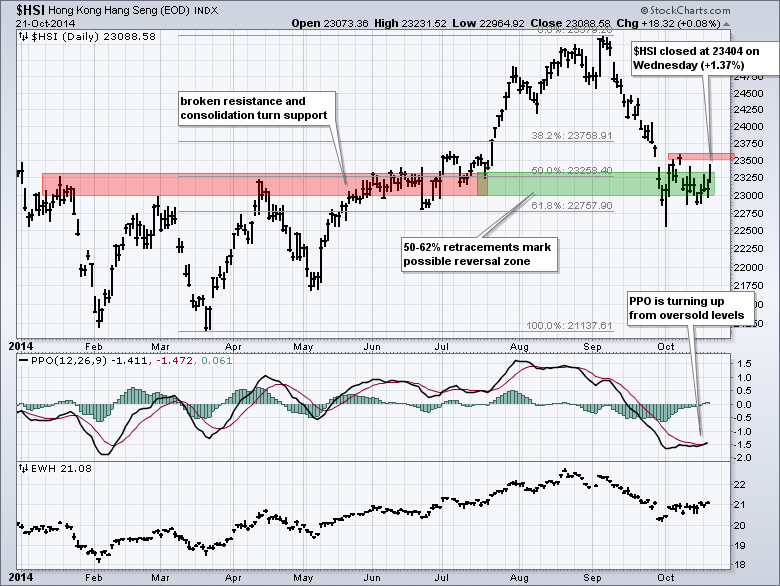
The Hang Seng Gears Up for a Move
by Arthur Hill,
Chief Technical Strategist, TrendInvestorPro.com
Protests and weakness in global markets weighed on the Hang Seng Composite ($HSI) in September as the index fell to its prior resistance zone. The index stabilized in October and got a nice bounce on Wednesday. This is an interesting area because it also represents a 50-62% retracement of the...
READ MORE
MEMBERS ONLY
SPY Surges to Key Level - TLT Firms Near Support
by Arthur Hill,
Chief Technical Strategist, TrendInvestorPro.com
Stocks surged with broad strength that lifted all boats (except gold miners). Several of the major index ETFs surged over 2%. All nine sector SPDRs were higher, all nine equal-weight sector ETFs were up on the day and all nine small-cap sector ETFs were up. The energy sector led the...
READ MORE