MEMBERS ONLY

MEASURING RISK APPETITE WITH MICRO-CAPS -- RUSSELL 2000 ISHARES RE-CAPTURES ONE BREAK -- CONSUMER DISCRETIONARY AND INDUSTRIALS SECTORS LEAD THE REBOUND -- ITB FORMS A BIG REVERSAL ON BIG VOLUME -- OIL SERVICE ETF FIRMS AFTER SELLING CLIMAX

by John Murphy,
Chief Technical Analyst, StockCharts.com
MEASURING MICRO-CAPS FOR RISK APPETITE... Link for today's video. The Russell Micro-Cap iShares (IWC) is an important ETF to watch because it represents the appetite for the riskiest stocks in the market. Small-cap stocks are deemed riskier than large-caps and micro-cap stocks are deemed riskier than small-caps. Micro-caps...
READ MORE
MEMBERS ONLY
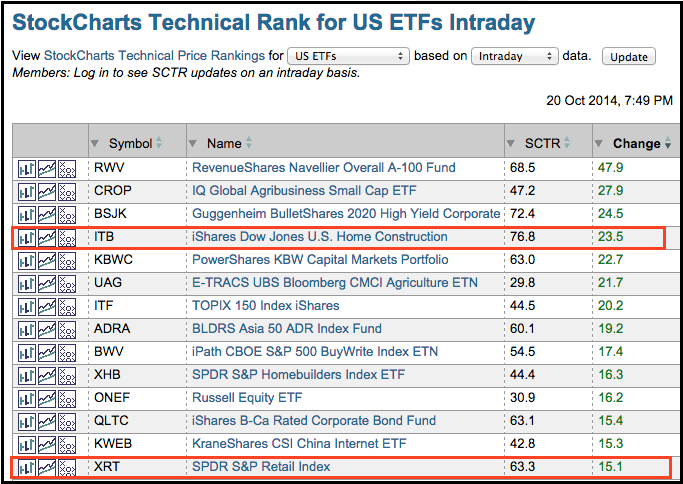
Homebuilder and Retail ETFs Make Big Relative Moves

by Arthur Hill,
Chief Technical Strategist, TrendInvestorPro.com
The table below shows the StockCharts Technical Rank (SCTR) for our ETF universe. This table is sorted by "change" with the biggest gainers at the top. In particular, the SCTR for the Home Construction iShares (ITB) surged 23.5 points and moved above 75 and the SCTR for...
READ MORE
MEMBERS ONLY
Small-Caps Continue to Lead - Plus BBBY, GDX, ITB and XRT
by Arthur Hill,
Chief Technical Strategist, TrendInvestorPro.com
Given the IBM miss, I was pretty impressed with market action on Monday. The Dow Diamonds (DIA) had every reason to fill its gap after a weak open, but immediately firmed and closed near the high of the day (and positive for the day). The major index ETFs are holding...
READ MORE
MEMBERS ONLY
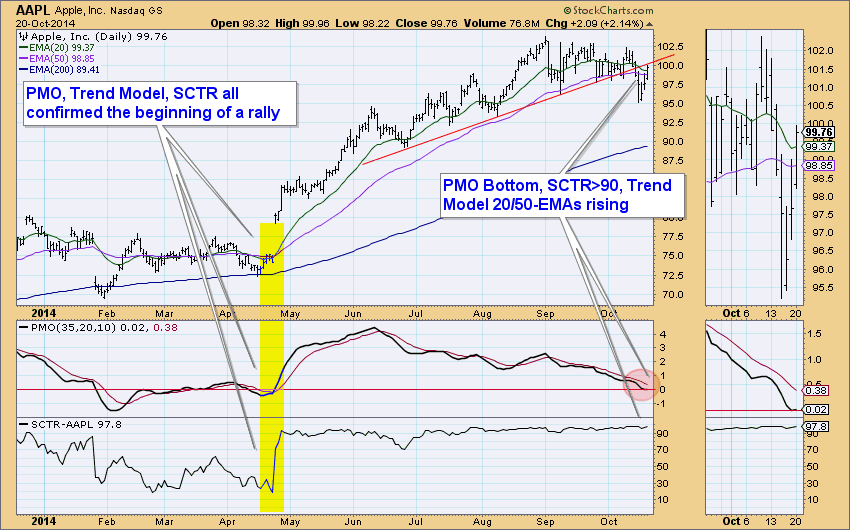
Getting a Jump on Apple

by Erin Swenlin,
Vice President, DecisionPoint.com
Apple, Inc. (AAPL) gets plenty of press and so I debated even bringing it up. However, they reported earnings after the bell and beat expectations. Despite weak iPad sales, the huge iPhone 6 and Mac sales have investors excited. Last I'd heard it was up over 1% in...
READ MORE
MEMBERS ONLY
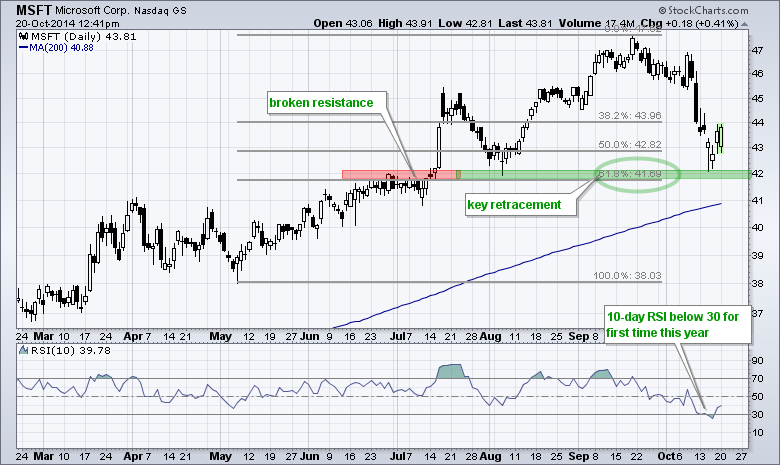
Microsoft Bounces off Key Retracement
by Arthur Hill,
Chief Technical Strategist, TrendInvestorPro.com
The chart below shows Microsoft (MSFT) falling to broken resistance, firming for two days and bouncing over the last two days. Also notice that this bounce occurred at the 62% retracement. Even though the decline looks steep, support held where it should and the stock is above the rising 200-day...
READ MORE
MEMBERS ONLY

SPY GETS STUCK BETWEEN A GAP AND A HARD PLACE -- FALLING YIELD CURVE WEIGHS ON REGIONAL BANKS -- RETAILER SPDR STRUGGLES TO STAY POSITIVE -- TWO DISCOUNTERS SHOW RELATIVE STRENGTH -- WATCHING MACY'S AND NORDSTROM FOR CLUES
by John Murphy,
Chief Technical Analyst, StockCharts.com
SPY GETS STUCK BETWEEN A GAP AND A HARD PLACE... Link for today's video. Chart 1 shows the S&P 500 SPDR (SPY) forging a short-term reversal last week. Notice how the ETF gapped below 187 on Wednesday, stalled for two days and then gapped above 187...
READ MORE
MEMBERS ONLY
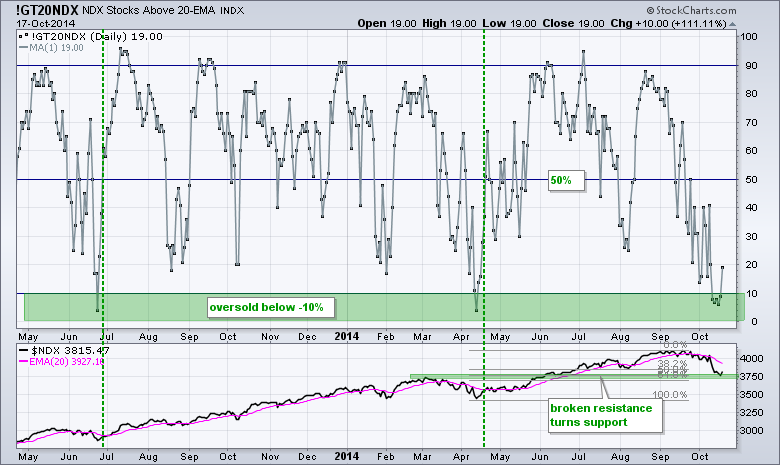
Stocks Gets an Oversold Bounce - NDX Breadth Improves
by Arthur Hill,
Chief Technical Strategist, TrendInvestorPro.com
Stocks followed up on Thursday's reversal day with a gap up on Friday. Afternoon selling pressure pushed small-caps and micro-caps into negative territory by the close, but the rest of the major index ETFs closed positive. All nine sector SPDRs closed higher with the Industrials SPDR leading the...
READ MORE
MEMBERS ONLY
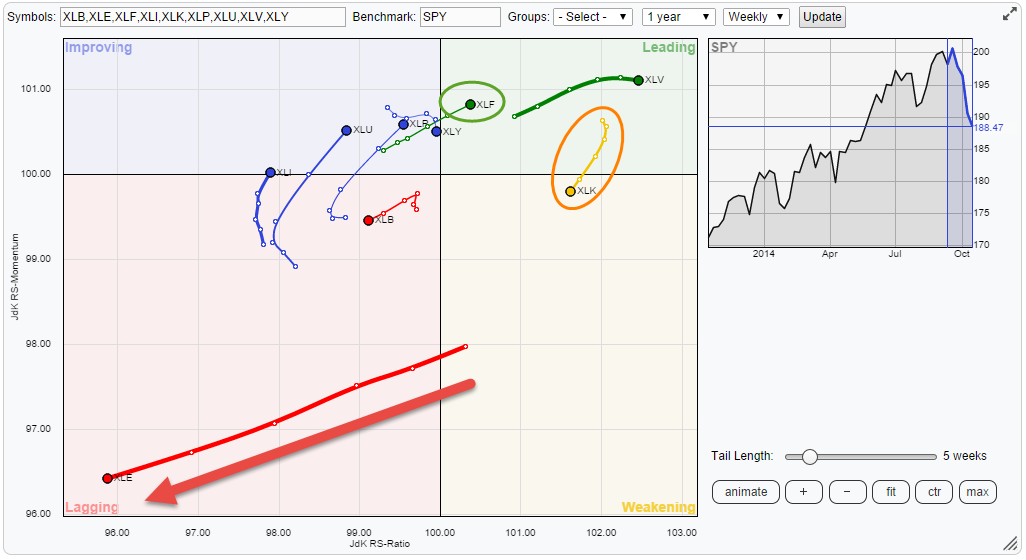
Energy continues weakness but Financials rotating into leading quadrant

by Julius de Kempenaer,
Senior Technical Analyst, StockCharts.com
Printed below is the weekly Relative Rotation Graph(tm) of the nine S&P sector ETFs against SPY. The clear eye-catcher on this picture is the move of XLE (Energy) deep inside the lagging quadrant and still heading deeper into it. The second observation is that the strong relative...
READ MORE
MEMBERS ONLY
Answering Our Top Two Questions
Hello Fellow ChartWatchers!
Friday's rally changed last week's Dow candlestick from a big filled candle into more of a big Hammer (although not a perfect one). After Friday's rally, the Dow finished the week down 1% as did the S&P 500 Large...
READ MORE
MEMBERS ONLY
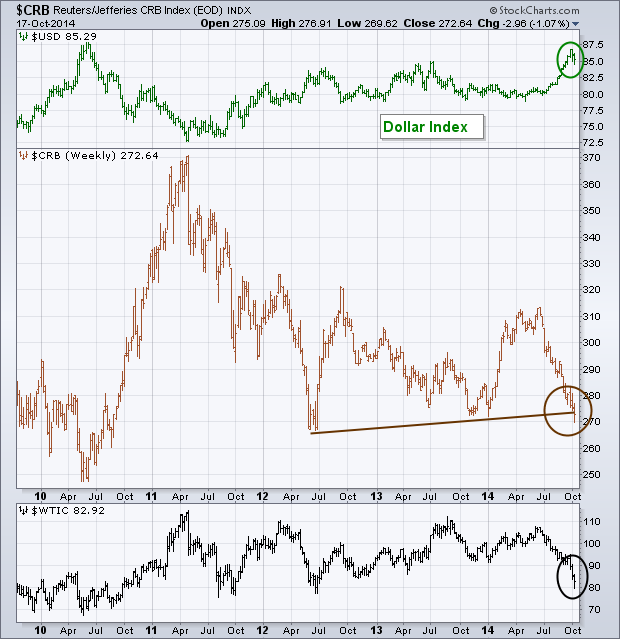
CRB Index is Testing Major Support
by John Murphy,
Chief Technical Analyst, StockCharts.com
Today's message takes a look at commodity prices because they've been the focus of a lot of attention of late. That's because falling commodity prices are deflationary in nature, which is something central bankers are trying to stop. The weekly bars in Chart 1...
READ MORE
MEMBERS ONLY
Weakness Confirms Earlier Bearish Signals

by Tom Bowley,
Chief Market Strategist, EarningsBeats.com
Make no mistake about it, volume has exploded and stock prices have fallen and lost key support levels. That combination is bearish in and of itself. But the part that really bothers me is that intermarket warning signs have been flashing for months so this high volume market drop confirms...
READ MORE
MEMBERS ONLY

CRB INDEX TESTS MAJOR SUPPORT -- BOND SURGE SHOWS EXHAUSTION -- JUMP IN HIGH YIELD BONDS IS ENCOURAGING -- S&P 500 BOUNCES FROM OVERSOLD CONDITION -- BUT MORE TESTING MAY BE NEEDED -- SMALL CAP RALLY FADES ON FRIDAY
by John Murphy,
Chief Technical Analyst, StockCharts.com
CRB INDEX IS TESTING MAJOR SUPPORT... I'm starting today's message with a look at commodity prices because they've been the focus of a lot of attention of late. That's because falling commodity prices are deflationary in nature, which is something central bankers...
READ MORE
MEMBERS ONLY
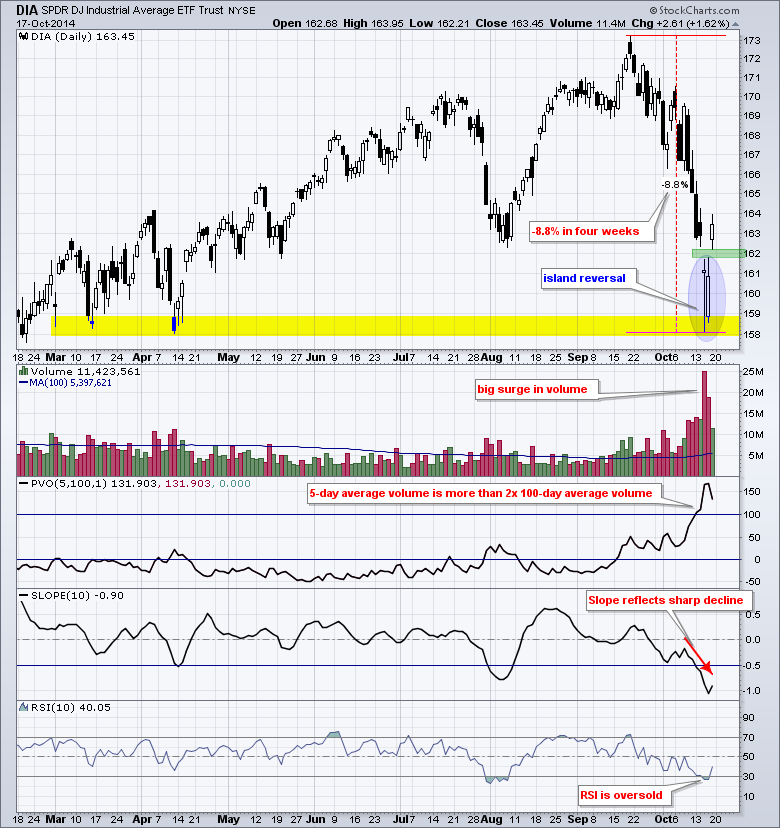
DIA Forges Island Reversal off Support Zone (video)
by Arthur Hill,
Chief Technical Strategist, TrendInvestorPro.com
The Dow Diamonds (DIA) showed signs of a selling climax last week and forged an island reversal to end the week. First, let's look at the indicators to suggest that we had a selling climax or capitulation of sorts. A selling climax involves a very sharp decline with...
READ MORE
MEMBERS ONLY
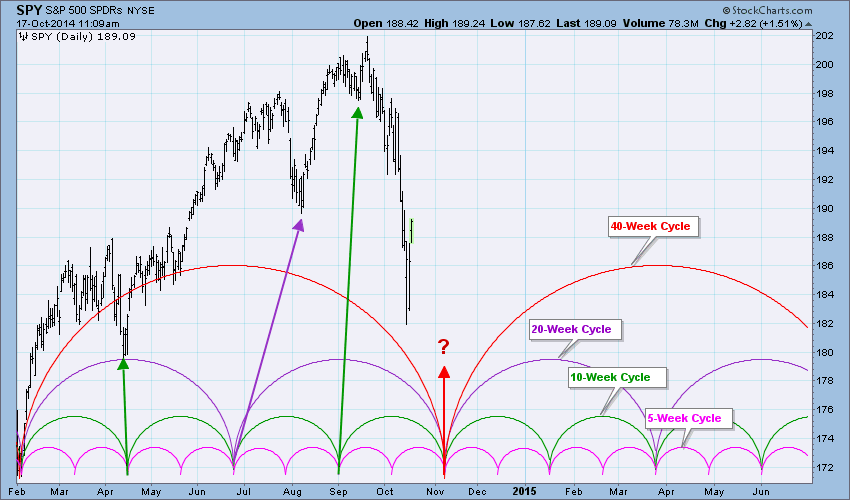
Important Cycle Low Due Soon

by Carl Swenlin,
President and Founder, DecisionPoint.com
Fair warning! If you read this article and get hooked on cycle analysis, you will rue the day. If we look at price charts, we can clearly see that prices move up and down in cycles, but trying to use this tool can be frustrating beyond words. There are certainly...
READ MORE
MEMBERS ONLY

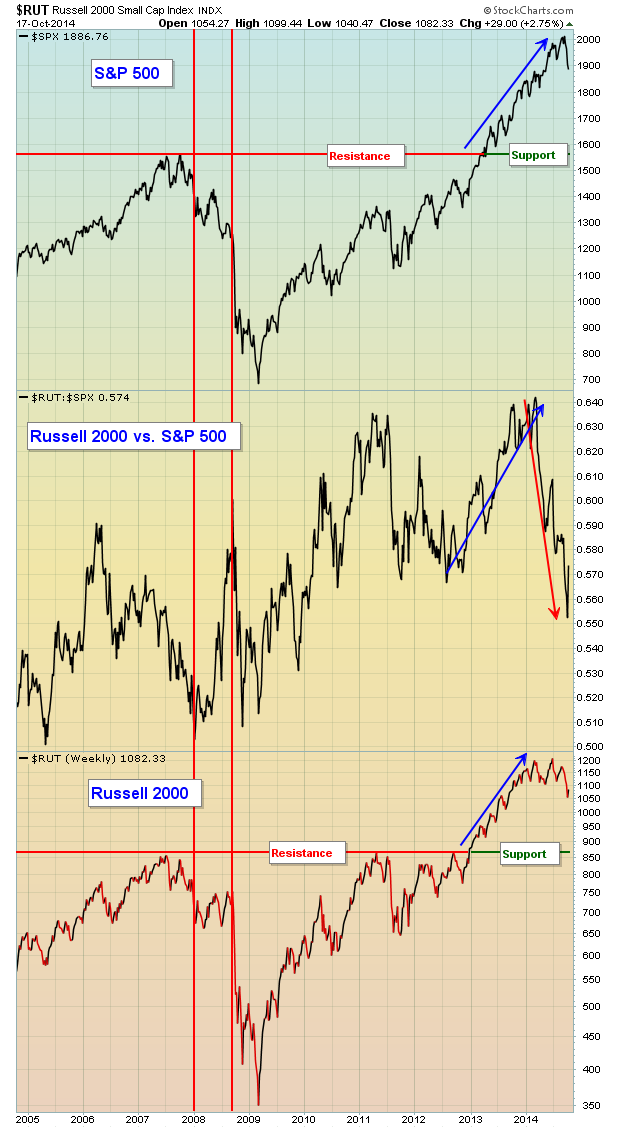
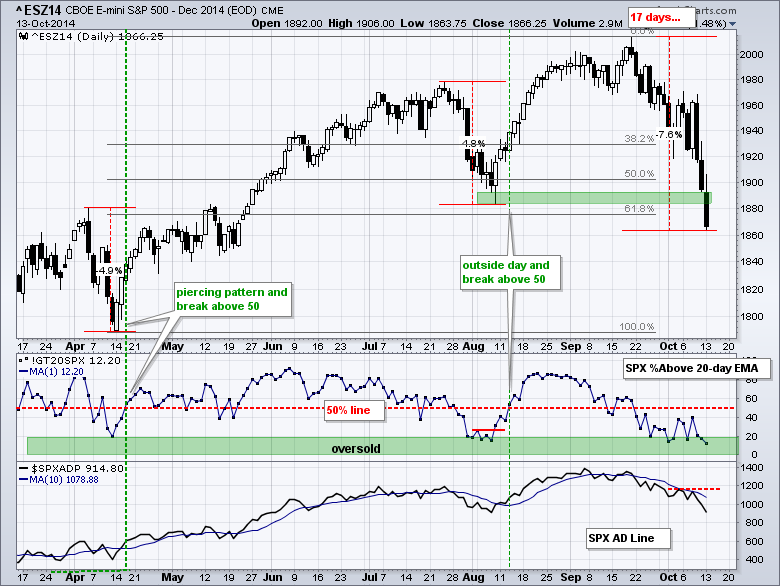
S&P 500 HITS LONG VOLUME-BY-PRICE BAR -- S&P MIDCAP 400 FULFILLS DOUBLE TOP TARGET -- SMALL-CAP PRICE RELATIVE BOUNCES -- SECTOR ROTATIONS FAVOR DEFENSIVE SECTORS -- TWO SMALL-CAP SECTORS TO WATCH -- PLUNGE IN SHORT-TERM RATES SHOWS FLIGHT TO SAFETY
by John Murphy,
Chief Technical Analyst, StockCharts.com
S&P 500 HITS LONG VOLUME-BY-PRICE BAR... On an intraday basis, the S&P 500 fell around 10% from its summer high to the mid October low. Even though a 10% decline may seem drastic, it still pales relative to the 50% advance from the November 2012 low...
READ MORE
MEMBERS ONLY

CAN SLIM on Steroids

by Gatis Roze,
Author, "Tensile Trading"
Profitable investing demands a unique type of profitable thinking. Once you've achieved this consistently in your thinking and investing, you are ready to move on to focusing on how best to nudge the probabilities in your favor with respect to all elements of your methodology. Specifically, the example...
READ MORE
MEMBERS ONLY
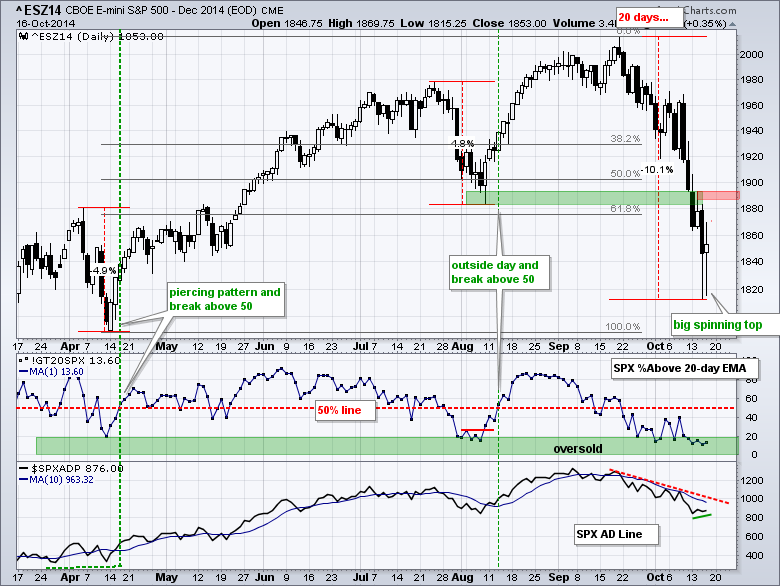
E-Mini Forms Big Spinning Top - Small-caps Continue to Outperform
by Arthur Hill,
Chief Technical Strategist, TrendInvestorPro.com
It was another volatile day for stocks and the major index ETFs finished mixed. Once again, the Russell 2000 iShares and Russell MicroCap iShares led the way higher with 1+ percent gains. Energy led the sectors higher and got a nice oversold bounce. Eight of the nine small-cap sectors were...
READ MORE
MEMBERS ONLY
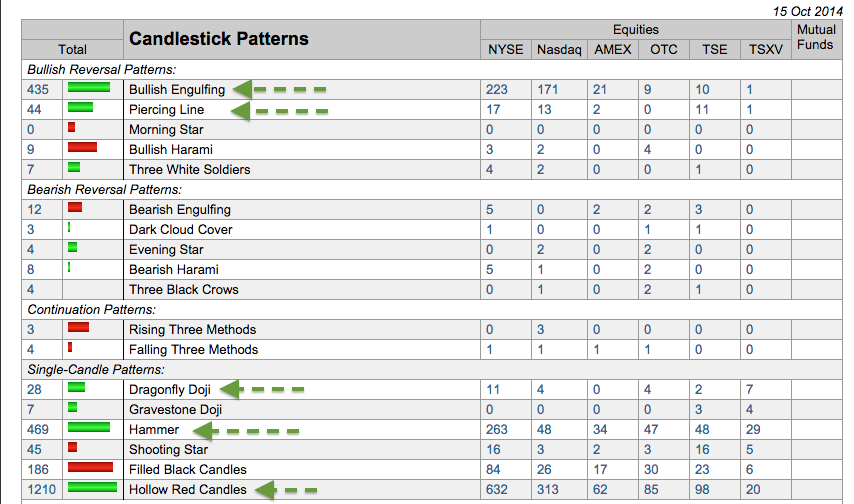
Hammers, Hollow Reds and Dragonflies Hit the Predefined Scans
by Arthur Hill,
Chief Technical Strategist, TrendInvestorPro.com
With weakness in early trading and a strong close, a number of bullish candlestick patterns formed on Wednesday. These include hammers and dragonfly doji. There were also hundreds of hollow red candlesticks. These form when the close is above the open, but the close is still below the prior close....
READ MORE
MEMBERS ONLY

That Was Probably It....For The Time Being

by Martin Pring,
President, Pring Research
* Short-term indicators continue to decline, but Wednesday’s price action may cause them to go bullish.
* Small caps starting to emerge as leaders on the upside (At least for the short-term).
* Quality bonds experience probable upside blow-off and high yield exhaustion on the downside .
Earlier in the week I pointed...
READ MORE
MEMBERS ONLY
Small-Cap Breadth Improves - A Blow off Top fo TLT?
by Arthur Hill,
Chief Technical Strategist, TrendInvestorPro.com
Stocks plunged in early trading and then bounced in the afternoon. After a whole lot of volatility, stocks finished mixed overall. The Russell 2000 iShares and the Russell MicroCap iShares gained over 1% and led the rebound. The S&P 500 SPDR and Nasdaq 100 ETF closed lower on...
READ MORE
MEMBERS ONLY

FOREIGN WEAKNESS FINALLY HITS U.S. STOCKS -- RISING VIX IS AT THREE-YEAR HIGH AND MAY HAVE FURTHER TO GO -- S&P 500 MAY RETEST ITS FEBRUARY LOW -- FOUR YEAR LOW IN BRENT CRUDE PULLS GERMAN BOND YIELD TO NEW RECORD LOW
by John Murphy,
Chief Technical Analyst, StockCharts.com
FOREIGN WEAKNESS FINALLY HITS THE U.S.... It took awhile for it to happen, but tumbling foreign markets have finally pulled the U.S. market into a downside correction. The three lines in Chart 1 tell the story. The blue line shows EAFE iShares (EFA) peaking at the start of...
READ MORE
MEMBERS ONLY
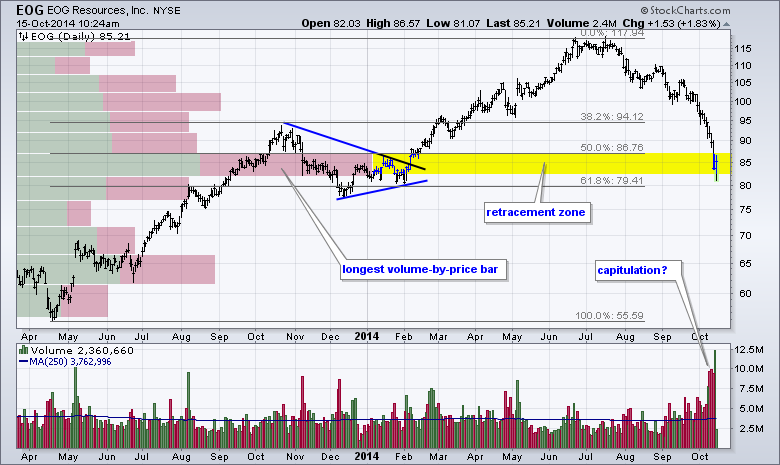
EOG hits Big Volume-by-price Bar
by Arthur Hill,
Chief Technical Strategist, TrendInvestorPro.com
Most energy stocks have been in a free fall this month and EOG resources is no exception. The stock plunged over 25% from its summer highs and retraced 50-62% of the prior advance (Apr-2013 to July-2014). The stock shows signs of capitulation as downside volume surged for three days and...
READ MORE
MEMBERS ONLY
Small-Caps Perk Up, but Risk Off Remains in Play
by Arthur Hill,
Chief Technical Strategist, TrendInvestorPro.com
Stocks attempted to bounce in early trading, but selling pressure took hold and the major index ETFs fell back in the afternoon. The S&P 500 SPDR (SPY) finished with a small gain (.54%) and the S&P 100 ETF (OEF) ended with a small loss (.09%). Small-caps...
READ MORE
MEMBERS ONLY
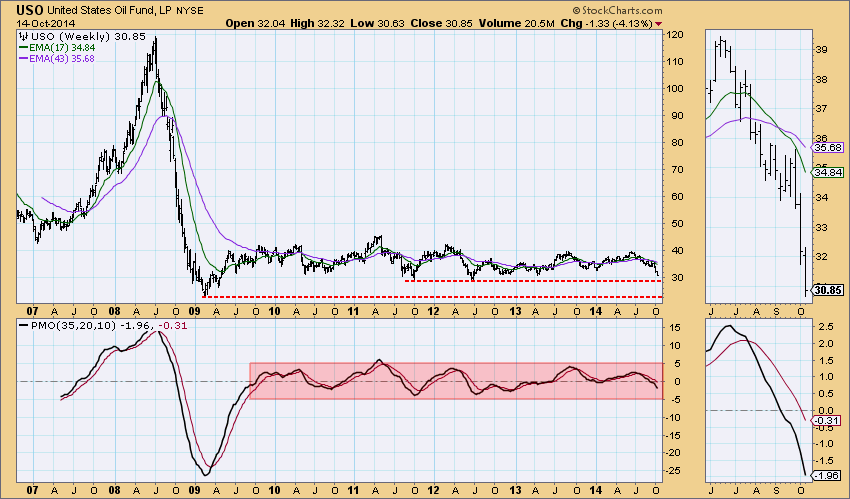
USO Prepares to Test 2011 Lows
by Erin Swenlin,
Vice President, DecisionPoint.com
United States Oil Fund (USO) is one of the "big four" that I analyze on a daily basis in the DecisionPoint Daily Update which you can find in the "DP Reports" blog. The other three of the "big four" are UUP (Dollar), Gold and...
READ MORE
MEMBERS ONLY
Longer-Term Indicators Finally Moving Deeper
by Carl Swenlin,
President and Founder, DecisionPoint.com
We have some longer-term indicators that we like because they are derived from price movement, rather than breadth or volume. They have a finite range (0-100) and reflect the percentage of index component stocks in a particular status. For almost two years they have stayed at unusually high levels, never...
READ MORE
MEMBERS ONLY
Shanghai Reverses Four -year Bear Market in Relative Action
by Martin Pring,
President, Pring Research
* Global equities experience long term technical damage.
* But short-term indicators are close to signaling a tradable rally.
* Bond market still looks strong.
* Gold experiences marginal upside breakout against stocks.
US Equities
Last week I described how some serious long-term technical damage had been done to global equities but that a...
READ MORE
MEMBERS ONLY

S&P 500 BREAKS KEY MOVING AVERAGE -- GOOGLE BREAKS DOWN AS APPLE HOLDS STRONG -- PLAYING THE SWINGS IN KRE AND IWC -- DECEMBER NATURAL GAS TESTS KEY LEVEL -- ENERGY-RELATED ETFS ARE THE MOST OVERSOLD -- COFFEE ETF CHALLENGES PRIOR HIGH
by John Murphy,
Chief Technical Analyst, StockCharts.com
S&P 500 BREAKS KEY MOVING AVERAGE ... Link for today's video. The S&P 500 is not in uncharted territory, but it is in territory we have not seen in some time. Chart 1 shows the index breaking below its 200-day moving average, breaking its prior...
READ MORE
MEMBERS ONLY
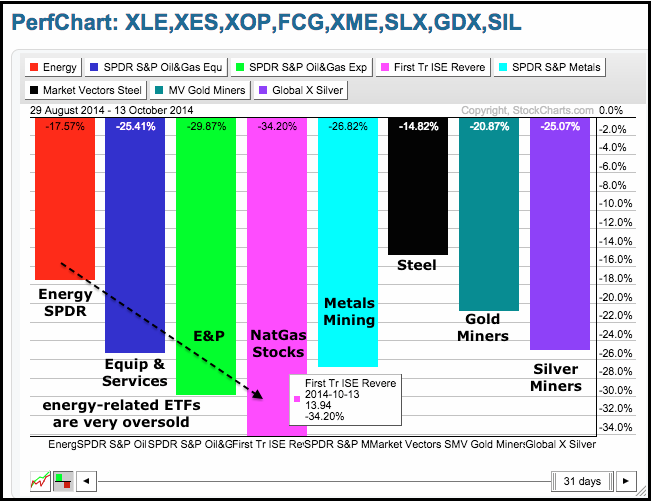
Energy-related ETFs Hit Historical Extremes
by Arthur Hill,
Chief Technical Strategist, TrendInvestorPro.com
By most metrics, the energy related ETFs have hit oversold extremes with big declines over the last 31 days. The Oil & Gas Equip & Services SPDR (XES) is down around 25%, the Oil & Gas E&P SPDR (XOP) is down almost 30% and the FirstTrust Natural Gas...
READ MORE
MEMBERS ONLY
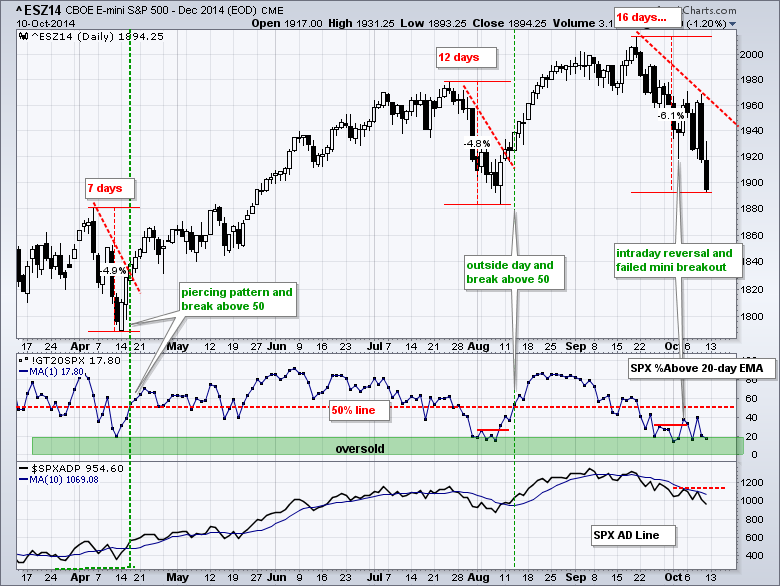
E-Mini Breaks August Low as SPY Hits Targets
by Arthur Hill,
Chief Technical Strategist, TrendInvestorPro.com
Stocks took it on the chin again as broad selling pressure hit most areas. Most of the major index ETFs declined around 1.5% on the day. The Russell 2000 iShares held up relatively well with a .40% decline and the Russell MicroCap iShares finished with a small gain. The...
READ MORE
MEMBERS ONLY

FOUR WAYS TO MEASURE RELATIVE PERFORMANCE -- UTILITIES SECTOR MAINTAINS WEDGE BREAKOUT -- SMALL FINANCIALS SHOW RELATIVE STRENGTH -- FINDING SECTORS THAT POINT NORTHEAST -- AVOIDING SECTORS THAT POINT SOUTHWEST
by John Murphy,
Chief Technical Analyst, StockCharts.com
SPX TESTS A KEY MOVING AVERAGE... Link for today's video. Selling pressure and volatility have dominated October, but some sectors and industry groups are holding up better than others. How can we find the strong groups and avoid the weak? The next few charts will show four methods...
READ MORE
MEMBERS ONLY
Sector Rotations, Treasuries, Dollar and Oil Favor Risk Off
by Arthur Hill,
Chief Technical Strategist, TrendInvestorPro.com
Stocks surged on Wednesday, but this surge failed miserably as the major index ETFs plunged to new lows for the month on Friday. The S&P 500 opened at 1961 on Thursday, closed of 1894 on Friday and fell 3.4% in two days. The index is once again...
READ MORE
MEMBERS ONLY

MARKETS REMAIN IN RISK-OFF MODE -- S&P 500 MOVES TOWARDS SUPPORT -- MID-CAPS BREAK SUPPORT -- SMALL-CAPS CONTINUE TO LAG -- INDUSTRIALS SPDR BREAKS KEY LEVEL -- CONSUMER DISCRETIONARY SPDR TESTS KEY LEVEL -- TECH AND FINANCE SPDRS ARE HOLDING UP THE BEST
by John Murphy,
Chief Technical Analyst, StockCharts.com
MARKETS REMAIN IN RISK-OFF MODE... Link for today's video. The markets continue to shun risk and embrace safety, which means the markets are in risk-off mode. There are several metrics to we can use for this assessment. First, small-caps have broken down and are underperforming large-caps. The S&...
READ MORE
MEMBERS ONLY

Why Investors Need to Appreciate Fine Wines
by Gatis Roze,
Author, "Tensile Trading"
As I sip my 2008 Cabernet Sauvignon, I ponder all the similarities between myself, as an investor, and Marty Clubb – the extraordinary winemaker at L’Ecole 41 in Walla Walla whose wine I am enjoying. His vines produce sensational wines because he diligently prunes the branches as any widely acclaimed...
READ MORE
MEMBERS ONLY
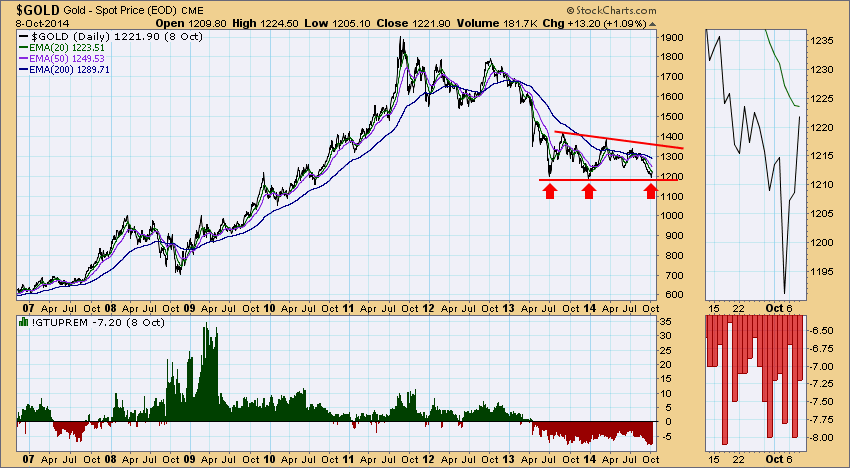
GOLD: Bouncing Off Support
by Carl Swenlin,
President and Founder, DecisionPoint.com
In our article on September 23 we postulated that gold seemed to be setting up for a triple bottom, but it was too soon to tell for sure. As of this week gold has reached the level of support drawn from the two previous bottoms, and it has bounced off...
READ MORE
MEMBERS ONLY
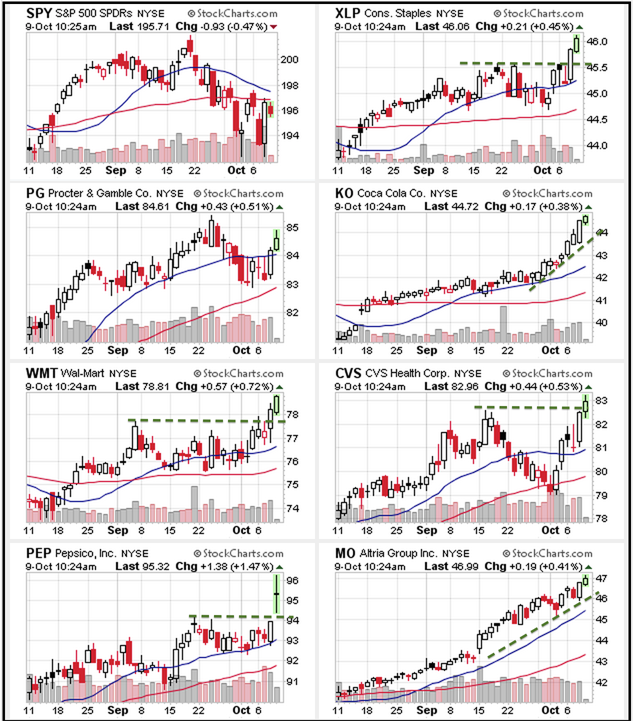
Consumer Staples Stocks Lead the Market
by Arthur Hill,
Chief Technical Strategist, TrendInvestorPro.com
The Consumer Staples SPDR (XLP) shows more "chart" strength than the S&P 500 SPDR (SPY) because it broke out to new highs this week. SPY, on the other hand, remains well below its September high. The CandleGlance chart below shows six leading consumer staples stocks. Five...
READ MORE
MEMBERS ONLY
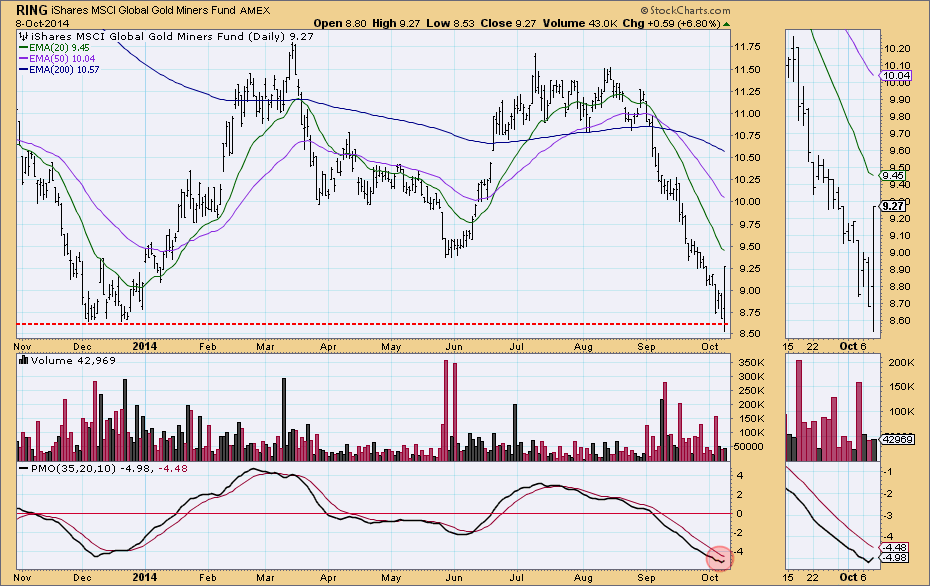
Gold Miners Rally! Is This The Bottom?
by Erin Swenlin,
Vice President, DecisionPoint.com
I noticed on today's DP ETF Tracker Report, where ETFs are sorted by percent change, that Gold Miners hit it big today. Gold Miner ETFs and stocks, while tied to gold, will not necessarilytrade and travel with gold prices. However, as of late they have been dropping just...
READ MORE
MEMBERS ONLY
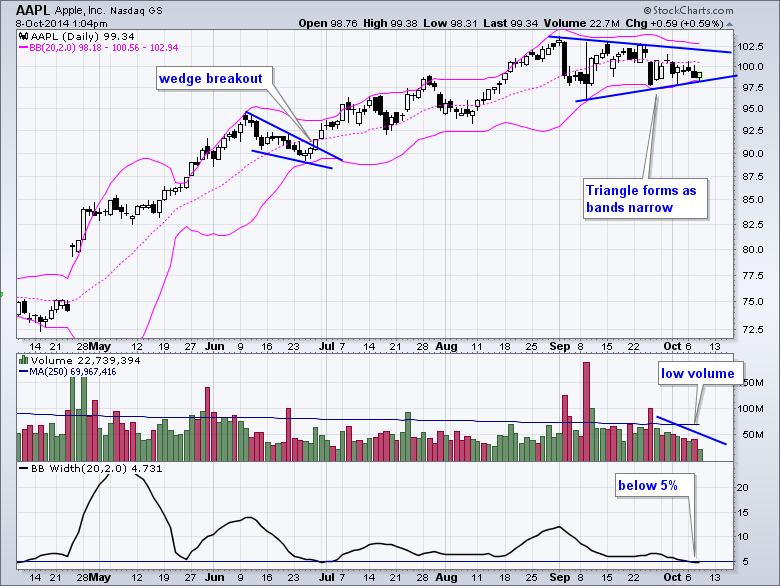
The Noose Tightens on Apple
by Arthur Hill,
Chief Technical Strategist, TrendInvestorPro.com
After a big advance from April to August, Apple (AAPL) turned dull as a tight consolidation takes shape. Notice that the Bollinger Bands are narrowing and a triangle is taking shape. The indicator window shows BandWidth below 5% for the first time since early July. This volatility contraction suggests that...
READ MORE
MEMBERS ONLY
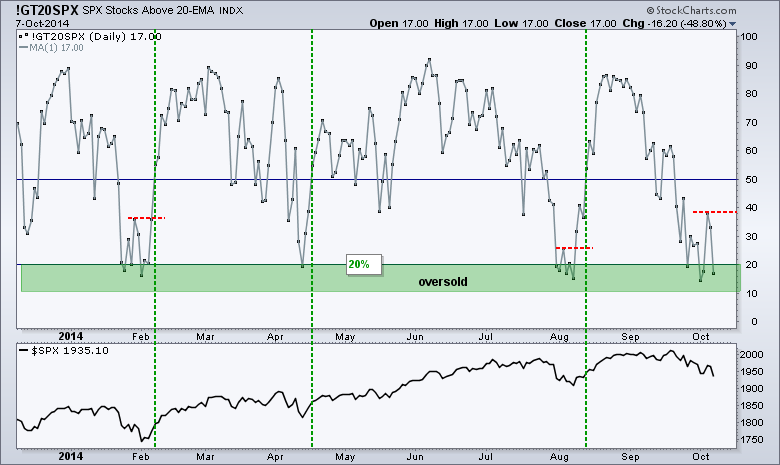
SPY Breadth Indicator Remains Oversold - Risk off Rules
by Arthur Hill,
Chief Technical Strategist, TrendInvestorPro.com
Stocks were hit with broad-based selling pressure on Tuesday. The major index ETFs lost around 1.5% each. All nine sectors were down with the Industrials SPDR (XLI) leading the way (-2.43%). The consumer staples and utilities sectors held up the best (smallest losses). Overall, the markets remain in...
READ MORE
MEMBERS ONLY
Stocks Break Down Against Bonds In A Major Way
by Martin Pring,
President, Pring Research
* Oversold short term condition could trigger a bounce... but remember this is October!
* Five year yield experiences false upside breakout. That signals lower yields
* Gold bounces from a must hold support level.
(Click here for the Video Version of this article.)
US Equities
In the last week some serious long-term...
READ MORE
MEMBERS ONLY
Stocks Break down Against Bonds in a Major Way - Video Version
by Martin Pring,
President, Pring Research
* Oversold short term condition could trigger a bounce... but remember this is October!
* Five year yield experiences false upside breakout. That signals lower yields.
* Gold bounces from a must hold support level.
Click here for the Print Version
Good luck and good charting,
Martin Pring...
READ MORE
