MEMBERS ONLY
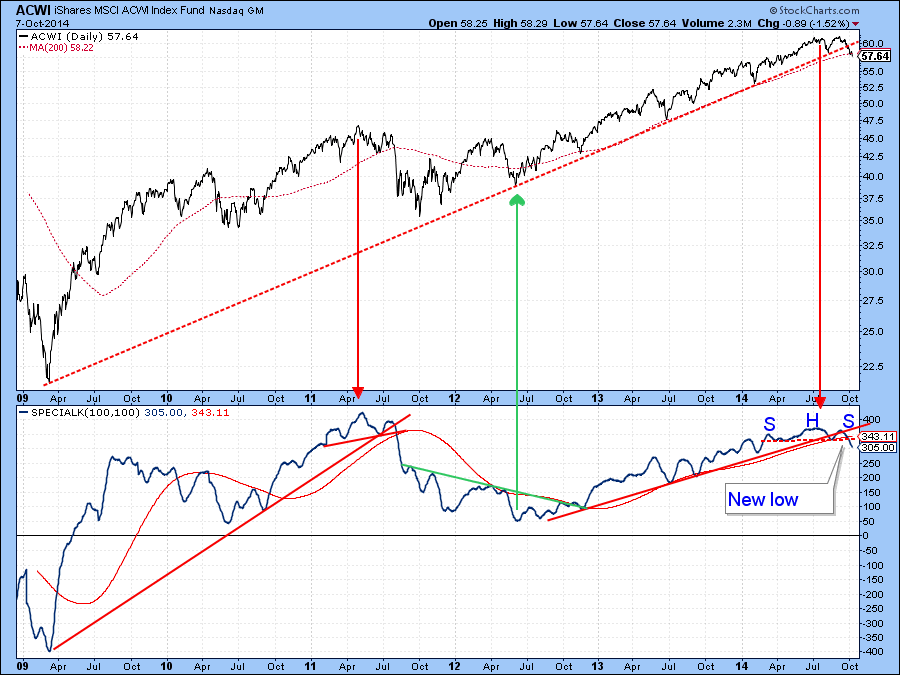
Stocks Break Down Against Bonds In A Major Way

by Martin Pring,
President, Pring Research
* Oversold short term condition could trigger a bounce... but remember this is October!
* Five year yield experiences false upside breakout. That signals lower yields
* Gold bounces from a must hold support level.
(Click here for the Video Version of this article.)
US Equities
In the last week some serious long-term...
READ MORE
MEMBERS ONLY
Stocks Break down Against Bonds in a Major Way - Video Version
by Martin Pring,
President, Pring Research
* Oversold short term condition could trigger a bounce... but remember this is October!
* Five year yield experiences false upside breakout. That signals lower yields.
* Gold bounces from a must hold support level.
Click here for the Print Version
Good luck and good charting,
Martin Pring...
READ MORE
MEMBERS ONLY

QQQ AND SPY TEST THEIR GAPS -- SMALL AND MICRO CAP ETFS FILL THEIR GAPS -- SECTOR PERFORMANCE REFLECTS DEFENSIVE MARKET -- DOLLAR AND TREASURIES ARE IN RISK OFF MODE -- 20+ YR T-BOND ETF CHALLENGES AUGUST HIGH

by John Murphy,
Chief Technical Analyst, StockCharts.com
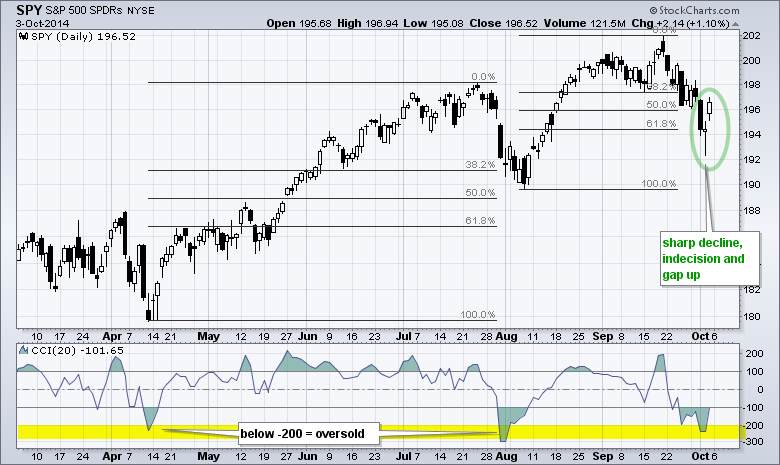
QQQ AND SPY TEST THEIR GAPS ... Link for today's video. The S&P 500 SPDR (SPY) and Nasdaq 100 ETF (QQQ) forged intraday reversals last Thursday and followed up with gaps on Friday, but the bulls are getting cold feet already because both fell back into their...
READ MORE
MEMBERS ONLY
Small-Caps Return to Lagging Ways - Plus AXP, GOGO, LNKD, SSTK, TYC and WIT

by Arthur Hill,
Chief Technical Strategist, TrendInvestorPro.com
Stocks face several headwinds over the next few weeks and this could make for choppy trading, or even further weakness. First, midterm elections are four weeks away and this could create uncertainty. Second, earnings season kicks off with Alcoa on October 8th and runs until the end of the month....
READ MORE
MEMBERS ONLY
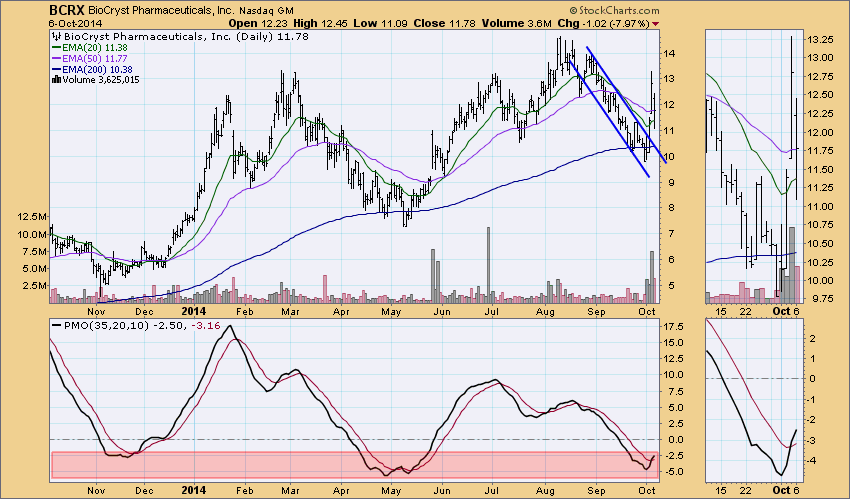
Ebola Stocks

by Erin Swenlin,
Vice President, DecisionPoint.com
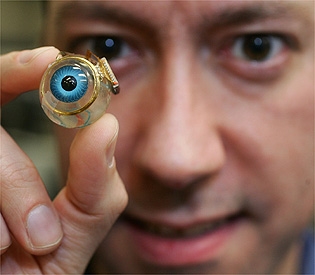
Today on Fox Business News channel, the panel of "Making Money" discussed the biotech stocks that are the makers or researchers for ebola virus pharmaceuticals. I thought it would be interesting to analyze the charts since their discussion was primarily based on fundamentals. All of these stocks have...
READ MORE
MEMBERS ONLY
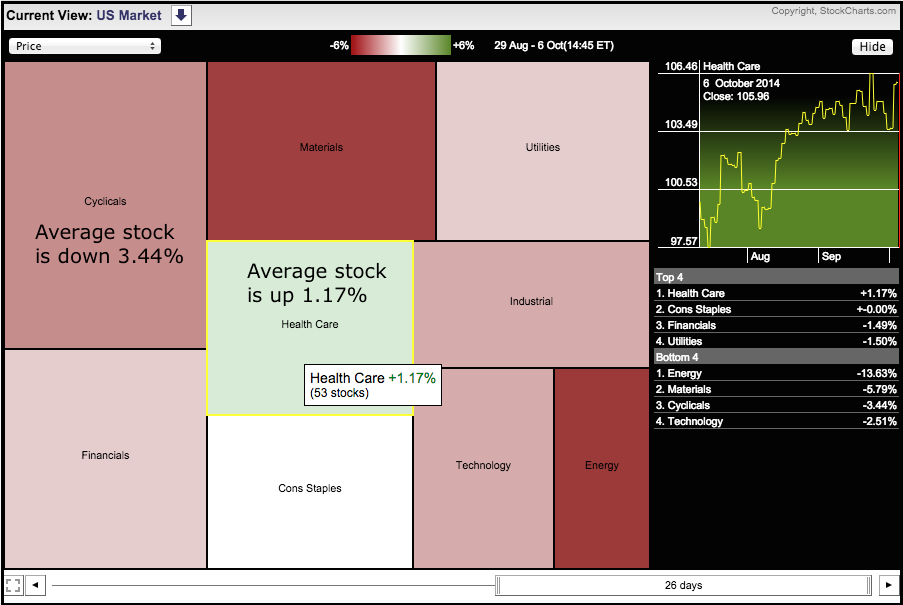
Healthcare is the Healthiest Sector
by Arthur Hill,
Chief Technical Strategist, TrendInvestorPro.com
It has been a rough ride for stocks since September began. The market carpet below shows performance for the sectors as a whole. The average healthcare stock is up 1.17% since 29-Aug and the average consumer staples stock is flat. The average stock for the other seven sectors is...
READ MORE
MEMBERS ONLY

SEASONAL PATTERNS START TO GET INTERESTING -- LOOKING AT SMALL-CAP PERFORMANCE FOR YEAREND -- SEASONAL PATTERNS STAND OUT FOR THREE SECTORS -- NATURAL GAS TESTS SUPPORT AGAIN -- AIRLINE INDEX BOUNCES OFF SUPPORT -- DELTA AND UNITED LEAD AIRLINES
by John Murphy,
Chief Technical Analyst, StockCharts.com
SEASONAL PATTERNS START TO GET INTERESTING... Link for today's video. StockCharts users can analyze seasonal patterns using the Seasonality Tool. This tool creates a histogram chart showing the percentage of times a security gained and the average gain/loss overall. Before getting into the current seasonal patterns, note...
READ MORE
MEMBERS ONLY
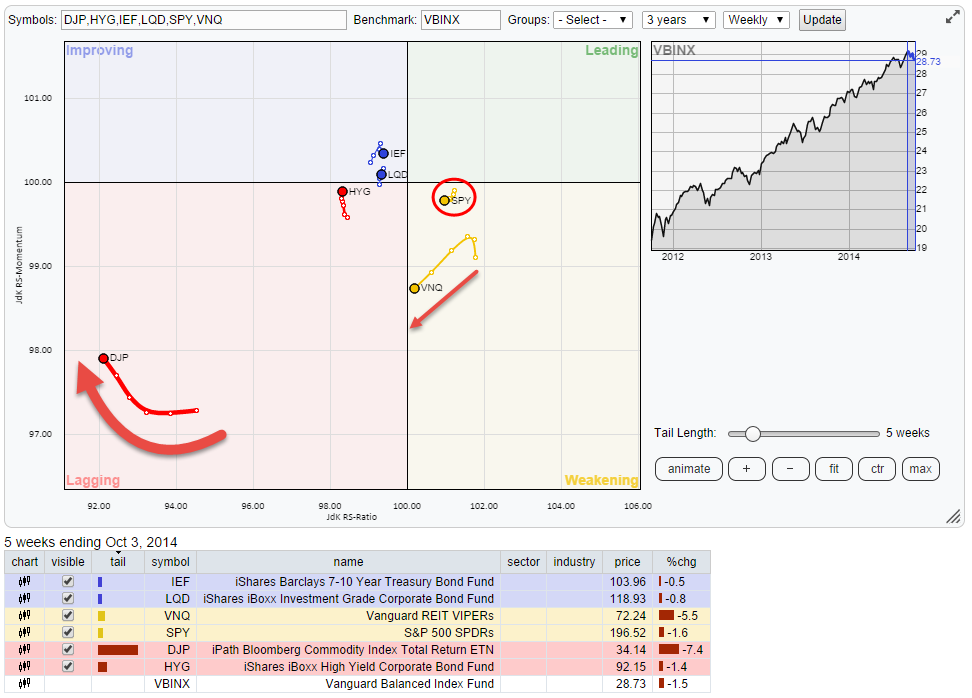
Commmmmmodities and Real(ly weak)-Estate

by Julius de Kempenaer,
Senior Technical Analyst, StockCharts.com
On the Relative Rotation Graph holding a number of, indices representing various, Asset Classes there are two that are standing out and deserve our attention. The first one is Commodities and the second one is Real-Estate. The graph below shows the weekly RRG chart for asset classes with a five...
READ MORE
MEMBERS ONLY
SPY Follows Up on Reversal Day - Watching Breadth Closely
by Arthur Hill,
Chief Technical Strategist, TrendInvestorPro.com
Stocks reversed course intraday on Thursday and followed this reversal with a gap-surge on Friday. The gains for the day were modest as the S&P 500 SPDR added 1.10% and the Russell 2000 iShares gained .75% on the day. Eight of the nine sector SPDRs were higher...
READ MORE
MEMBERS ONLY
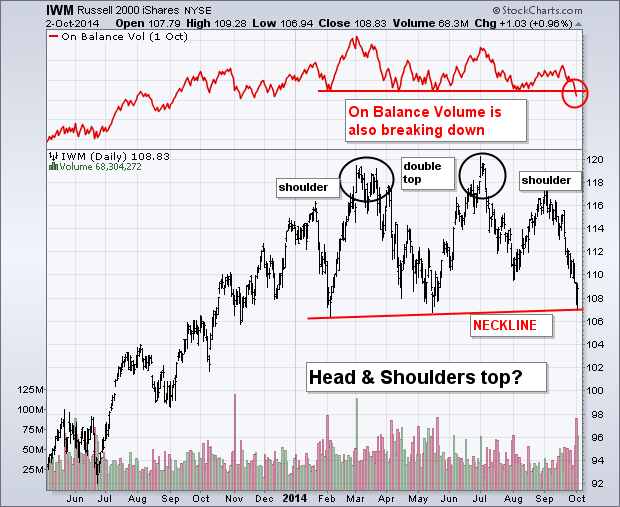
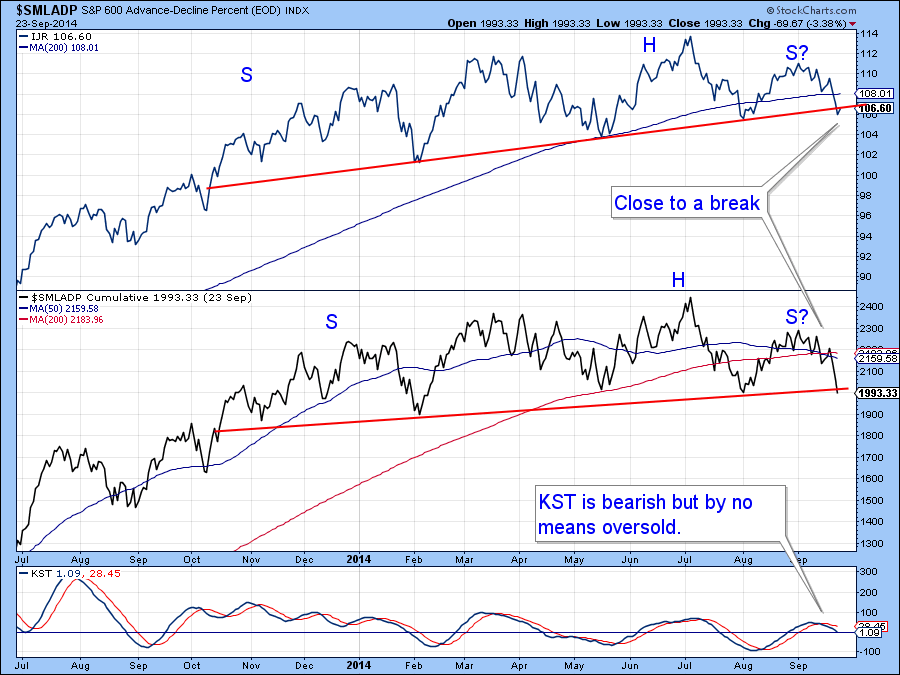
Small Cap Head and Shoulders Top?
by John Murphy,
Chief Technical Analyst, StockCharts.com
A debate is going on within the technical community as to whether or not the Russell 2000 Small Cap Index is in danger of completing a "head and shoulders top". A case can certainly made for it, although it would be an unusual one. The daily bars in...
READ MORE
MEMBERS ONLY
Next Up: Earnings Season

by Tom Bowley,
Chief Market Strategist, EarningsBeats.com
The Fed is winding down its asset purchase program and the historically weak month of September is now behind us. So what's in store next? Earnings season. The stock market sends us signals all the time and given the recent performance of certain sectors and industry groups, we...
READ MORE
MEMBERS ONLY
Two Valuable Gems from Arthur and Greg
Hello Fellow ChartWatchers!
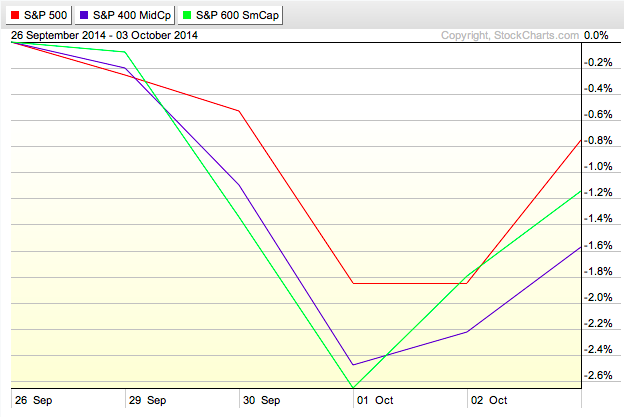
It was definitely a roller coaster ride for stocks this week. The bears were firmly in control on Wednesday but then the Bulls roared back Friday on the strength of the US Employment numbers. A quick glance at the Market Cap PerfChart shows that Large Caps were...
READ MORE
MEMBERS ONLY
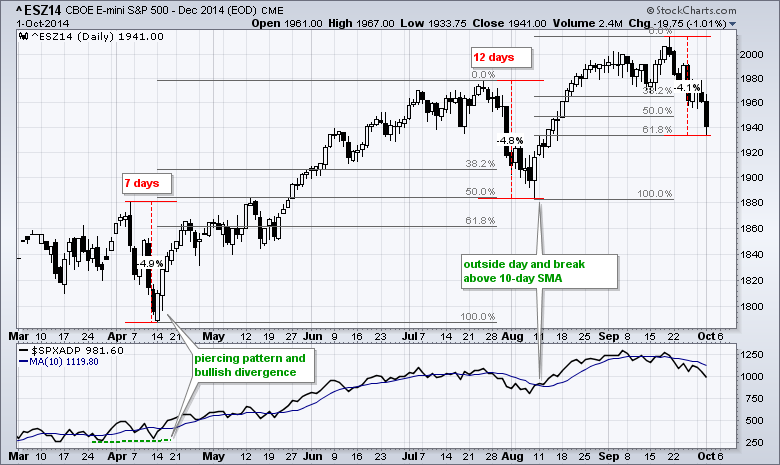
SPY Forges 3-Stick Reversal at Key Retracement (video)
by Arthur Hill,
Chief Technical Strategist, TrendInvestorPro.com
The S&P 500 SPDR (SPY) appears to be putting in another higher low that could signal the resumption of the long-term uptrend. First and foremost the long-term trend is up because SPY recorded a 52-week high less than three weeks ago. In addition, the charts shows a clear...
READ MORE
MEMBERS ONLY

S&P 500 MAINTAINS ITS LONG-TERM UPTREND -- CONSUMER DISCRETIONARY SECTOR ETFS TESTS KEY LEVEL -- MACY'S, NORDSTROM AND TJX LEAD RETAILERS HIGHER -- WHEN IS OVERSOLD REALLY OVERSOLD? -- USING PPO AND RSI FOR TO DEFINE OVERSOLD
by John Murphy,
Chief Technical Analyst, StockCharts.com
S&P 500 MAINTAINS ITS LONG-TERM UPTREND... Link for today's video. Even though the S&P Small-Cap 600 and S&P MidCap 400 are underperforming and have stalled for several months, the S&P 500 remains in a clear uptrend and over 50 points...
READ MORE
MEMBERS ONLY
Smart Beta Funds Leading to Stupid Choices

by Gatis Roze,
Author, "Tensile Trading"
The latest wave on Wall Street’s beach of complexity and opaqueness is a new type of ETF fund referred to as a Smart Beta Fund. I’ve even heard these new funds referred to as Bionic Beta Funds. Consider this a case-in-point and follow-up to my blog last week...
READ MORE
MEMBERS ONLY
Small-caps Lead Intraday Reversal
by Arthur Hill,
Chief Technical Strategist, TrendInvestorPro.com
Stocks were hit with selling pressure in early trading, firmed at midday and then rallied in the afternoon. Small-caps and micro-caps led the way with the Russell 2000 iShares gaining 1% and the Russell MicroCap iShares surging 1.43%. Six of the nine sector SPDRs closed lower, but eight of...
READ MORE
MEMBERS ONLY

SMALL CAPS TEST NECKLINE OF POSSIBLE H&S TOP -- MIDCAP INDEX IS IN DANGER OF BREAKING AUGUST LOW -- SO IS THE NYSE COMPOSITE INDEX -- THE U.S. IS BEING LED LOWER BY FOREIGN SHARES -- THE DOLLAR RALLY MAY BE JUST STARTING
by John Murphy,
Chief Technical Analyst, StockCharts.com
SMALL CAP HEAD AND SHOULDERS TOP?... A debate is going on within the technical community as to whether or not the Russell 2000 Small Cap Index is in danger of completing a "head and shoulders top". A case can certainly made for it, although it would be an...
READ MORE
MEMBERS ONLY
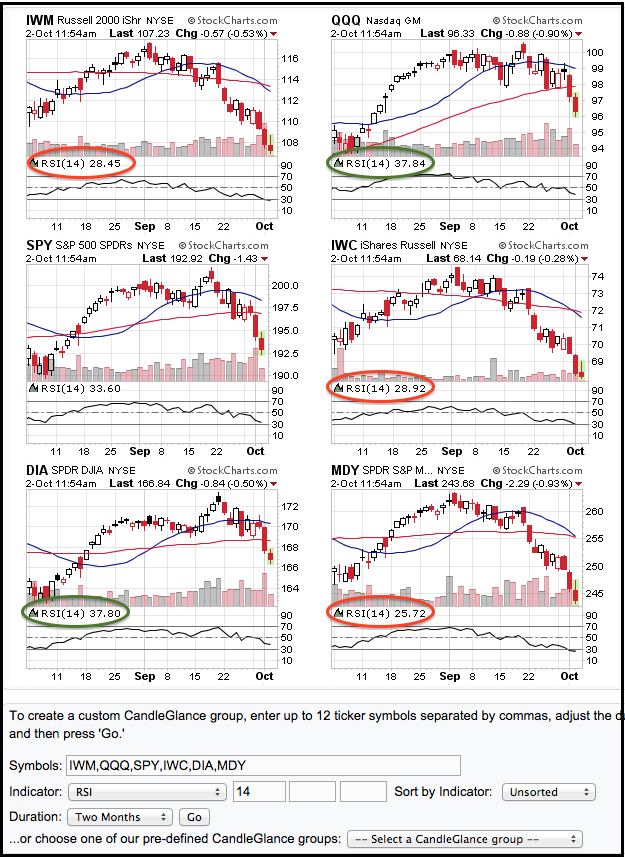
And the Winner for Most Oversold Is.....
by Arthur Hill,
Chief Technical Strategist, TrendInvestorPro.com
The CandleGlance chart below shows six broad-market ETFs with 14-day RSI. Notice that RSI is below 30 for the Russell 2000 iShares, the Russell MicroCap iShares and the S&P MidCap SPDR. With an RSI below 26, the S&P MidCap SPDR is the most oversold of the...
READ MORE
MEMBERS ONLY
SPY Hits Key Retracement - Plus ALXN, KKD, MXIM, SYK
by Arthur Hill,
Chief Technical Strategist, TrendInvestorPro.com
Stocks moved sharply lower on Wednesday with the major index ETFs falling over 1%. The Russell MicroCap iShares (IWC) led the way lower with a 1.71% decline. The materials and energy sectors led the way lower. The utilities provided the only gain. Most industry group ETFs were down. The...
READ MORE
MEMBERS ONLY
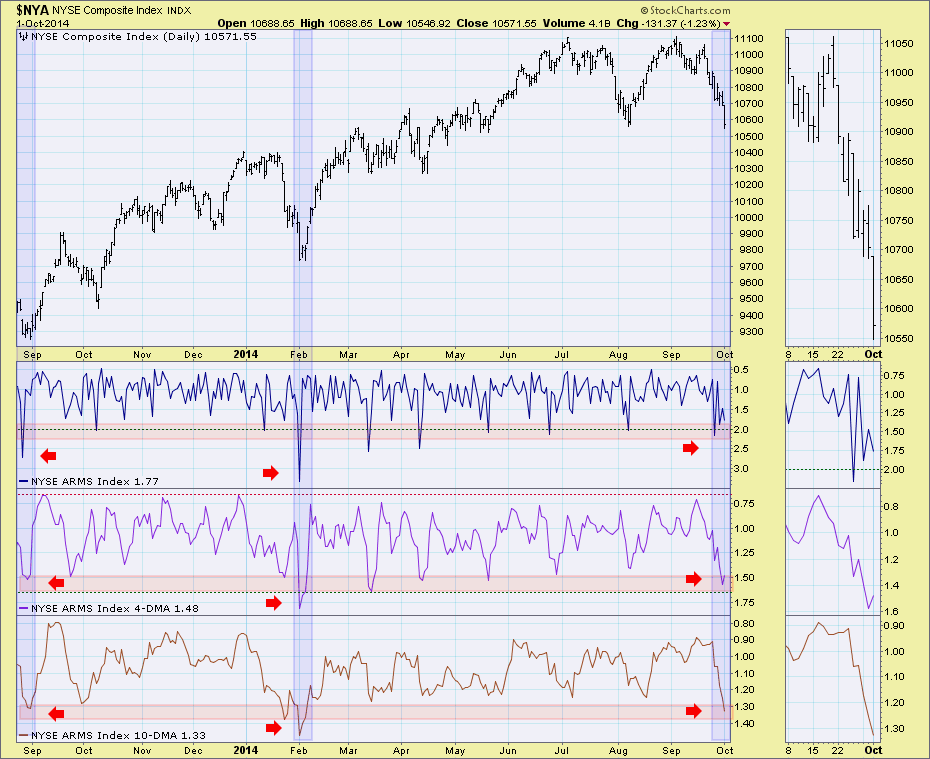
Oversold Readings On The TRIN
by Erin Swenlin,
Vice President, DecisionPoint.com
The TRIN or Short-Term TRading INdex, better known as the Arms Index, is a breadth indicator that was developed by Richard Arms in 1967. The index is calculated by dividing the Advance-Decline Ratio by the Advance-Decline Volume Ratio. Because it is an oscillator, we can use it to identify short-term...
READ MORE
MEMBERS ONLY

SMALL CAPS BREAK SUPPORT -- MIDCAPS MAY BE NEXT -- DOW AND S&P 500 BREAK 50-DAY AVERAGES -- AIRLINES LEAD TRANSPORTS LOWER AS UTILITIES RALLY WITH BONDS -- EMERGING BONDS FALL ON RISING DOLLAR
by John Murphy,
Chief Technical Analyst, StockCharts.com
SMALL CAPS FALL BELOW AUGUST LOW -- MIDCAPS MAY BE NEXT... Arthur Hill and myself have been warning of a potential breakdown in smaller stocks, and the potential damage that could do to the rest of the stock market. That situation has gotten even worse. Chart 1 shows the Russell...
READ MORE
MEMBERS ONLY
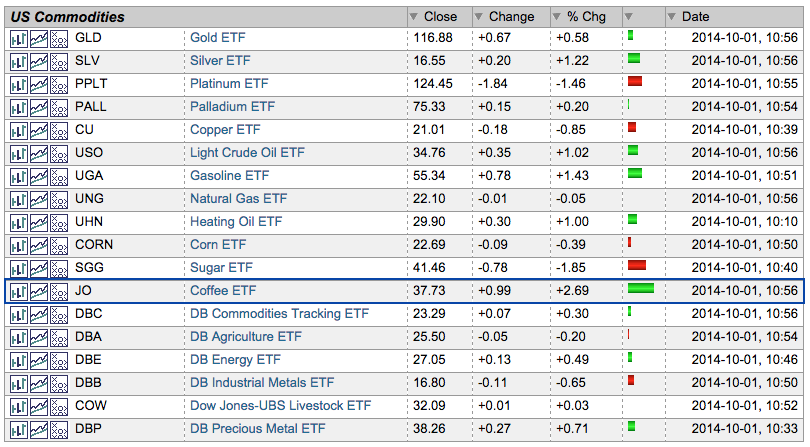
JO Leads the Commodity ETFs
by Arthur Hill,
Chief Technical Strategist, TrendInvestorPro.com
Commodities have been slammed over the last few weeks, but the Coffee ETF (JO) is holding up quite well. JO is up over 20% from its July low and showing relative strength again today. The image below comes from the Market Summary (ETF version), which is a great place to...
READ MORE
MEMBERS ONLY
Correction Extends as Oversold becomes more Oversold
by Arthur Hill,
Chief Technical Strategist, TrendInvestorPro.com
The song remains the same. Market performance deteriorated as we moved down in market cap on Tuesday. The S&P 500 SPDR (SPY) declined .26%, the S&P MidCap SPDR (MDY) fell .89% and the Russell 2000 iShares (IWM) lost 1.51%. Large-caps are the only bastion of...
READ MORE
MEMBERS ONLY
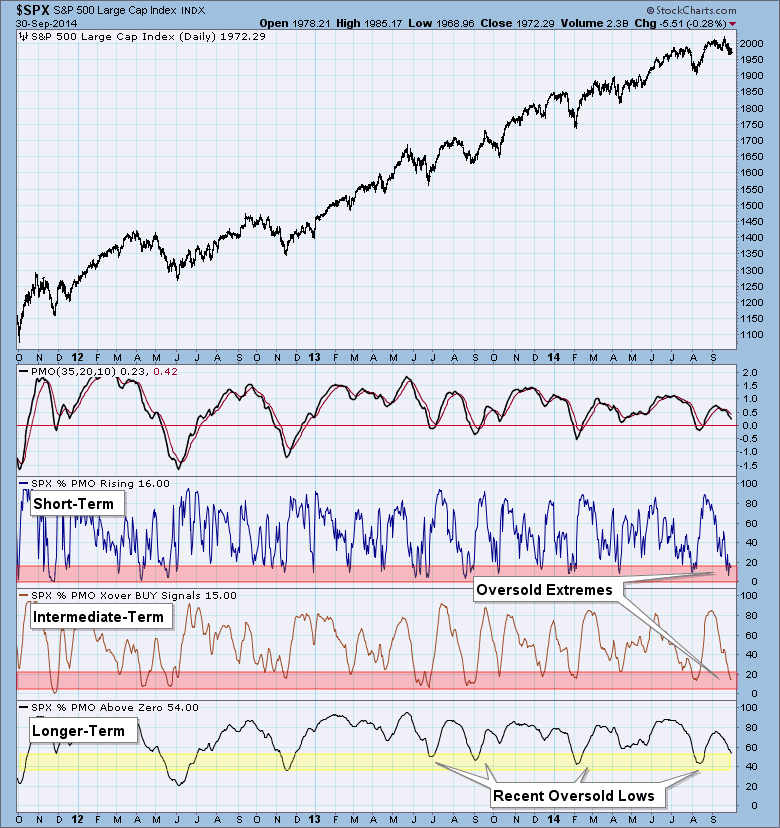
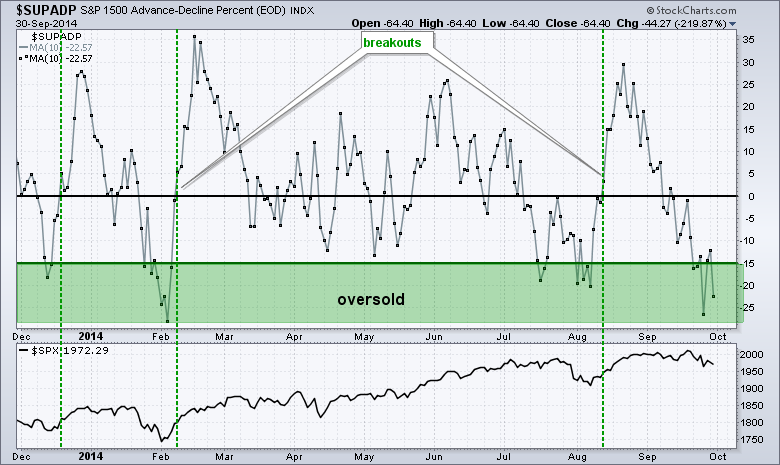
PMO Analysis Identifies Short-Term Extremely Oversold Conditions
by Erin Swenlin,
Vice President, DecisionPoint.com
The Price Momentum Oscillator (PMO) is a measure of internal strength and momentum. You can read more about the PMO in ChartSchool. Every stock, index, ETF, mutual fund has a PMO value each day. It can be rising or falling, have a crossover BUY signal (or not) generated by the...
READ MORE
MEMBERS ONLY
Silver Breaks to the Downside in a Big Way
by Martin Pring,
President, Pring Research
* Negative divergences in the equity market continue to build.
* The rest of the world (EFA) completes a head and shoulders top.
* Credit spreads continue to deteriorate.
* Some commodity indexes break down in a major way, others hold fast.
US Equities
In our last issue my basic conclusion on equities was...
READ MORE
MEMBERS ONLY

UTILITIES SECTOR RETURNS TO THE LEADERBOARD -- APPLE, AT&T AND VERIZON HOLD STRONG -- SCANNING FOR RELATIVE STRENGTH -- BOEING, BERRY, CALLIDUS AND VEECO MAKE THE CUT -- WHEN TO SELL OR EXIT A POSITION
by John Murphy,
Chief Technical Analyst, StockCharts.com
UTILITIES SECTOR RETURNS TO THE LEADERBOARD... Link for today's video. The Utilities SPDR (XLU) is leading the market over the last two days and its StockCharts Technical Rank (SCTR) is improving. Chart 1 shows XLU trading flat since April as it oscillated around the 42 level for several...
READ MORE
MEMBERS ONLY
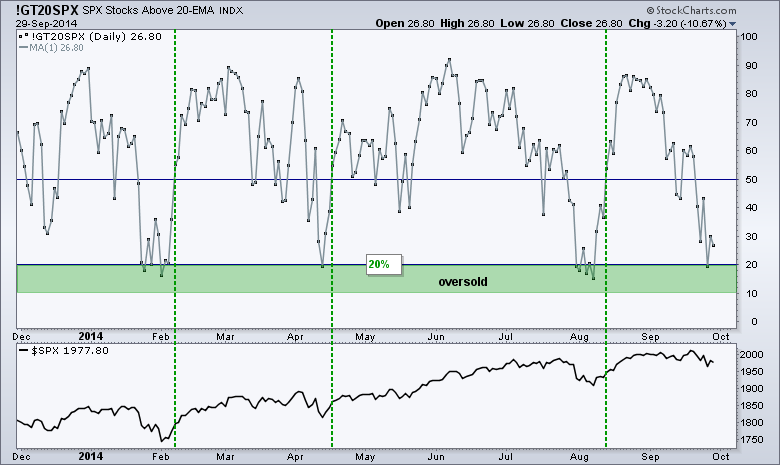
Key Breadth Indicator Becomes Oversold - Plus AWAY, GOOGL, N, USNA
by Arthur Hill,
Chief Technical Strategist, TrendInvestorPro.com
Stocks opened with selling pressure, but buyers stepped in after the first ten minutes and pushed stocks off their lows. Trading was then choppy the rest of the day. The major index ETFs finished with fractional losses. The Russell 2000 Growth iShares (IWO) actually closed with a gain and showed...
READ MORE
MEMBERS ONLY
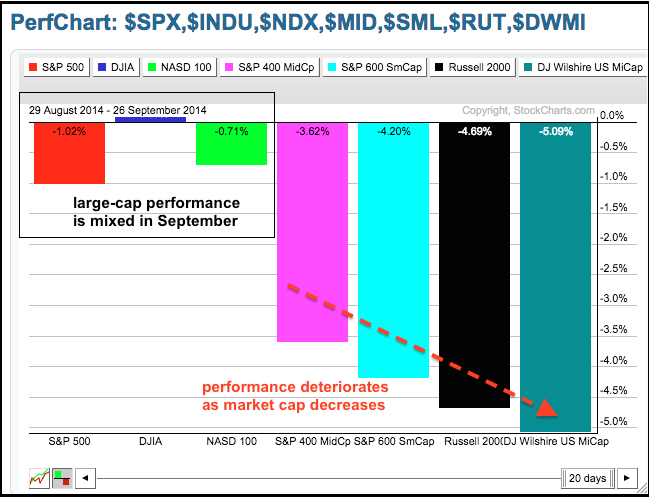
The Smaller They are, the Harder They Fall
by Arthur Hill,
Chief Technical Strategist, TrendInvestorPro.com
September is been rather unkind to mid-caps, small-caps and micro-caps, but large-caps and large-cap techs are holding up ok. The PerfChart below shows the Dow Industrials with a small gain this month, the S&P 500 with a 1% loss and the Nasdaq 100 with a .71% loss. The...
READ MORE
MEMBERS ONLY
Why Market Breadth is So Important (CGMBI)

by Greg Morris,
Veteran Technical Analyst, Investor, and Author
Editor's Note: We are very pleased to announce the return of Greg Morris - the author of "Candlestick Charting Explained", "Investing with the Trend", and "The Complete Guide to Market Breadth Indicators" - to StockCharts.com. Over the course of the coming...
READ MORE
MEMBERS ONLY

DIA AND QQQ HOLD UP THE BEST -- RUSSELL 2000 VALUE UNDERPERFORMS GROWTH -- BIG BANKS LEAD, BUT REGIONAL BANKS LAG -- BIOTECHS REFUSE TO BUCKLE
by John Murphy,
Chief Technical Analyst, StockCharts.com
DIA AND QQQ HOLD UP THE BEST... Link for today's video. Most of the major index ETFs broke below their mid September lows with sharp declines last week, but the Dow Diamonds (DIA) and the Nasdaq 100 ETF (QQQ) held these lows and show relative strength. The Dow...
READ MORE
MEMBERS ONLY

Correction is Limited, but Markets Remain in Risk Off Mode
by Arthur Hill,
Chief Technical Strategist, TrendInvestorPro.com
Stocks remain bifurcated with performance deteriorating as we move down the market-cap scale. The S&P 500 is down 1% this month, the Nasdaq 100 is down .71% and the Dow Industrials is up a fraction. A 1% decline hardly qualifies as a correction. Mid-caps and small-caps have corrected...
READ MORE
MEMBERS ONLY
Single stock rotation within $INDU
by Julius de Kempenaer,
Senior Technical Analyst, StockCharts.com
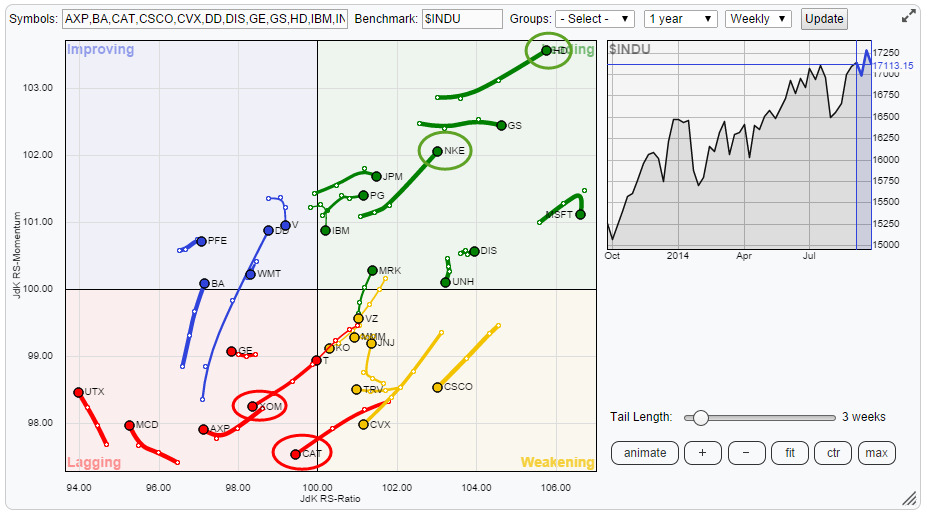
In previous posts I have been looking at asset classes, sectors, countries etc. In this post I am going to throw the 30 constituents of the Dow Jones Industrials index ($INDU) at a Relative Rotation Graph and also look for confirmation between weekly and daily time-frames.
When you open up...
READ MORE
MEMBERS ONLY

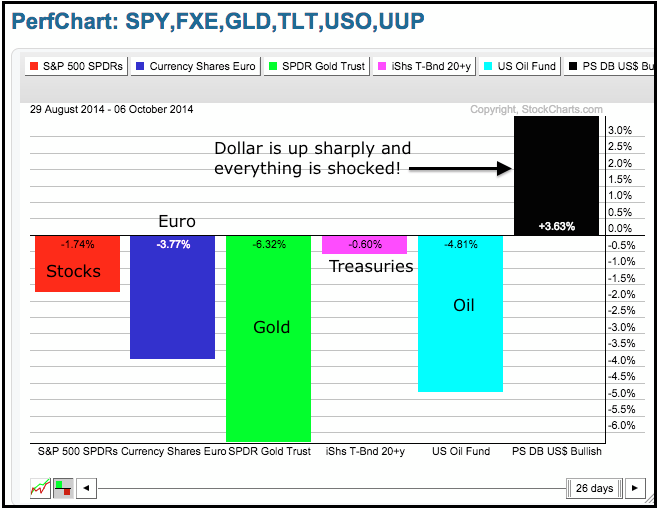
HOW FAR CAN THE S&P 500 CORRECT? -- NOTHING BULLISH ON SMALL-CAP CHART -- MID-CAPS REMAIN IN THE MIDDLE -- 20+ YR T-BOND ETF BOUNCES OF KEY RETRACEMENT -- COMPARING THE 2011 DOLLAR SHOCK WITH 2014 (PERFCHART DEMO) -- OIL FIRMS WITHIN DOWNTREND
by John Murphy,
Chief Technical Analyst, StockCharts.com
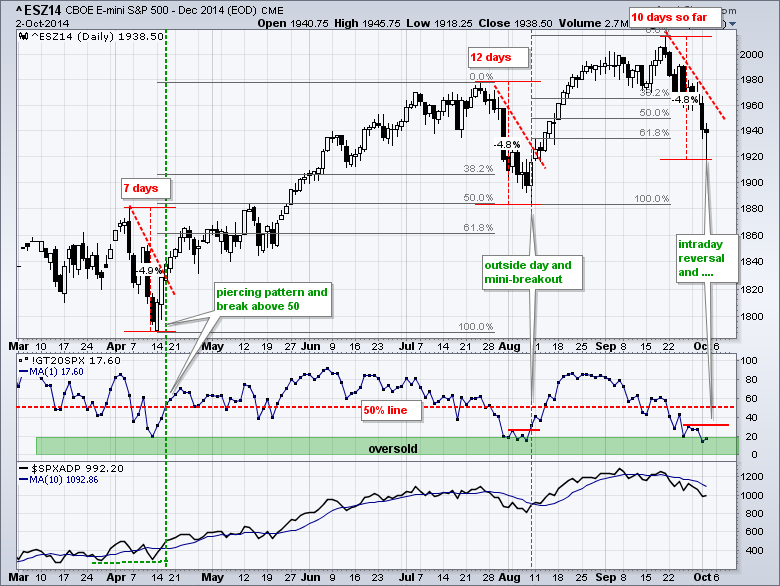
HOW FAR CAN THE S&P 500 CORRECT?... Link for today's video. The S&P 500 is down less than 3% from its all time high and still in a long-term uptrend. Even though this week's decline could extend, it would take a lot...
READ MORE
MEMBERS ONLY

Wall Street's Complexity versus Investors' Profits & Simplicity
by Gatis Roze,
Author, "Tensile Trading"
“Any darn fool can make something complex; it takes a genius to make something simple.” -- Pete Seeger
As a long-time trader, I am living breathing proof that simplicity and profits are positively correlated while complexity and profits are inversely correlated. In other words, as my 25 year investing career...
READ MORE
MEMBERS ONLY
SPY and QQQ Break Down as TLT Breaks Out
by Arthur Hill,
Chief Technical Strategist, TrendInvestorPro.com
Stocks were hit with broad selling pressure with the Nasdaq 100 ETF. leading the major index ETFs lower. The Technology SPDR led the sectors lower with a 2+ percent loss. Almost all industry group ETFs were down. The Gold Miners ETF managed a modest gain and gold got a bounce....
READ MORE
MEMBERS ONLY

GLOBAL STOCKS SELL OFF IN RISING VOLUME -- A LOT OF MOVING AVERAGES HAVE BEEN BROKEN -- HIGH YIELD BOND ETF BREAKS 200-DAY LINE -- FOREIGN STOCKS FALL AS WELL -- A RISING DOLLAR IS HURTING EMERGING MARKET CURRENCIES AND STOCKS
by John Murphy,
Chief Technical Analyst, StockCharts.com
NASDAQ AND S&P 500 BREAK 50-DAY LINES... Chart 1 shows the S&P 500 SPDRS closing below its 50-day line today in heavy trading. That's a negative combination. Chart 2 shows the Nasdaq Composite Index doing the same. Their daily MACD lines remain decidedly negative....
READ MORE
MEMBERS ONLY
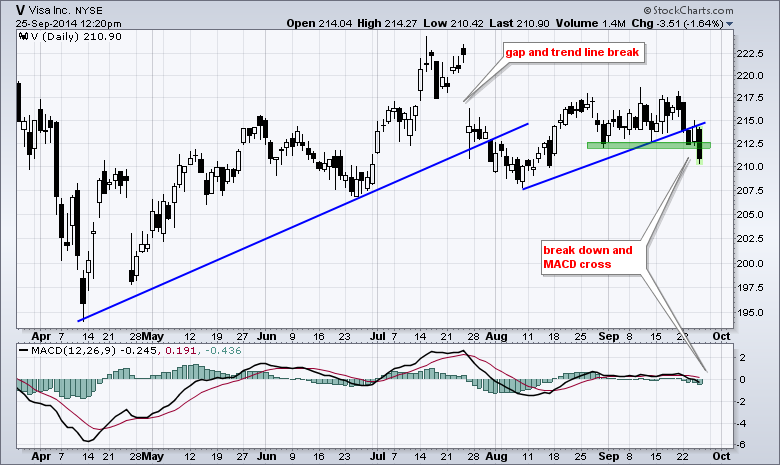
Highest Priced Dow Stock Weighs with a Breakdown
by Arthur Hill,
Chief Technical Strategist, TrendInvestorPro.com
The Dow Jones Industrial Average is a price-weighted average and this means the stocks with the highest prices carry the most weight. Visa (V) is the highest priced Dow stock and it was down around 1.5% at midday, thus weighing on the Dow today. The chart below shows Visa...
READ MORE
MEMBERS ONLY
SPY Bounces off Support - QQQ Holds Support - Plus JO, MRVL, YUM, UA
by Arthur Hill,
Chief Technical Strategist, TrendInvestorPro.com
Stocks got an oversold bounce on Wednesday with QQQ leading the way (+1.07%). The bounces were relatively modest, but QQQ and SPY managed to hold some important short-term support levels. Materials, healthcare and consumer discretionary led the sector SPDRs higher. The consumer discretionary got a big boost from the...
READ MORE
MEMBERS ONLY
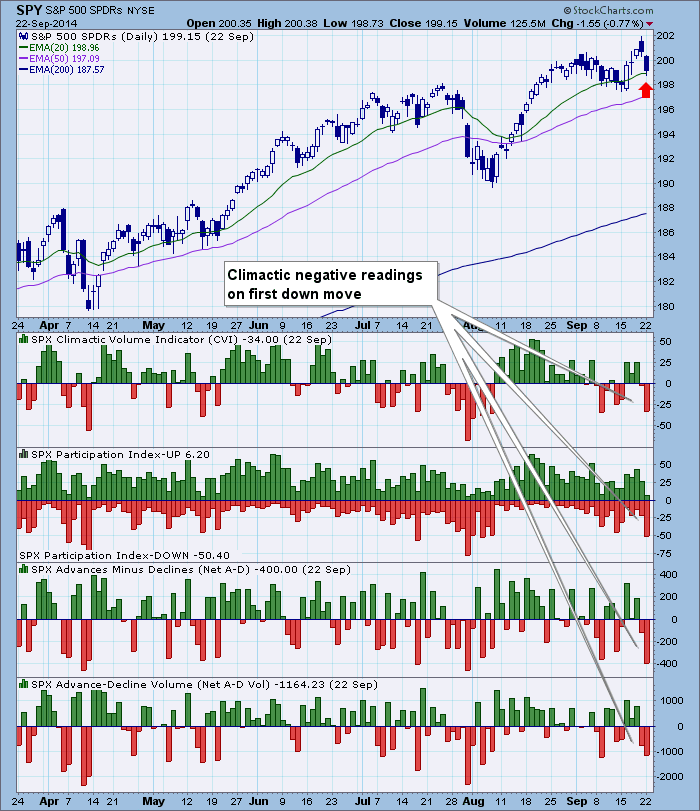
Ultra-Short-Term Indicator Climactic Readings: Initiation or Exhaustion?
by Erin Swenlin,
Vice President, DecisionPoint.com
At ChartCon last month, I had quite a few questions from attendees regarding our ultra-short-term indicators and how you distinguish a positive or negative spike in readings as either a price initiation or exhaustion. We had a great example this week. Readers of the DP Daily Update were able to...
READ MORE
MEMBERS ONLY
Global Equities and Some US Averages are Just Above Critical Support
by Martin Pring,
President, Pring Research
* Small cap stocks on the verge of a major breakdown.
* Gold shares violate important up trend line.
* Dollar Index due for a correction within a primary bull market.
Click here for the video version.
For the last few weeks I have been pointing out the gradually deteriorating technical position but...
READ MORE
