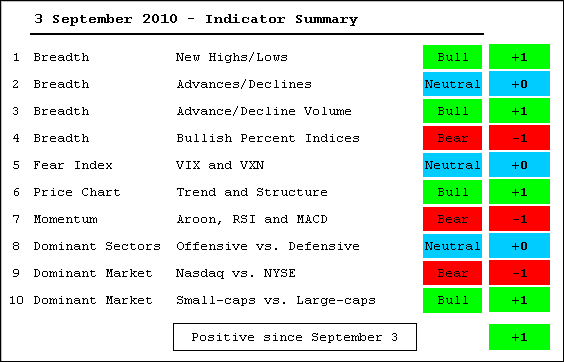
MEMBERS ONLY
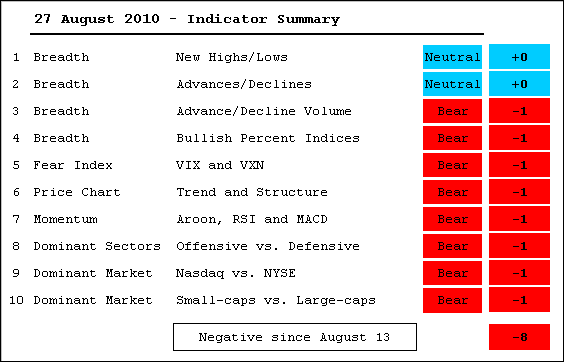
Indicator Summary remains positive

by Arthur Hill,
Chief Technical Strategist, TrendInvestorPro.com
The indicator summary has been switching from positive to negative since May. This coincides with a trading range in the S&P 500 since May. This week the Bullish Percent Indices and Volatility Indices flipped into bull mode. While the majority of indicators are bullish overall, many remain vulnerable...
READ MORE
MEMBERS ONLY

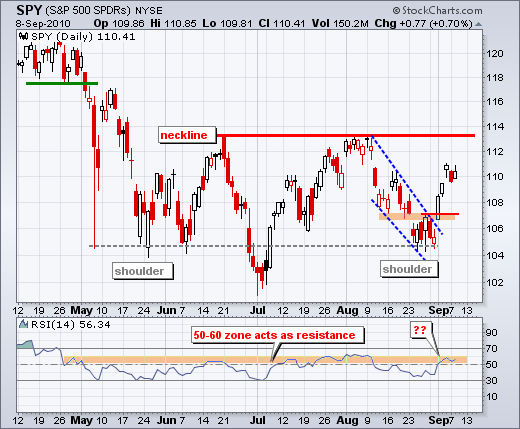
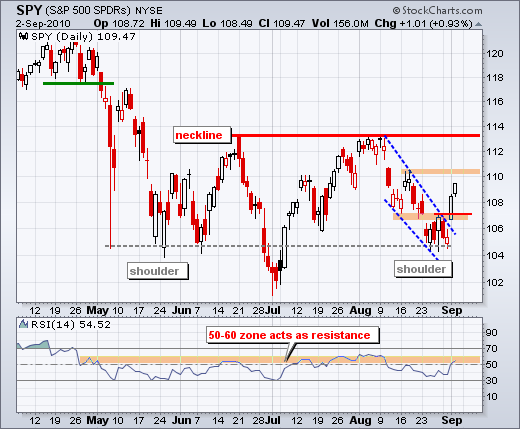
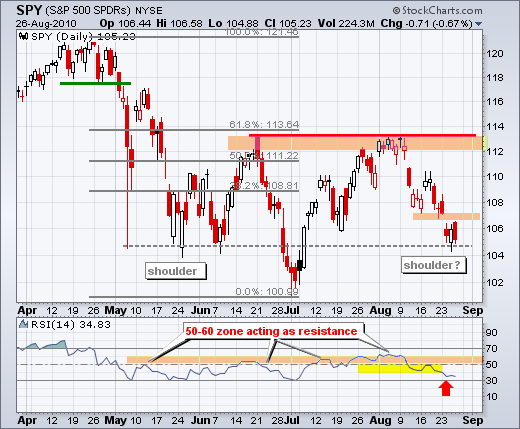
SPY labors higher
by Arthur Hill,
Chief Technical Strategist, TrendInvestorPro.com
There is no real change on the daily chart as SPY labors higher. The ETF fell back with a red candlestick on Tuesday, edged higher with a small white candlestick on Wednesday and then formed a filled black candlestick yesterday. Black means the close was up from the prior close....
READ MORE
MEMBERS ONLY
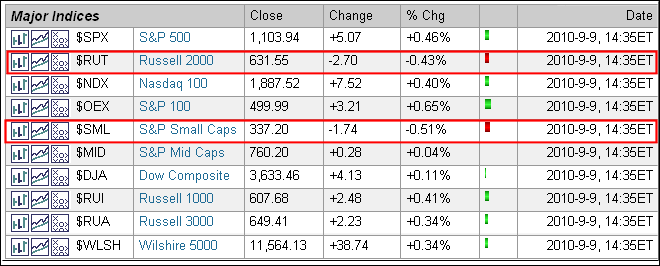
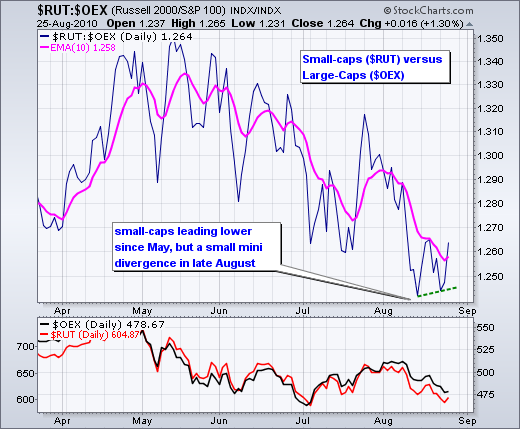
Small-caps show relative weakness
by Arthur Hill,
Chief Technical Strategist, TrendInvestorPro.com
Even though the market as a whole was up on Thursday afternoon, a quick look at the intraday market summary reveals some relative weakness in small-caps. Of the 10 major indices shown, the Russell 2000 ($RUT) and the S&P 600 SmallCap Index ($SML) are the only two losers....
READ MORE
MEMBERS ONLY

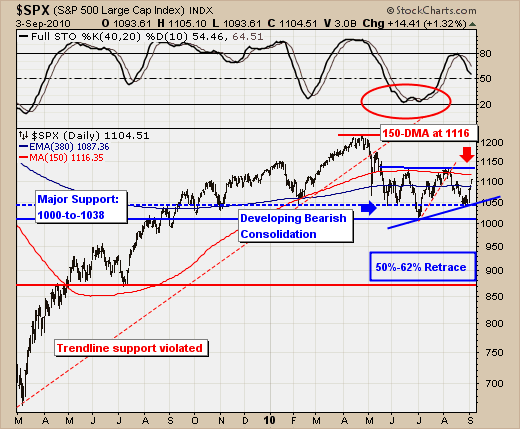
S&P 500 NEEDS MORE VOLUME TO CLEAR OVERHEAD RESISTANCE -- BOND YIELDS ARE STILL IN DOWNTREND BUT LOOK OVERSOLD -- THAT COULD LEAD TO HIGHER YIELDS -- BOND FUND TESTS SUPPORT LINE

by John Murphy,
Chief Technical Analyst, StockCharts.com
S&P 500 MOVES UP TO CHALLENGE 200-DAY LINE... My message from last Thursday described a potential "head and shoulders" bottom forming in the S&P 500 with the August low looking like a "right shoulder". That potentially bullish pattern suggests that the market...
READ MORE
MEMBERS ONLY
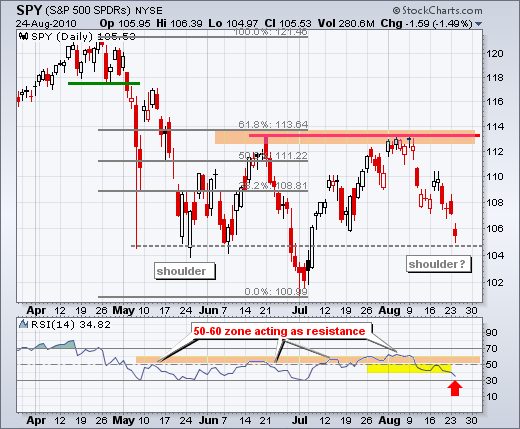
SPY consolidates in resistance zone
by Arthur Hill,
Chief Technical Strategist, TrendInvestorPro.com
For short-term traders, SPY is currently caught between a rock and a hard place. The swing is clearly up after last week's breakout, but the ETF became overbought with Friday's close above 111. Also note that the ETF remains in a large trading range that extends...
READ MORE
MEMBERS ONLY

IWM HITS RESISTANCE AND STALLS -- SETTING FIRST SUPPORT LEVELS FOR DIA AND QQQQ -- SEMIS BATTLE NEW RESISTANCE ZONE -- INTC AND AMAT SHOW RELATIVE WEAKNESS -- AMTL AND CY SHOWS RELATIVE STRENGTH -- EURO UNDER PRESSURE AS SOVEREIGN DEBT ISSUES RETURN
by John Murphy,
Chief Technical Analyst, StockCharts.com
IWM HITS RESISTANCE AND STALLS ... Link for todays video. Despite leading the market lower the last few months, small-caps led the market higher over the last two weeks. However, chart 1 shows the Russell 2000 ETF (IWM) running into resistance around 64 over the last few days. Resistance in this...
READ MORE
MEMBERS ONLY

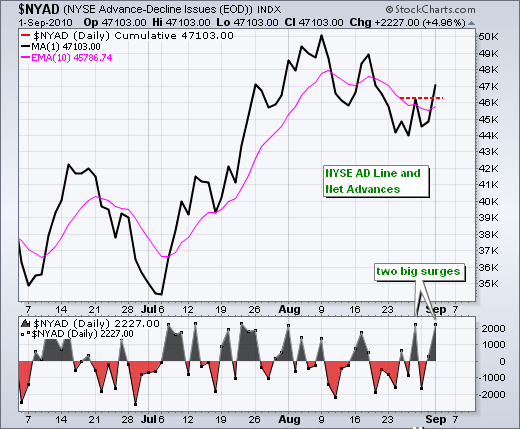
Net New Highs surge on TSX
by Arthur Hill,
Chief Technical Strategist, TrendInvestorPro.com
With a big move in the TSX Composite ($TSX) over the last two weeks, Net New Highs surged to their highest level since April. Notice that Net New Highs turned positive in early July, strengthened in August and then broke above +50 in late August.
Click this image for a...
READ MORE
MEMBERS ONLY

SPY backs off short-term resistance
by Arthur Hill,
Chief Technical Strategist, TrendInvestorPro.com
On the daily chart, the S&P 500 ETF (SPY) is currently on an upswing within a larger consolidation. This larger consolidation is, of course, the inverse head-and-shoulders pattern. Unconfirmed, this pattern is just one big consolidation or trading range. Confirmed, with a break above the June-August highs, it...
READ MORE
MEMBERS ONLY

SILVER LEADS TEST OF 2010 HIGHS AND IS STARTING TO OUTPERFORM GOLD -- THAT MAY GIVE A BOOST TO SILVER STOCKS LIKE CDE, HL, AND PAAS -- NEWMONT MINING NEARS RECORD HIGH IN GOLD GROUP -- MARKET VECTORS GOLD INDEX NEARS UPSIDE BREAKOUT
by John Murphy,
Chief Technical Analyst, StockCharts.com
SILVER LEADS TEST OF 2010 HIGHS... I wrote a bullish message on precious metal assets last Tuesday which showed gold and silver prices nearing test of their 2010 high. That test has come a bit sooner for silver. Chart 1 shows Gold Trust Shares moving closer to its June high...
READ MORE
MEMBERS ONLY

SPY hits short-term resistance
by Arthur Hill,
Chief Technical Strategist, TrendInvestorPro.com
Last week's breakout and extended surge reversed the August downtrend. Also note that SPY formed a higher low in late August. With strong breadth and strong follow through on Thursday and Friday, this breakout looks like the start of an extended advance. However, SPY is already short-term overbought...
READ MORE
MEMBERS ONLY
REPORTING LIVE FROM A SHARPCHART NEAR YOU!
Hello Fellow ChartWatchers,
Today we're happy to announce the launch of our new tutorial video area. You and find it at https://youtube.com/stockchartscom. YouTube members can subscribe to that "channel" and get notified whenever we post a new one. (We'll also announce...
READ MORE
MEMBERS ONLY
WILL EARLY SEPTEMBER RALLY HAVE STAYING POWER?

by Richard Rhodes,
Founder and President, Rhodes Capital Management and Rhodes Trading Group
The summer is coming to an end for all practical purposes, with many traders returning from their vacations to a budding sharp rally. This presents an interesting situation for traders, for the historically weakest period lies directly ahead - the September/October time frame. Hence, the question is whether last...
READ MORE
MEMBERS ONLY
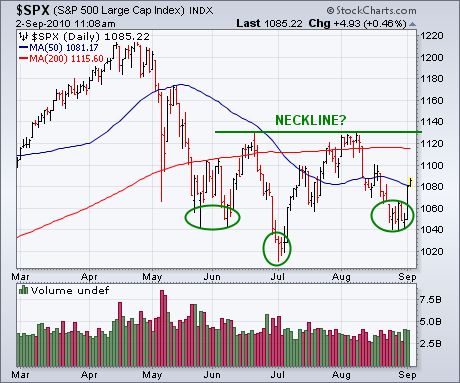
IS A HEAD AND SHOULDERS BOTTOM FORMING IN STOCK?
by John Murphy,
Chief Technical Analyst, StockCharts.com
Today's message is going to represent a shift in emphasis in favor of stocks. As you know, I've been writing since the spring about the huge move into bonds and out of stocks owing to fears of economic slowdown and deflation. I've also written...
READ MORE
MEMBERS ONLY
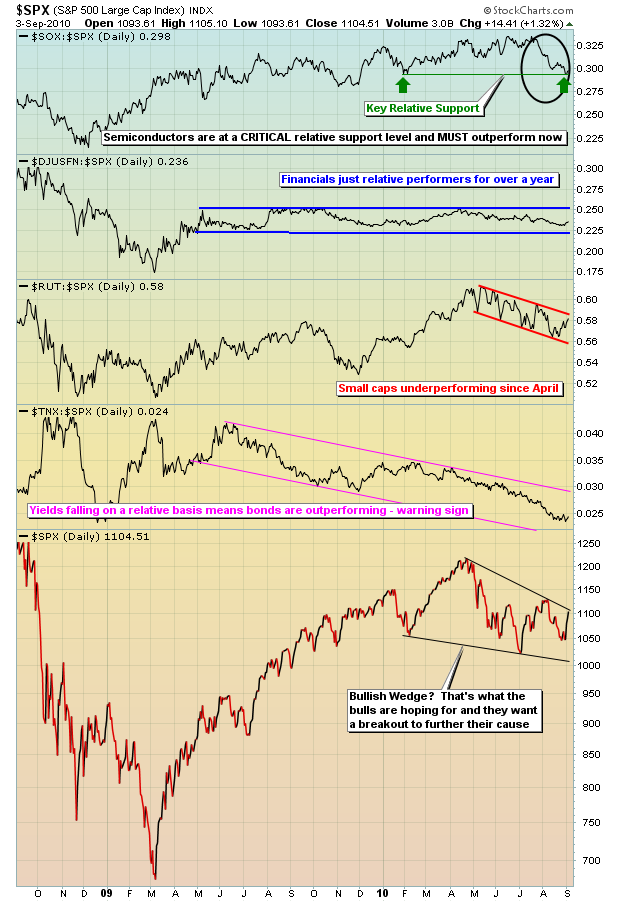
FOUR KEYS TO A CONTINUING RALLY

by Tom Bowley,
Chief Market Strategist, EarningsBeats.com
Semiconductors. Financials. Small Caps. 10 Year Treasury Yields.
Take a look at the following chart as the relative performance of each of the above is plotted against the S&P 500:
These are four of the biggest reasons why the market hasn't been able to sustain a...
READ MORE
MEMBERS ONLY
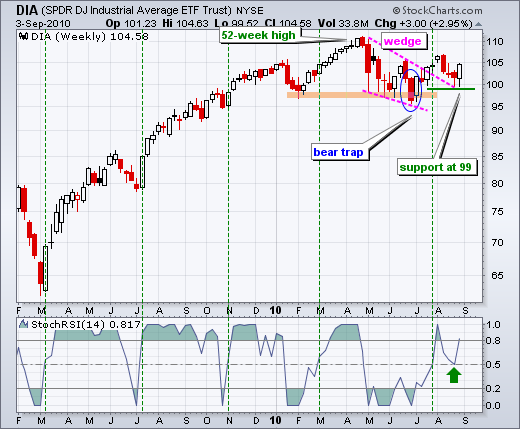
FIVE POSITIVES FOR THE DOW SPDR IN 2010
by Arthur Hill,
Chief Technical Strategist, TrendInvestorPro.com
Stocks have been largely range bound throughout 2010, but the positives still outweigh the negatives overall. Chart 7 shows the **Dow SPDR (DIA)** starting the year just below 105 in January and finishing just below 105 this week. While it appears that DIA has nothing to show for eight months...
READ MORE
MEMBERS ONLY
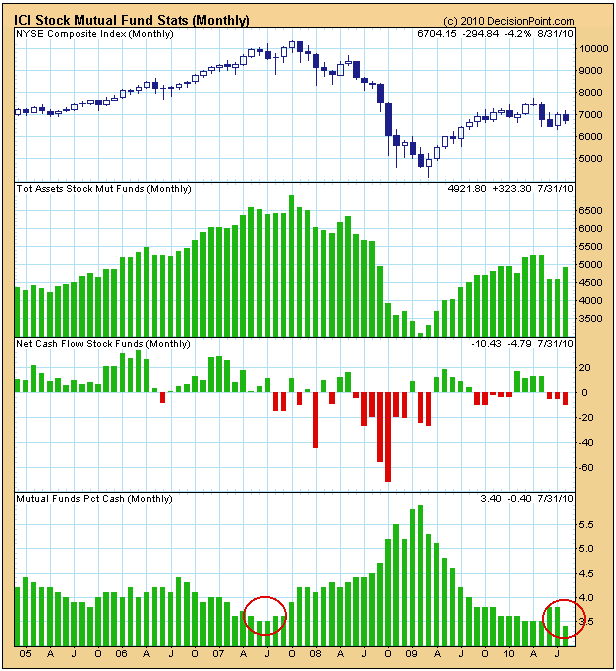
ICI MUTUAL FUND STATISTICS

by Carl Swenlin,
President and Founder, DecisionPoint.com
The Investment Company Institute (ici.org) compiles statistics on mutual funds and publishes them monthly. (There is a one month delay between the end of the month being reported and publication.) Decision Point has been collecting these data for almost five years, and we finally have enough to start charting...
READ MORE
MEMBERS ONLY

YIELDS RISE AND BONDS FALL ON JOBS REPORT -- SMALL-CAPS START SHOWING RELATIVE STRENGTH -- UTILITIES UNDER PRESSURE AS RATES SURGE -- XLB AND XLY ARE ALREADY CHALLENGING SUMMER HIGHS -- SPY AND DIA HOLD WEDGE BREAKOUTS
by John Murphy,
Chief Technical Analyst, StockCharts.com
YIELDS RISE AND BONDS FALL ON JOBS REPORT... Link for todays video. A better-than-expected employment report combined with positive revisions to July weighed on bonds. Bonds surged in August as the double-dippers took center stage. Sign of weakness in the economy favor lower interest rates and lose monetary policy. Todays...
READ MORE
MEMBERS ONLY
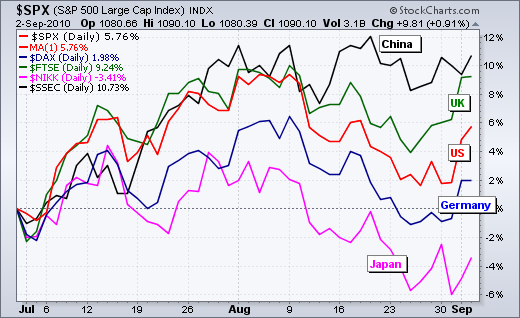
China leads the summer rally $SSEC
by Arthur Hill,
Chief Technical Strategist, TrendInvestorPro.com
It has been quite a roller coaster the last two months. The S&P 500 (red) surged in July, fell sharply in August and surged over the last few days. While the S&P 500 went on its roller coaster ride, the Shanghai Composite (black) surged in July...
READ MORE
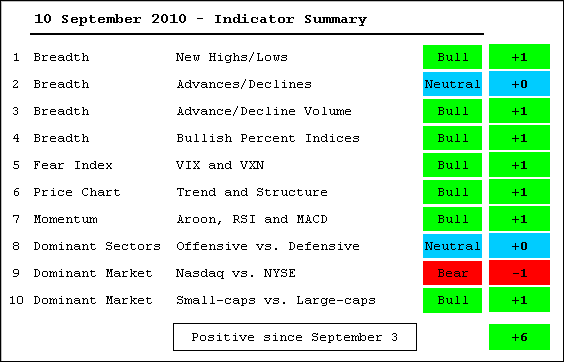
MEMBERS ONLY
Indicator Summary turns positive
by Arthur Hill,
Chief Technical Strategist, TrendInvestorPro.com
Big swings continue to whipsaw the indicator summary. The S&P 500 first closed below 1100 on May 20th. Since then the index has crossed the 1100 level at least nine times as the index trades within a large consolidation. There have been four swings of at least 8%...
READ MORE
MEMBERS ONLY
Setting first resistance for SPY
by Arthur Hill,
Chief Technical Strategist, TrendInvestorPro.com
There is not much change on the daily chart. SPY held above its July low and found support near the May-June lows. With a channel breakout, the ETF forged a reaction low and the inverse head-and-shoulders becomes a possibility. Neckline resistance resides around 113 and this is the next big...
READ MORE
MEMBERS ONLY

WITH FOUR-YEAR CYCLE BOTTOM DUE IN SECOND HALF OF YEAR, IT MIGHT NOT BE TOO SOON TO START REALLOCATING SOME FUNDS OUT OF BONDS AND INTO STOCKS -- SO IS THE FACT THAT A HEAD AND SHOULDERS BOTTOM MAY BE FORMING IN THE S&P 500
by John Murphy,
Chief Technical Analyst, StockCharts.com
IS A HEAD AND SHOULDERS BOTTOM FORMING IN STOCK?... Today's message is going to represent a shift in emphasis in favor of stocks. As you know, I've been writing since the spring about the huge move into bonds and out of stocks owing to fears of...
READ MORE
MEMBERS ONLY
A breakout on big breadth
by Arthur Hill,
Chief Technical Strategist, TrendInvestorPro.com
Stocks around the world surged on Wednesday with many stock indices breaking out of their August downtrends. In the US, small-caps led the way higher with the Russell 2000 surging 3.81%. The Nasdaq and S&P 500 were both up around 3%. All sectors were up with consumer...
READ MORE
MEMBERS ONLY

A sea of green as Rowan leads
by Arthur Hill,
Chief Technical Strategist, TrendInvestorPro.com
The S&P Sector Market Carpet shows a sea of green on Monday. All sectors were up sharply with consumer discretionary (+1.7) and technology (+1.6) showing the biggest average gains. Keep in mind that these numbers represent the average gain or loss for all stocks in the...
READ MORE
MEMBERS ONLY

DIA AND QQQQ FILL THEIR GAPS WITH BREAKOUTS -- OFFENSIVE SECTORS GAP AND SURGE HIGHER -- EURO SURGES AS RISK-ON TRADE RESURFACES -- BONDS DECLINE AS MONEY FLEES SAFETY -- SHANGHAI COMPOSITE SHOWS RELATIVE STRENGTH -- EUROPEAN INDICES SURGE OVER 2%
by John Murphy,
Chief Technical Analyst, StockCharts.com
DIA AND QQQQ FILL THEIR GAPS WITH BREAKOUTS... Link for todays video. Stocks moved sharply higher on Wednesday with a broad advance that lifted most boats. All major indices were up sharply. All sectors were higher with the biggest gains coming from industrials, energy, finance and consumer discretionary. Chart 1...
READ MORE
MEMBERS ONLY

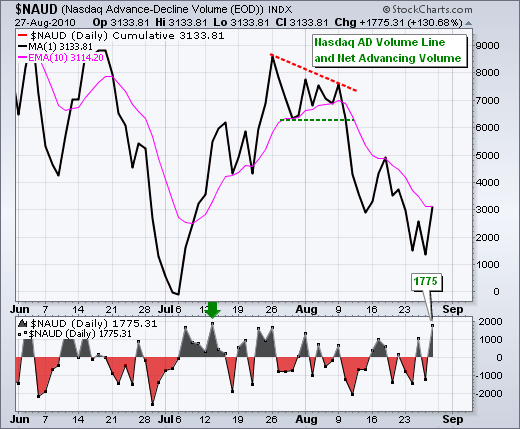
SPY consolidates within downtrend
by Arthur Hill,
Chief Technical Strategist, TrendInvestorPro.com
The overall trend for most short-term indicators remains down and important resistance levels were established with Monday's decline. As with the major index ETFs, I will be watching the Friday-Monday highs for a breakout and trend reversal. The charts below show the Nasdaq AD Volume Line and NYSE...
READ MORE
MEMBERS ONLY

Nasdaq breadth leads lower
by Arthur Hill,
Chief Technical Strategist, TrendInvestorPro.com
The AD Line and cumulative Net New Highs line shows relative weakness in Nasdaq stocks. From the breadth indicators page at Stockcharts.com, the chart below shows these two Nasdaq indicators moving sharply lower the last three weeks. The cumulative Net New Highs lines for the NYSE and Amex are...
READ MORE
MEMBERS ONLY

GOLD AND SILVER PRICES CONTINUE TO RALLY -- MARKET VECTORS GOLD MINERS INDEX MAY BE NEARING MAJOR BULLISH BREAKOUT -- BARRICK GOLD NEARS 52-WEEK HIGH-- GOLD SHARES ARE STARTING TO OUTPACE BULLION
by John Murphy,
Chief Technical Analyst, StockCharts.com
GOLD AND SILVER ETFS CONTINUE TO RISE... With stocks and most commodities on the defensive, money continues to move into precious metal assets. As a result, gold and silver prices are higher again today. Chart 1 shows the Gold Trust Shares (GLD) approaching a test of their summer highs. Chart...
READ MORE
MEMBERS ONLY

SPY establishes new resistance
by Arthur Hill,
Chief Technical Strategist, TrendInvestorPro.com
After big gains on Friday, stocks gave it back with big losses on Monday. A shallow pullback on modest breadth would have been positive, but yesterday's decline did not fit that bill. All nine sectors were lower, declines out numbered advances 4 to 1 and declining volume swamped...
READ MORE
MEMBERS ONLY

SMALL-CAPS LEAD MARKET LOWER -- GAPS MARK RESISTANCE FOR QQQQ, SPY AND DIA -- FINANCIALS CONTINUE TO WEIGH OVERALL -- SEMIS BUILD ON SUPPORT BREAK -- RETAILERS DRAG DOWN CONSUMER DISCRETIONARY SECTOR
by John Murphy,
Chief Technical Analyst, StockCharts.com
SMALL-CAPS LEAD MARKET LOWER... Link for todays video. Stocks moved broadly lower on Monday with small-caps leading the way. The Dow fell around 141 points to test the 10,000 mark at the close (-1.4%). The S&P 500 and Nasdaq were both down around 1.5%. The...
READ MORE
MEMBERS ONLY

Dow bounces near key retracement
by Arthur Hill,
Chief Technical Strategist, TrendInvestorPro.com
With the close at 10040 on Tuesday, the Dow retraced around 61.8% of its prior advance (Jul-Aug). This Fibonacci retracement sometimes marks a reversal zone. The Dow managed to recover after dip below 10000 on Friday and close above 10100. Resistance might not be far off through. The 50-day...
READ MORE
MEMBERS ONLY
Stocks surge with strong breadth
by Arthur Hill,
Chief Technical Strategist, TrendInvestorPro.com
After a rather volatile first hour on Friday, stocks found their footing and moved steadily higher throughout the day. Friday's action produced a few positives as we move into an important week. First, stocks managed to overcome early weakness. SPY moved below 104.5 in the first 40...
READ MORE
MEMBERS ONLY

RUSSELL 2000 ETF TESTS JULY LOW -- A LARGE HEAD-AND-SHOULDERS FOR XLF -- FALLING CHANNEL TARGET FOR XLY -- INTERNET ETFS HOVERING JUST ABOVE IMPORTANT SUPPORT -- NASDAQ AD LINE BREAKS JULY LOW -- NYSE NET NEW HIGHS DIP INTO NEGATIVE TERRITORY
by John Murphy,
Chief Technical Analyst, StockCharts.com
RUSSELL 2000 ETF TESTS JULY LOW ... Link for todays video. The Russell 2000 ETF (IWM) is the first of the major index ETFs to test its July low. We have been talking about relative weakness in small-caps and this is just further evidence. The Dow SPDR (DIA) and S&...
READ MORE
MEMBERS ONLY
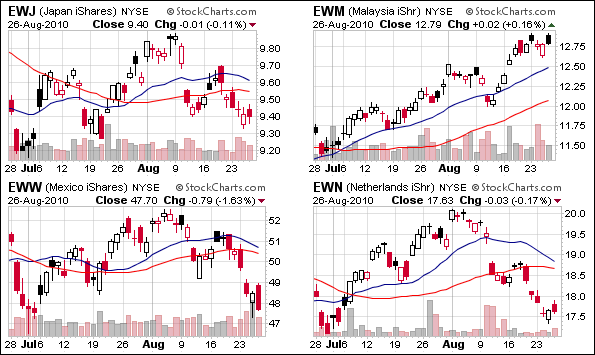
Malaysia bucks the world trend
by Arthur Hill,
Chief Technical Strategist, TrendInvestorPro.com
Stocks markets around the world have been moving lower the last few weeks, but there are some pockets of strength to be found in Asia. As this snippet from the CandleGlance International iShares page shows, the Malaysia iShares (EWM) shows relative strength as it trades near its highs for the...
READ MORE
MEMBERS ONLY
Indicator Summary remains negative
by Arthur Hill,
Chief Technical Strategist, TrendInvestorPro.com
The indicator summary moved further into the red as the Bullish Percent Indices turned bearish and the S&P 500 Volatility Index ($VIX) broke above its mid July high. The NYSE AD Line and NYSE Net New Highs are the only two indicators keeping this summary from total negativity....
READ MORE
MEMBERS ONLY
Stocks move lower after opening higher
by Arthur Hill,
Chief Technical Strategist, TrendInvestorPro.com
Stocks started the day on firm footing after jobless claims were better-than-expected. However, the morning pop did not last long as SPY moved into negative territory by 11AM. Selling pressure continued throughout the day and the index closed near its lows. Stocks failed to rally on "good" news...
READ MORE
MEMBERS ONLY

RISING YEN HURTS JAPANESE MARKET -- RISING YEN MAY ALSO BE ADDING TO GLOBAL DEFLATION PRESSURE
by John Murphy,
Chief Technical Analyst, StockCharts.com
RISING YEN PUSHES NIKKEI TO NEW LOW... A rising Japanese yen is normally bad for Japanese stocks. Chart 1 demonstrate their inverse relationship. It shows the the Nikkei 225 (orange line) falling below 9000 for the first time in more than year which makes it the weakest of the world&...
READ MORE
MEMBERS ONLY
SPY finds support with modest bounce
by Arthur Hill,
Chief Technical Strategist, TrendInvestorPro.com
Stocks started the day week, but recovered and closed near the highs for the day. The Dow SPDR (DIA) firmed near its mid July low, the Nasdaq 100 ETF (QQQQ) formed a bullish engulfing near its 62% retracement and the Russell 2000 ETF (IWM) bounced off its early July low....
READ MORE
MEMBERS ONLY

AAPL dominates Nasdaq 100 and QQQQ
by Arthur Hill,
Chief Technical Strategist, TrendInvestorPro.com
A look at the Market Indices Carpet in market cap mode shows Apple (AAPL) taking up the most real estate with the largest rectangle. This means Apple carries the most weight in the index. Click the "Nasdaq 100" header to focus on the Nasdaq 100. Click the market...
READ MORE
MEMBERS ONLY

EXPANDING ON THE RISK-ON RISK-OFF TRADE -- WHAT ARE BONDS TELLING THE MARKET? -- OIL AND GASOLINE POINT TO WEAK DEMAND -- BASE METALS ETF BACKS OFF RETRACEMENT RESISTANCE -- SILVER BREAKS TRIANGLE RESISTANCE
by John Murphy,
Chief Technical Analyst, StockCharts.com
EXPANDING ON THE RISK-ON RISK-OFF TRADE... Link for todays video. John Murphy and I have been writing a lot on the movement away from risk in favor of relative safety. I showed a PerfChart on August 6th showing the beginnings of a shift from the risk-on trade to risk-off trade....
READ MORE
MEMBERS ONLY
SPY tests May-June lows
by Arthur Hill,
Chief Technical Strategist, TrendInvestorPro.com
With a gap down and sharp decline, the S&P 500 ETF (SPY) closed below 106 for the first time since early July. Selling pressure has been quite intense since August 9. SPY has closed down 9 of the last 11 days (red candlesticks) with three sizable down gaps...
READ MORE
