MEMBERS ONLY

XLU bucks the trend

by Arthur Hill,
Chief Technical Strategist, TrendInvestorPro.com
Stocks were down sharply in afternoon trading on Tuesday, but the Utilities (SPDR) was bucking the trend with a small gain. As this screen grab from the Market Summary page shows, XLU was the only sector in positive territory. Looks like utilities like low interest rates.
Click this image for...
READ MORE
MEMBERS ONLY

NEGATIVE DOW THEORY TRENDS -- TRANSPORTS LEAD INDUSTRIALS LOWER AS BOTH NEAR DOW THEORY SELL SIGNAL -- UTILITIES OUTPERFORM INDUSTRIALS AND TRANSPORTS WHICH IS ANOTHER SIGN OF WEAKNESS

by John Murphy,
Chief Technical Analyst, StockCharts.com
TRANSPORTS LEAD INDUSTRALS LOWER ... We've been writing about a lot of negative stock market signals of late which include bearish chart action, as well as recent rotations out of small caps and technology and into traditionally defensive groups (that pay dividends). This morning's message will focus...
READ MORE
MEMBERS ONLY

Buying pressure drying up
by Arthur Hill,
Chief Technical Strategist, TrendInvestorPro.com
Despite excessively bearish sentiment, the technical conditions in the stock market are clearly bearish for the short-term and medium-term. Sentiment is hard to quantify, but I get the feeling that sentiment is overwhelmingly bearish as we head into the September-October period. Consider the following. First, the NY Times reports that...
READ MORE
MEMBERS ONLY
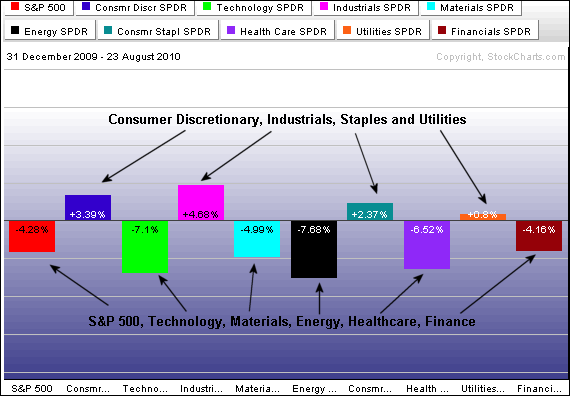
Sector performance is mixed for 2010
by Arthur Hill,
Chief Technical Strategist, TrendInvestorPro.com
Year-to-date sector performance shows five up and four down. In a rather strange twist, the consumer discretionary and industrial sectors are up, but the technology and finance sectors are down. Performance for the S&P 500 reflects the net result for the nine sectors (down 4.28%).
Click this...
READ MORE
MEMBERS ONLY

A BEARISH ABC COUNT FOR THE S&P 500 -- DEFINING THE CURRENT DOWNSWING -- DEFENSIVE SECTORS SHOW RELATIVE STRENGTH -- HEALTHCARE, UTILITIES AND CONSUMER STAPLES EDGE HIGHER -- FINANCE SECTOR CONTINUES TO LEAD LOWER
by John Murphy,
Chief Technical Analyst, StockCharts.com
A BEARISH ABC COUNT FOR THE S&P 500 ... Link for todays video. It is time to open Pandoras box with some Elliott Wave analysis of the S&P 500. To smooth the data and filter out the noise, I am using a 5-day exponential moving average for...
READ MORE
MEMBERS ONLY

Hitting support in a downtrend
by Arthur Hill,
Chief Technical Strategist, TrendInvestorPro.com
The August trend remains down for the major index ETFs, but techs are starting to show relative strength with QQQQ edging higher on Friday. Despite some signs of firmness, we have yet to see any signs of significant strength that would warrant a bullish stance. The first chart shows the...
READ MORE
MEMBERS ONLY
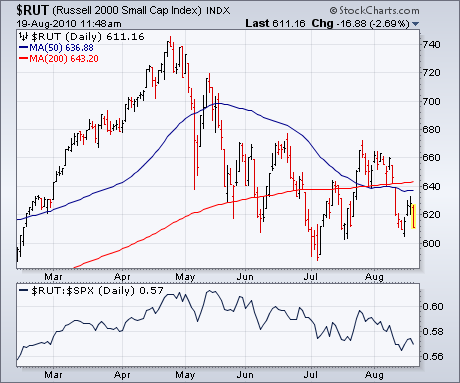
SMALL CAPS AND NASDAQ SHOW RELATIVE WEAKNESS
by John Murphy,
Chief Technical Analyst, StockCharts.com
It's usually a bad omen for the market when small caps and technology stocks are underperforming -- as they're doing at present. Chart 1 shows the Russell 2000 Small Cap Index trading closer to its July low than its July high. Its falling relative strength line...
READ MORE
MEMBERS ONLY
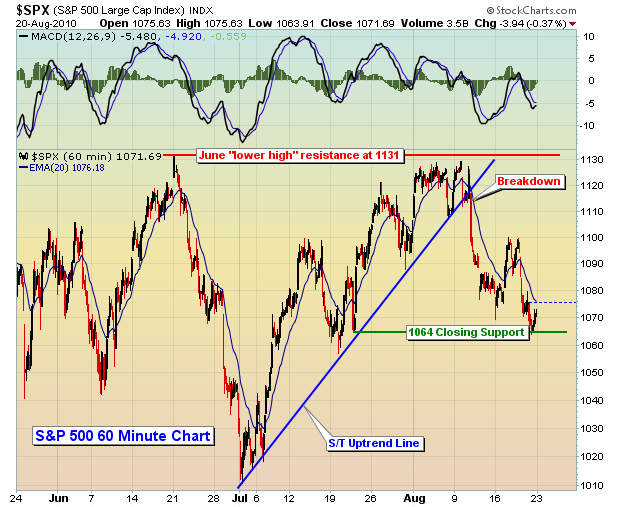
S&P 500 FAIL AT CRITICAL RESISTANCE

by Tom Bowley,
Chief Market Strategist, EarningsBeats.com
With a myriad of "under the surface" problems, the S&P 500 simply ran out of gas at a very inopportune time. The bulls were on the threshold of a major breakout on the S&P 500 above its June highs near 1131. For seven consecutive...
READ MORE
MEMBERS ONLY
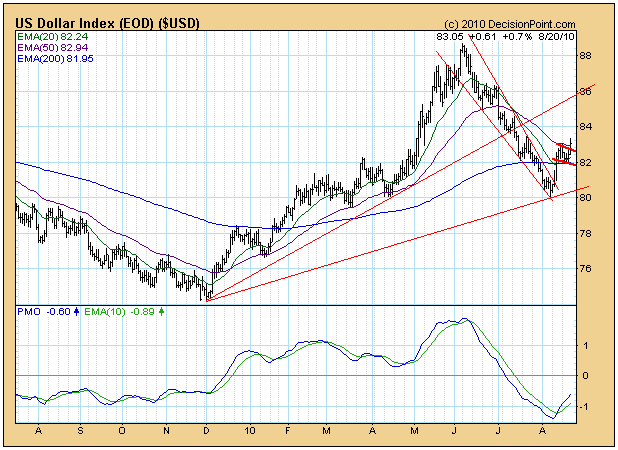
US DOLLAR RALLIES

by Carl Swenlin,
President and Founder, DecisionPoint.com
Looking at a weekly chart of the U.S. Dollar Index we can see that it entered a steep correction off the June top when it encountered long-term resistance from a declining tops line reaching back to 2006. During the correction a rising trend line drawn from the December 2009...
READ MORE
MEMBERS ONLY
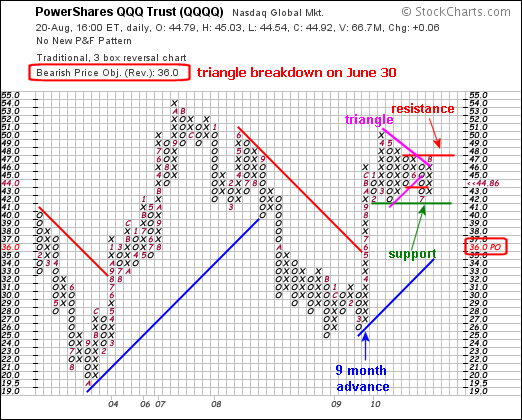
P&F BATTLE LINES DRAWN FOR QQQQ
by Arthur Hill,
Chief Technical Strategist, TrendInvestorPro.com
The Point & Figure chart for QQQQ shows clear support and resistance lines for 2010. The ETF advanced for 9-10 months with a long column of X's in 2009 and then embarked on a consolidation in 2010. Notice that the X's started in March 2009 and...
READ MORE
MEMBERS ONLY

BEST... STOCKCHARTS.COM... SPECIAL... EVER!!
Hello Fellow ChartWatchers!
It's that time of year again:
Now through the end of August, StockCharts.com is running it's "End-of-Summer-Almost-Fall" special and this is a very special special indeed. Here's the deal:
Subscribe to any of our services for six months...
READ MORE
MEMBERS ONLY

QQQQ REMAINS ON P&F SELL SIGNAL -- SPY FAILS AT P&F RESISTANCE -- IWM TESTS P&F SUPPORT -- PERIPHERAL EUROPEAN INDICES LEADING THE WAY LOWER -- CORE EUROPEAN INDICES FAIL AT RESISTANCE -- EURO WEIGHS ON MARKETS WITH SHARP DECLINE
by John Murphy,
Chief Technical Analyst, StockCharts.com
QQQQ REMAINS ON P&F SELL SIGNAL... Link for todays video. The Nasdaq 100 ETF (QQQQ), S&P 500 ETF (SPY) and Russell 2000 ETF (IWM) capture three important market segments. QQQQ captures technology, IWM reflects the performance of small-caps. SPY covers large-caps and the broader market). As...
READ MORE
MEMBERS ONLY

SPY fills gap on volume increase
by Arthur Hill,
Chief Technical Strategist, TrendInvestorPro.com
The S&P 500 ETF (SPY) gapped up on Tuesday and then filled that gap with a long red candlestick on Thursday. The inability to hold the gap is clearly negative. Also notice that volume increased as the ETF declined last week and this week.
Click this image for...
READ MORE
MEMBERS ONLY
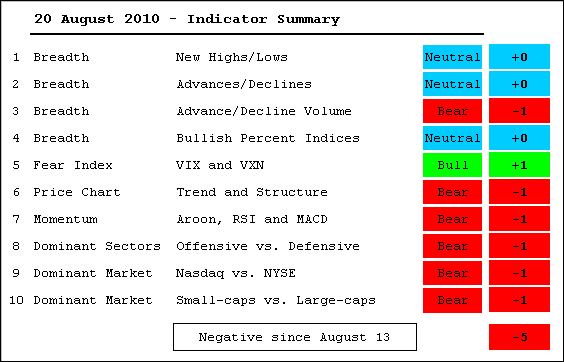
Indicator Summary remains negative
by Arthur Hill,
Chief Technical Strategist, TrendInvestorPro.com
The indicator summary would be much more negative were it not for strength in the NYSE breadth statistics. NYSE Net New Highs remain positive and the AD Line has yet to break down. Another decline next week would likely push these two indicators into bear mode. Another decline next week...
READ MORE
MEMBERS ONLY

SPY fills gap to affirm downtrend
by Arthur Hill,
Chief Technical Strategist, TrendInvestorPro.com
SPY gapped up on Tuesday and then filled that gap with a long red candlestick on Thursday. Some traders apply a three day rule to gaps. A gap that holds three days is valid. One that fails within three days is not. Tuesday's gap has been invalidated. In...
READ MORE
MEMBERS ONLY

S&P 500 STILL ON SHORT-TERM SELL SIGNAL -- SMALL CAPS AND NASDAQ ARE LEADING MARKET LOWER -- SO IS THE SEMICONDUCTOR INDEX -- FALLING BOND YIELDS CONTINUE TO PULL STOCKS AND MOST COMMODITIES (EXCEPT FOR GOLD) LOWER
by John Murphy,
Chief Technical Analyst, StockCharts.com
S&P 500 STILL ON SHORT-TERM SELL SIGNAL ... The last chart I showed on Tuesday was an hourly bar chart of the S&P 500 with Fibonacci lines drawn over the price. The point of the chart was to show where overhead resistance was likely to appear. [That&...
READ MORE
MEMBERS ONLY

Another weak finish, but gap holds
by Arthur Hill,
Chief Technical Strategist, TrendInvestorPro.com
It is one of those times when I can make pretty good arguments for both the bullish and bearish case - short-term and medium-term. This means we could be in for some choppy trading the next few days, weeks or even months. On the bullish side, sentiment seems to be...
READ MORE
MEMBERS ONLY

Financials dominate most active list
by Arthur Hill,
Chief Technical Strategist, TrendInvestorPro.com
Half of the 10 most active NYSE stocks on Wednesday came from the finance sector. The Free Charts page at Stockcharts.com shows the 10 most active for the Nasdaq and NYSE. Even though the market was mixed today, nine were up and only one was down. All five financials...
READ MORE
MEMBERS ONLY

ISLAND REVERSALS VIE FOR SHORT-TERM TREND -- HEAD-AND-SHOULDERS PATTERN REMAINS FOR LONG-TERM -- GOLD EXTENDS AUGUST SURGE AS SILVER HITS RESISTANCE -- GOLD:SILVER RATIO MOVING INVERSE TO STOCKS -- A TWIST ON FOSBACKS HIGH LOW LOGIC INDEX
by John Murphy,
Chief Technical Analyst, StockCharts.com
ISLAND REVERSALS VIE FOR SHORT-TERM TREND IN SPY... Link for todays video. Even though the month is barely half over, August is full of gaps. Chart 1 shows August starting with a big gap up as the S&P 500 ETF (SPY) surged above 112 to start the month....
READ MORE
MEMBERS ONLY

A weak finish and weak breadth
by Arthur Hill,
Chief Technical Strategist, TrendInvestorPro.com
Stocks bounced on Tuesday, but I was not impressed with the finish or with breadth. First, let's look at breadth. The charts below show the AD Volume Line and Net Advancing Volume for the NYSE and Nasdaq. NYSE Net Advancing Volume reached the +1000 level four times during...
READ MORE
MEMBERS ONLY

China and XLB moving together
by Arthur Hill,
Chief Technical Strategist, TrendInvestorPro.com
The Shanghai Composite ($SSEC) and the Materials SPDR (XLB) have been moving together in 2010. The moves in XLB are a little more exaggerated, but the positive correlation is clear. Most recently, both bottomed in early July and moved higher the last six weeks.
Click this image for a live...
READ MORE
MEMBERS ONLY

DIVIDEND ISHARES OFFER DEFENSIVE PROTECTION -- DVY LEADERS INCLUDE ENTERGY, CENTURYLINK, MCDONALDS, KIMBERLY CLARK, AND CLOROX -- GOLD LEADERS ARE ELDORADO AND IAMGOLD
by John Murphy,
Chief Technical Analyst, StockCharts.com
SELECT DIVIDEND ISHARES SHOW RELATIVE STRENGTH... My last message suggested that dividend paying stocks (especially telecom and utilities) offered defensive protection in a slowing economy with falling interest rates. The DJ Select Dividend Index Fund (DVY) offers a simple way to take advantage of that dividend benefit. Chart 1 shows...
READ MORE
MEMBERS ONLY

Firming near short-term retracement
by Arthur Hill,
Chief Technical Strategist, TrendInvestorPro.com
Trend following and mean reversion are two types of trading strategies. Trend followers wait for a reversal and confirmation with a support break or resistance breakout. Mean reversion traders look for overbought or oversold conditions to pick tops or bottoms. The two styles are diametrically opposed, but both systems have...
READ MORE
MEMBERS ONLY

SEMICONDUCTORS HOLDRS TESTS RANGE SUPPORT -- ADI, INTC AND TXN TESTS AS WELL -- BOND ADVANCE LOOKS PARABOLIC -- OIL AND GASOLINE ETFS FORM BEARISH WEDGE -- STRONG YEN HURTS JAPANESE EQUITIES -- LOST DECADE FOR US AND JAPAN -- TSAR OF THE EMERGING MARKETS
by John Murphy,
Chief Technical Analyst, StockCharts.com
SEMICONDUCTORS HOLDRS TESTS RANGE SUPPORT... Link for todays video. The Semiconductors HOLDRS (SMH) defines the current state of unusual uncertainty in the stock market. Chart 1 shows SMH locked in a volatile trading range since early May. From low to high or high to low, the ETF has moved 10%...
READ MORE
MEMBERS ONLY

Gold shines in August
by Arthur Hill,
Chief Technical Strategist, TrendInvestorPro.com
Outside of gold, August has been a tough month for commodities. The PerfChart below shows performance for six commodity related ETFs. Only one is up. Metals, Oil and Natural Gas are down rather sharply. Gold, in contrast is up over 2%. In an interesting twist, notice that gold is up...
READ MORE
MEMBERS ONLY

Short-term breadth breakdown
by Arthur Hill,
Chief Technical Strategist, TrendInvestorPro.com
Selling pressure was intense enough to produce a short-term breadth breakdown. The charts below show the 10-day SMA for Net Advancing Volume for the Nasdaq and NYSE. Net Advancing Volume is simply the volume of advancing stocks less the volume of declining stocks. A move above +100 shows a significant...
READ MORE
MEMBERS ONLY
"Hindenburg Omen" Tracking Chart
The "Hindenburg Omen" has been getting lots of press this week so I thought I'd put up a chart that people can use to track this elusive prophet of doom. All the different factors that go into the Omen's signal can be found in...
READ MORE
MEMBERS ONLY

GOLD AND EURO RESUME NEGATIVE CORRELATION -- GOLD BREAKS WEDGE RESISTANCE -- TECHS AND SMALL-CAPS UNDERPERFORMING BROADER MARKET -- NDX PERCENT ABOVE 200-DAY SMA BREAKS 50% -- S&P 500 PERCENT ABOVE 50-DAY SMA BREAKS 50%
by John Murphy,
Chief Technical Analyst, StockCharts.com
GOLD AND EURO RESUME NEGATIVE CORRELATION... Link for todays video. For the most part, Gold and the Euro have been negatively correlated throughout 2010. Negative correlation means one rises when the other one falls and visa versa. Positive correlation means both rise or fall together. Chart 1 shows the Gold...
READ MORE
MEMBERS ONLY

Bonds go parabolic - $UST
by Arthur Hill,
Chief Technical Strategist, TrendInvestorPro.com
Bonds have been on a tear since April with the 10-Year US Treasury Note ($UST) advancing some 8% in three months. The DJ Corporate Bond Index ($DJCBP) is not far behind with a 4.4% gain since early June. The advances over the last two months are exceptional sharp and...
READ MORE
MEMBERS ONLY

Indicator summary flips again
by Arthur Hill,
Chief Technical Strategist, TrendInvestorPro.com
Even though the indicator summary flipped to positive last week, I noted that a sharp decline from current levels could easily flip a few indicators back to the bears. That is indeed what happened. With sharp declines this week, SPY, IWM and QQQQ failed at important resistance zones. The discrepancy...
READ MORE
MEMBERS ONLY

SPY bounces after weak open
by Arthur Hill,
Chief Technical Strategist, TrendInvestorPro.com
The S&P 500 ETF (SPY) gapped down again on the open, but managed to bounce and close well above its open to form a hollow candlestick. Even so, the ETF closed below its prior close to color the candlestick red. Nevertheless, SPY remains below its support break at...
READ MORE
MEMBERS ONLY

DIVIDEND PAYING STOCKS LIKE UTILITIES AND TELECOM DO BETTER IN A DEFLATIONARY CLIMATE -- AT&T AND VERIZON LEAD TELECOM HOLDERS HIGHER -- GOLD NEARS UPSIDE BREAKOUT -- STOCKS ON SHORT-TERM SELL AS VIX TESTS OVERHEAD RESISTANCE
by John Murphy,
Chief Technical Analyst, StockCharts.com
STOCK DIVIDENDS ARE MORE ATTRACTIVE WHEN RATES TUMBLE ... I've read a lot of articles recently about which asset classes (or stock groups) do best in a deflationary environment. In past market messages (which warned of the deflationary threat), I've explained that two asset classes that usually...
READ MORE
MEMBERS ONLY

Five stocks bucking the decline
by Arthur Hill,
Chief Technical Strategist, TrendInvestorPro.com
Stocks were down sharply with a broad based decline on Wednesday, but there were a few stocks swimming against the tide. The S&P Sector Market Carpet provides an easy means to visual scan for green stocks in a sea of red. Carefusion (CFN), Macy's (M), Western...
READ MORE
MEMBERS ONLY
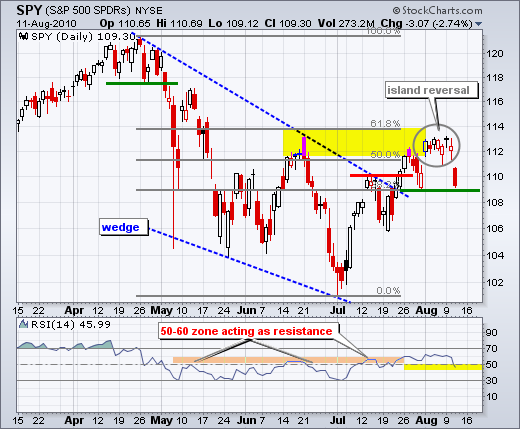
An island reversal for SPY
by Arthur Hill,
Chief Technical Strategist, TrendInvestorPro.com
With a gap up, tight consolidation and gap down, the S&P 500 ETF (SPY) formed an island reversal over the last two weeks. It all started with the gap and close above 112 on August 2nd. The ETF traded between 111 and 113 the next six days and...
READ MORE
MEMBERS ONLY
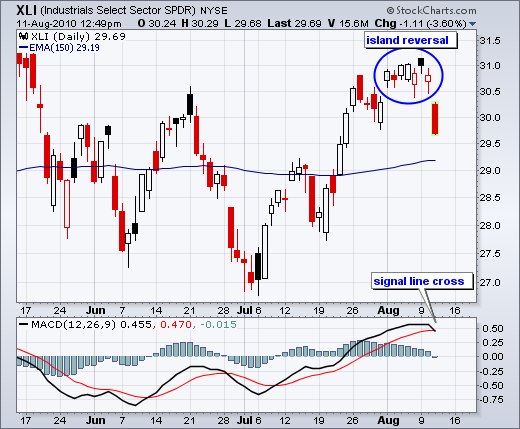
An island reversal for the Industrials SPDR
by Arthur Hill,
Chief Technical Strategist, TrendInvestorPro.com
With a gap up eight days ago and a gap down on Wednesday, the Industrials SPDR (XLI) formed an island reversal. Notice how the ETF gapped above 30.5 and largely held above this level for seven days. That ended with a large gap down that signals a reversal. MACD...
READ MORE
MEMBERS ONLY

STOCKS RETHINK FED POLICY STATEMENT -- XLF AND XLY GAP DOWN FROM RESISTANCE -- HEAD-AND-SHOULDERS REAPPEARS IN QQQQ -- SHORT-TERM RATES HIT RECORD LOW -- HOW LOW FOR THE 10-YEAR TREASURY YIELD? -- MOVING FROM RISK-ON TO RISK-OFF
by John Murphy,
Chief Technical Analyst, StockCharts.com
STOCKS RETHINK FED POLICY STATEMENT... Link for todays video. After bouncing yesterday afternoon, stocks opened sharply lower on Wednesday morning in what looks like a rethink of the Fed policy statement. The prospects of further quantitative easing and even lower interest rates may seem promising on the surface, but one...
READ MORE
MEMBERS ONLY
SPY stalls at resistance as Euro falls
by Arthur Hill,
Chief Technical Strategist, TrendInvestorPro.com
Even though stocks bounced after the Fed announcement, S&P futures are down sharply in pre-market trading today. European and Asian stocks are also lower this morning. The Euro is getting slammed (130.5) and this may signal a return to the risk-off trade. Earning season is passing, the...
READ MORE
MEMBERS ONLY

FED'S DECISION TO BUY GOVERNMENT DEBT BOOSTS BONDS AND HELPS KEEP STOCK UPTREND INTACT -- GOLD AND GOLD STOCKS RALLY -- VIX STILL IN DOWNTREND -- ELI LILLY ACHIEVES BULLISH BREAKOUT
by John Murphy,
Chief Technical Analyst, StockCharts.com
FED TO REINVEST MORTGAGE PROCEEDS IN LONG TERM TREASURIES... Although bond yields have been falling (and bond prices rising) for more than four months, bond traders still liked today's Fed announcement that it planned to reinvest mortgage proceeds into long-term Treasuries to increase the money supply and give...
READ MORE
MEMBERS ONLY
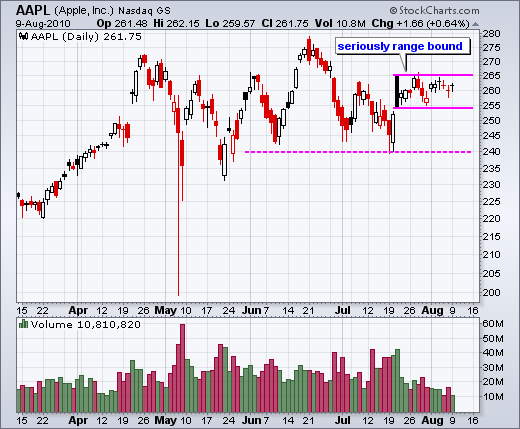
Bollinger Bands narrow for Apple
by Arthur Hill,
Chief Technical Strategist, TrendInvestorPro.com
Apple (AAPL) continues to consolidation within a relatively narrow range. The stock has traded between 266 and 254.90 for the last 13 days. Falling volatility is confirmed with the Bollinger BandWidth indicator, which shows the bands at their tightest in over five months. The direction of the consolidation break...
READ MORE
MEMBERS ONLY

SPY stays strong as Fed looms
by Arthur Hill,
Chief Technical Strategist, TrendInvestorPro.com
Don't fight the Fed. This Wall Street motto is as old as the Fed. Even if you doubt the Fed's ability to influence the long-term outcome, the Fed can still affect the short-term expectations. Quantitative easing (QE) is back on the table and this may keep...
READ MORE
