MEMBERS ONLY

MAJOR INDEX ETFS HIT RESISTANCE -- CONSUMER DISCRETIONARY ADVANCES INTO RESISTANCE ZONE -- HOMEBUILDERS AFFIRM SUPPORT WITH SURGE -- RETAILER SPDR LIMPS HIGHER -- FINANCE SECTOR CHALLENGES RESISTANCE -- REGIONAL BANK SPDR BOUNCES OFF FLAG SUPPORT

by John Murphy,
Chief Technical Analyst, StockCharts.com
MAJOR INDEX ETFS RUN INTO RESISTANCE... Link for todays video. With the advance over the last five weeks, most major index ETFs are challenging resistance from their June highs and a key retracement zone. Chart 1 shows the Nasdaq 100 ETF (QQQQ) for starters. Resistance around 46-47.5 stems from...
READ MORE
MEMBERS ONLY
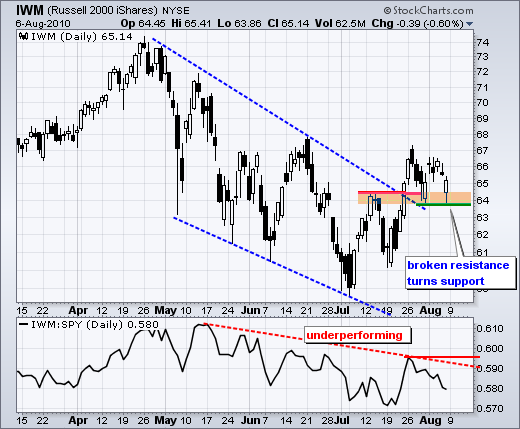
Broken resistance turns support for IWM

by Arthur Hill,
Chief Technical Strategist, TrendInvestorPro.com
A classic tenet of technical analysis is that broken resistance turns into support (and visa versa). The Russell 2000 ETF (IWM) broke the April trendline and resistance from its mid July high with a surge above 64.5 in late July. This broken resistance zone (63.8-64.5) now turns...
READ MORE
MEMBERS ONLY

SPY still challenging resistance
by Arthur Hill,
Chief Technical Strategist, TrendInvestorPro.com
Despite a worse-than-expected jobs number, stocks managed to limit early losses and surge in the final hour of trading. Conspiracy theorists are calling this manipulation. Maybe. Maybe not. To be honest, nobody really knows. The best we can do is watch the price action and trade accordingly. Even if the...
READ MORE
MEMBERS ONLY
Making Cents in a Wacky Market

by Tom Bowley,
Chief Market Strategist, EarningsBeats.com
Yep, you read the headline correctly. I want to personally congratulate you if you're able to successfully trade this market. Because it ain't easy. Friday was yet another example. Not only did the report fall well short of expectations on the July jobs, the revision to...
READ MORE
MEMBERS ONLY
GRAB BAG: TWITTER, PUBLIC CHARTLISTS, IMPROVING PERFORMANCE
Hello Fellow ChartWatchers!
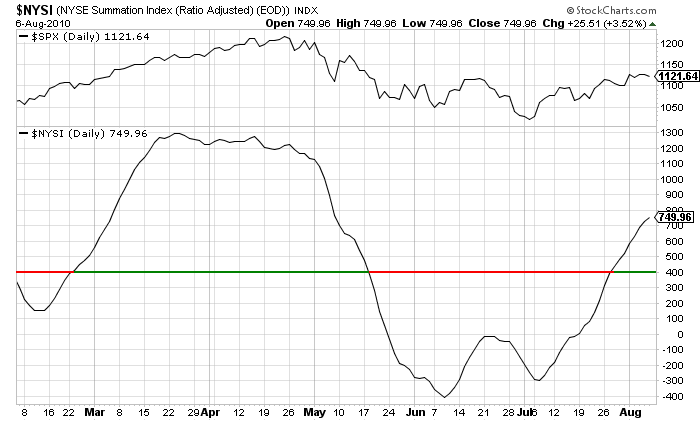
The market is trying to rise but bearish news keeps beating it down. One of my favorite market indicators - the McClellan Summation Index - rose decisively above the 400 level at the end of July indicating that it was time to start looking for entry points...
READ MORE
MEMBERS ONLY
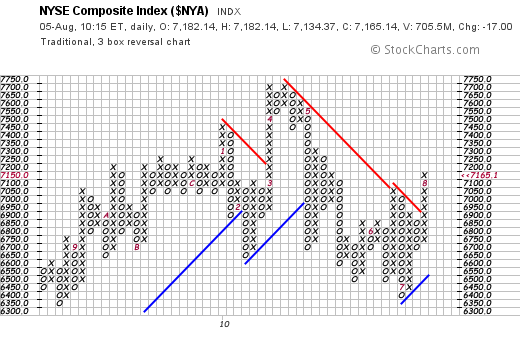
STOCK INDEXES IN P&F UPTRENDS
by John Murphy,
Chief Technical Analyst, StockCharts.com
One of the things I like best about poing & figure charts is their simplicity. Their strongest feature is that buy and sell signals are easier to spot than on bar or candlestick charts. A p&f chart shows alternating columns of X's and O's....
READ MORE
MEMBERS ONLY
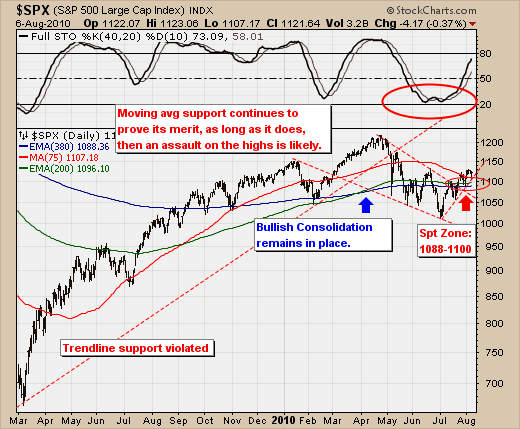
S&P 500 bullish....for the time being

by Richard Rhodes,
Founder and President, Rhodes Capital Management and Rhodes Trading Group
The rally off the July low is ongoing, and appears resilient in the face of very negative sentiment. While we want to be bearish based on a plethora of macro fundamentals, the technical viewpoint remains rather bullish for the time being. However, as we all understand - it could change...
READ MORE
MEMBERS ONLY
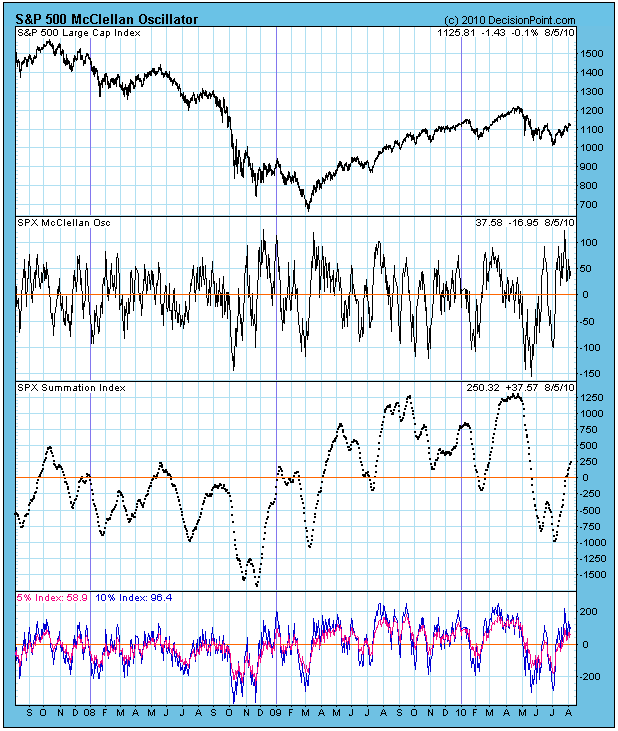
McClellan Oscillator Is Positive

by Carl Swenlin,
President and Founder, DecisionPoint.com
The McClellan Oscillator chart could be voted one of the most likely charts to cause the glazing over of multitudes of eyeballs; however, with a little effort you can understand it and appreciate the wealth of information it conveys. Take a moment and read and let the following paragraph sink...
READ MORE
MEMBERS ONLY
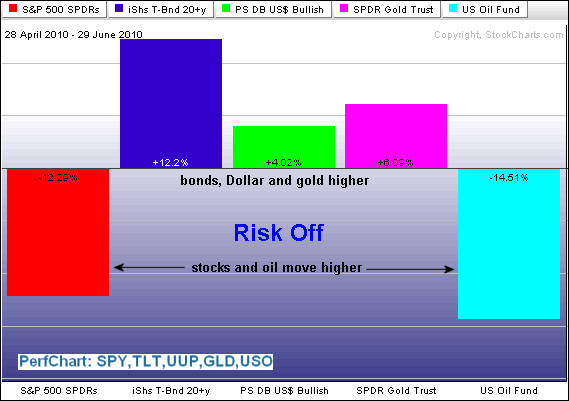
Risk-on versus Risk-off with intermarket PerfCharts
by Arthur Hill,
Chief Technical Strategist, TrendInvestorPro.com
The intermarket picture shows a preference for the risk-on trade over the last five weeks. The next two PerfCharts show five intermarket ETFs over two distinct timeframes. The first extends from late April until late June, which is when stocks declined sharply. The second extends from early July to early...
READ MORE
MEMBERS ONLY

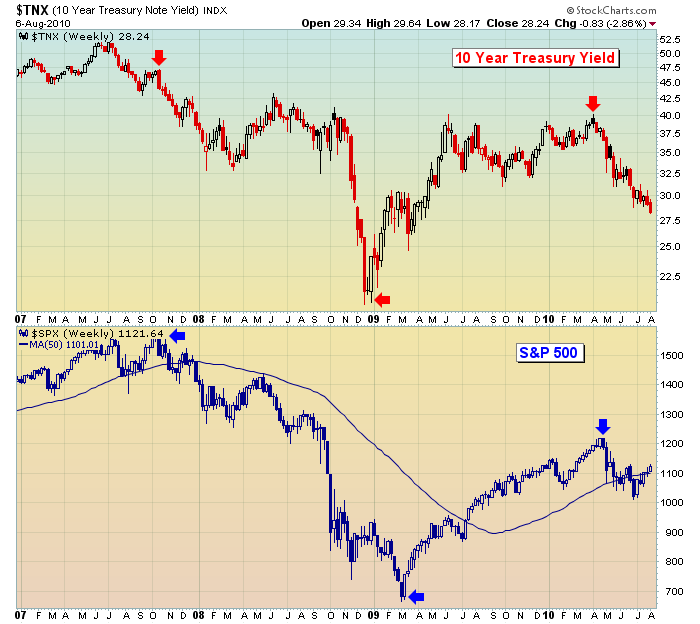
10-YEAR TREASURY YIELD BREAKS JULY LOWS -- EURO AND YEN SURGE AFTER JOBS REPORT -- GOLD ETF SURGES AS DOLLAR FALLS -- SMH FORMS BEARISH ENGULFING AT RESISTANCE -- NYSE SUMMATION INDEX BOUNCES OFF LONG-TERM SUPPORT
by John Murphy,
Chief Technical Analyst, StockCharts.com
10-YEAR TREASURY YIELD BREAKS JULY LOWS... Link for todays video. Even though some of the economic reports were positive this week, the employment related reports on Thursday and Friday were decidedly negative. Initial jobless claims, a weekly statistic, rose on Thursday and Fridays non-farm payrolls showed 131,000 fewer jobs...
READ MORE
MEMBERS ONLY

Risk-on trade favors stocks and oil
by Arthur Hill,
Chief Technical Strategist, TrendInvestorPro.com
The intermarket relationships over the last five weeks show stocks and oil rising together. On the other side, bonds, the Dollar and gold are down since early July. This looks like the classic "risk-on" trade. Strength in stocks and oil reflects an increased appetite for risk.
Click this...
READ MORE
MEMBERS ONLY

Indicator Summary turns positive
by Arthur Hill,
Chief Technical Strategist, TrendInvestorPro.com
The overall picture is still mixed, but bullish assessments of the volatility indices and Net New Highs pushed the indicator summary into positive territory for the first time since mid June. The S&P 500 Volatility Index ($VIX) and Nasdaq 100 Volatility Index ($VXN) continue to move lower and...
READ MORE
MEMBERS ONLY

Muted reaction to initial claims increase
by Arthur Hill,
Chief Technical Strategist, TrendInvestorPro.com
Despite a jump in initial jobless claims, the market managed to mute its losses and trade in a narrow range. The consensus was for 455,000 initial jobless claims and the actual number was 479,000. This is considerably higher, but the market took it in stride. The market held...
READ MORE
MEMBERS ONLY

POINT & FIGURE CHARTS ADD PRECISION AND SIMPLICITY TO TREND SIGNALS -- A P&F LOOK AT STOCKS, BONDS, COMMODITIES, AND CURRENCIES
by John Murphy,
Chief Technical Analyst, StockCharts.com
STOCK INDEXES IN P&F UPTRENDS... One of the things I like best about poing & figure charts is their simplicity. Their strongest feature is that buy and sell signals are easier to spot than on bar or candlestick charts. A p&f chart shows alternating columns of...
READ MORE
MEMBERS ONLY

Hostage to the employment numbers
by Arthur Hill,
Chief Technical Strategist, TrendInvestorPro.com
There is no change in the medium-term or short-term trends, which are both up. Even though SPY is trading in a resistance zone marked by the June high and 50-62% retracement zone, the trend is up and we have yet to see a failure or reversal at resistance. The break...
READ MORE
MEMBERS ONLY

Bonds test support ahead of employment report
by Arthur Hill,
Chief Technical Strategist, TrendInvestorPro.com
The 20+ Year T-Bond ETF (TLT) is at a make-or-break level with two key employment related releases over the next two days. An improving employment picture would likely lead to a support break, but further weakness in the employment numbers could keep bonds buoyant.
Click this image for details...
READ MORE
MEMBERS ONLY

ECONOMIC DATA LIFTS STOCKS AND SINKS BONDS -- MATERIALS, ENERGY AND INDUSTRIALS LEAD THE CHARGE -- HEALTHCARE SPDR SURGES ABOVE RESISTANCE -- BMY, PFE AND STJ LEAD HEALTHCARE SECTOR -- GOOGLE AND AMAZON POWER INTERNET ETF HIGHER
by John Murphy,
Chief Technical Analyst, StockCharts.com
ECONOMIC DATA LIFTS STOCKS AND SINKS BONDS... Link for todays video. Stocks started the day on a strong note after ADP Employer Services reported that companies added 42,000 jobs in July. The bulls were further bolstered with the ISM Services Index coming in well above 50 to show continued...
READ MORE
MEMBERS ONLY
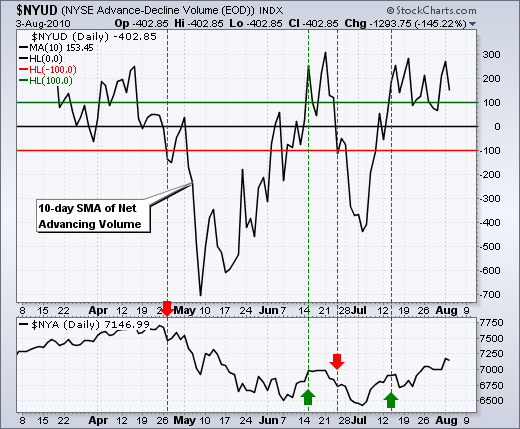
An inside day to signal indecision
by Arthur Hill,
Chief Technical Strategist, TrendInvestorPro.com
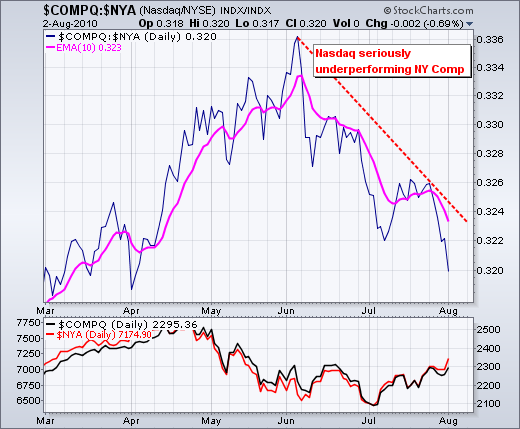
The NYSE and NY Composite have been driving the current rally. NYSE breadth has been stronger than Nasdaq breadth and the NY Composite has far outperformed the Nasdaq over the last five weeks. The leader will offer the first clues of a potential reversal. The chart below shows the 10-day...
READ MORE
MEMBERS ONLY
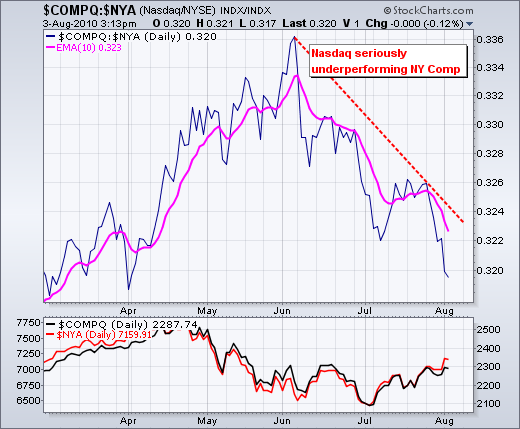
Nasdaq underperforming the NY Composite
by Arthur Hill,
Chief Technical Strategist, TrendInvestorPro.com
Ratio charts allow chartists to compare the performance of one security against another. The chart below plots the ratio of the Nasdaq and the NY Composite. The Nasdaq is underperforming because this ratio ($COMPQ:$NYA) has been falling since June.
Click this image for details...
READ MORE
MEMBERS ONLY
SPY surges towards June high
by Arthur Hill,
Chief Technical Strategist, TrendInvestorPro.com
The bulls came out charging on Monday. Strength in European banks and equities triggered yesterday's strong open. More importantly, stocks remained strong throughout the day and the major index ETFs closed near their highs for the session. NYSE breadth was strong, but Net Advances, Net Advancing Volume and...
READ MORE
MEMBERS ONLY

EUROPEAN INDICES LEAD GLOBAL RALLY -- XLF BOUNCES OFF LONG-TERM SUPPORT AND CHALLENGES RESISTANCE -- REGIONAL BANKS CONTINUE TO LAG -- OIL AND OIL SERVICE STOCKS BREAK RESISTANCE -- STOCKS AND BONDS MOVE IN OPPOSITE DIRECTIONS
by John Murphy,
Chief Technical Analyst, StockCharts.com
EUROPEAN INDICES LEAD GLOBAL RALLY... Link for todays video. Banks led European stocks higher on Monday with most country indices gaining over 2%. Leadership from banks, such as Frances biggest (BNP Paribas), shows increased confidence in the European banking system. This confidence also facilitated a sharp rally in the Euro....
READ MORE
MEMBERS ONLY
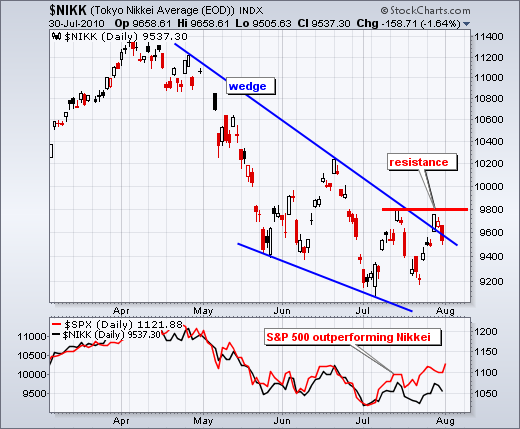
Nikkei remains short of breakout
by Arthur Hill,
Chief Technical Strategist, TrendInvestorPro.com
While the S&P 500 moved above its mid July high, the Nikkei 225 ($NIKK) remains short of a breakout and within a downtrend still. $NIKK surged to resistance last week, but fell just short of 9800 and pullback on Friday. A break above this resistance level is needed...
READ MORE
MEMBERS ONLY
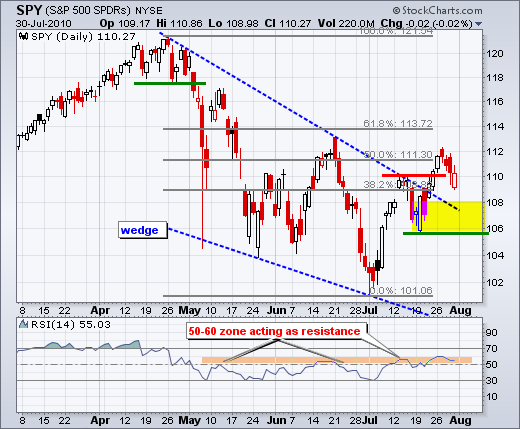
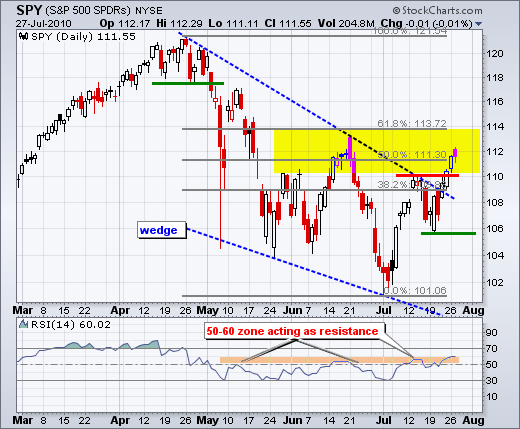
SPY holds suppport and uptrend
by Arthur Hill,
Chief Technical Strategist, TrendInvestorPro.com
After a big surge in July, the S&P 500 ETF (SPY) hit resistance around 112 and pulled back last week. Overall, SPY broke above the wedge trendline and exceeded its mid July high. These are bullish developments, but overbought conditions, key retracements and resistance kept stocks under pressure...
READ MORE
MEMBERS ONLY

BOND YIELDS CONTINUE TO DROP AS AGRICULTURALS LEAD COMMODITY RALLY -- STOCKS CONTINUE TO TEST RESISTANCE AT JUNE HIGH AND 200-DAY AVERAGES -- BULLISH PERCENT INDEXES TURN POSITIVE
by John Murphy,
Chief Technical Analyst, StockCharts.com
BOND RALLY CONTINUES... Bond prices of all categories rallied again this week. One bond ETF I've been tracking closely is the 20+Year T-bond iShares (TLT) which is shown in Chart 1. I recently wrote that the TLT needed a close below its early July low and its...
READ MORE
MEMBERS ONLY

NASDAQ BREADTH INDICATORS CHALLENGE RESISTANCE -- NYSE AD LINE AND NET NEW HIGHS BREAK RESISTANCE -- S&P 500 STALLS ABOVE TRENDLINE BREAK -- NATURAL GAS ETF COMES TO LIFE -- NATURAL GAS INDEX FOLLOWS THE S&P 500 -- CHESAPEAKE ENERGY CONSOLIDATES IN JULY
by John Murphy,
Chief Technical Analyst, StockCharts.com
NASDAQ BREADTH INDICATORS CHALLENGE RESISTANCE... Link for todays video. With the July surge, key breadth indicators for the Nasdaq are challenging resistance from their June highs - as is the Nasdaq itself. Chart 1 shows the Nasdaq as a 5-day EMA and 63-day EMA. Why these exponential moving averages? I...
READ MORE
MEMBERS ONLY

A P&F triple bottom break for Whirlpool
by Arthur Hill,
Chief Technical Strategist, TrendInvestorPro.com
Whirlpool (WHR) came across the triple bottom break scan. The stock is in a clear downtrend with lower lows and lower highs since May. WHR broke triple bottom support twice in the next few days and the downside price objective is 74. This objected is based on traditional P&...
READ MORE
MEMBERS ONLY

Indicator Summary remains negative - barely
by Arthur Hill,
Chief Technical Strategist, TrendInvestorPro.com
It all depends on where we set key resistance. If the mid July highs marked key resistance, then this indicator summary would be in bull mode. If the mid June highs mark key resistance, then a number of indicators and ETFs remain short of trend changing breakouts. Because this is...
READ MORE
MEMBERS ONLY

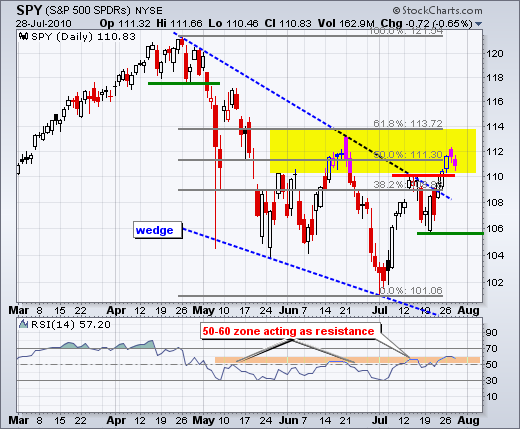
Two failed gaps at resistance
by Arthur Hill,
Chief Technical Strategist, TrendInvestorPro.com
Even though the July surge had impressive breadth and upside momentum, the S&P 500 ETF (SPY) is clearly running into resistance around 112. Resistance from prior highs and key retracements is not surprising. In addition, the ETF became overbought early this week after a 10% advance in 17...
READ MORE
MEMBERS ONLY
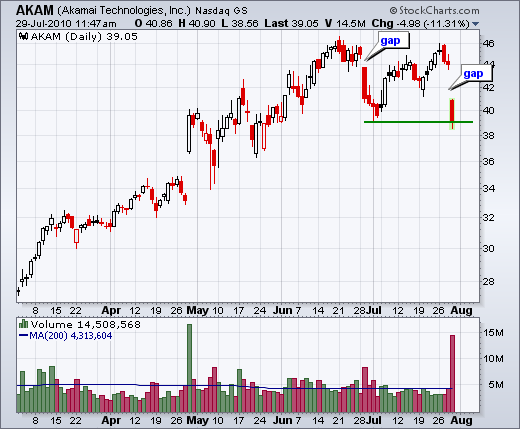
Akamai gaps down from resistance
by Arthur Hill,
Chief Technical Strategist, TrendInvestorPro.com
For the second time in two months, Akamai (AKAM) gapped down from resistance at 46. The stock first hit resistance here in mid June and gapped down in late June. AKAM moved back to resistance in July, but failed again with another gap and high-volume decline.
Click this image for...
READ MORE
MEMBERS ONLY
SPY forms small falling flag
by Arthur Hill,
Chief Technical Strategist, TrendInvestorPro.com
There is no change on the daily chart as SPY stalls in its resistance zone. Even though the strong July surge and wedge breakout are medium-term bullish, SPY is still on the overbought side and battling resistance. First, the ETF advanced around 10% from its July low (~102 to ~112)...
READ MORE
MEMBERS ONLY

NASDAQ AND NY COMPOSITE HIT RESISTANCE -- A VOLATILE 16 WEEK PERIOD -- FINANCE AND SEMIS HIT RESISTANCE -- OIL AND GASOLINE ETFS FORM TRIANGLES -- EURO ETF HITS KEY RETRACEMENT -- EURO AND STOCKS ARE POSITIVELY CORRELATED
by John Murphy,
Chief Technical Analyst, StockCharts.com
NASDAQ AND NY COMPOSITE HIT RESISTANCE LEVELS... Link for todays video. Resistance from prior highs and key retracements is coming into play for the Nasdaq and NY Composite. Chart 1 shows the Nasdaq hitting resistance around 2300 with a stall over the last two days. Resistance in this zone stems...
READ MORE
MEMBERS ONLY
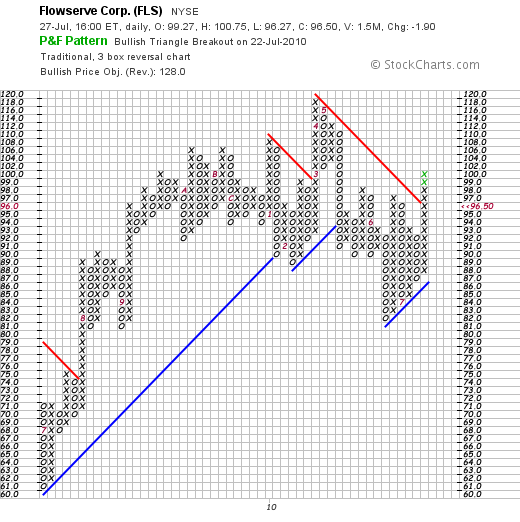
Flowserve with P&F triangle breakout
by Arthur Hill,
Chief Technical Strategist, TrendInvestorPro.com
Flowserve (FLS) came across the bullish triangle alert page from the P&F pattern scans. On the P&F chart, notice how the stock broke above the bearish resistance line with a surge above 98. As far as Point & Figure is concerned, this chart remains bullish as...
READ MORE
MEMBERS ONLY
A little selling pressure emerges
by Arthur Hill,
Chief Technical Strategist, TrendInvestorPro.com
After strong buying pressure four of the last five days, stocks took a breather on Tuesday as the S&P 500 ETF (SPY) forged a small red candlestick. SPY opened above 112 and closed below 112. After a strong open, SPY moved lower and this indicates selling pressure. The...
READ MORE
MEMBERS ONLY

GOLD BREAKS CHART SUPPORT AS COMMODITIES WEAKEN -- STOCKS TEST JUNE HIGHS -- WATCHING THE LONG BOND FOR SIGNALS
by John Murphy,
Chief Technical Analyst, StockCharts.com
LONG BOND TESTS SUPPORT... I wrote last week that the long Treasury bond probably needed to break initial chart support to signal a stock market bottom (since they trend in opposite directions). Although Treasuries have pulled back this week (as stocks have risen), no short-term sell signal has been given...
READ MORE
MEMBERS ONLY

Apple stalls with 3 inside days
by Arthur Hill,
Chief Technical Strategist, TrendInvestorPro.com
While the market continued higher the last three days, Apple (AAPL) stalled with three inside days. This stall comes after last week's wedge breakout, which is still holding. A move below last week's gap (252) would negate the breakout.
Click this image for details...
READ MORE
MEMBERS ONLY

Short-term overbought and staying that way
by Arthur Hill,
Chief Technical Strategist, TrendInvestorPro.com
Even though volume has been light in July, breadth has been strong, especially on the NYSE. Breadth is picking up steam on the Nasdaq as Net New Highs hit +91 and Net Advances exceeded +1000 for the third day in a row. Summer volume is supposed to be light so...
READ MORE
MEMBERS ONLY

DOW INDUSTRIALS AND TRANSPORTS CHALLENGE JUNE HIGHS -- SMALL-CAPS TAKE THE LEAD ON THE UPSIDE -- HOMEBUILDERS EXTEND SURGE AS NEW HOME SALES EXPAND -- NYSE AD LINE BREAKS ABOVE JUNE HIGH -- NYSE NET NEW HIGHS SURGE TO 12 WEEK HIGH
by John Murphy,
Chief Technical Analyst, StockCharts.com
DOW INDUSTRIALS AND TRANSPORTS CHALLENGE JUNE HIGHS... Link for todays video. The Dow Industrials and Transports are leading the July charge as both challenge their June highs. Chart 1 shows the close-only line chart for the Dow Industrials. The senior Average broke its wedge trendline in mid July and traded...
READ MORE
MEMBERS ONLY

Dollar Index becomes oversold
by Arthur Hill,
Chief Technical Strategist, TrendInvestorPro.com
The US Dollar Index ($USD) became oversold as RSI moved below 30 last week. In addition, notice that the index has retraced just over 62% of the March-June advance. A channel has taken shape since early June and traders should watch for a channel breakout to reverse this downtrend.
Click...
READ MORE
MEMBERS ONLY

SPY breaks falling wedge trendline
by Arthur Hill,
Chief Technical Strategist, TrendInvestorPro.com
The medium-term picture is perking up as stocks finished strong last week. SPY started the week with an indecisive candlestick last Monday. After a weak open below 106 on Tuesday, SPY finished strong with a close above 108 that very same day. There was a sharp pullback on Wednesday, but...
READ MORE
MEMBERS ONLY
STOCKCHARTS NOW ON FACEBOOK
DO YOU LIKE US? DO YOU REALLY, REALLY LIKE US? - StockCharts now has an official page on FaceBook that FaceBook users can use to keep up with the latest site developments and articles. Just visit https://facebook.com/stockchartscom and click the "Like" button at the top...
READ MORE
