MEMBERS ONLY

SPY breaks support ahead of FOMC

by Arthur Hill,
Chief Technical Strategist, TrendInvestorPro.com
Stocks took it on the chin Tuesday with big losses in the major index ETFs. The Russell 2000 ETF (IWM) and S&P 400 MidCap ETF (MDY) led the way lower with losses greater than 2%. All sectors were down with energy, materials, utilities, industrials and consumer discretionary losing...
READ MORE
MEMBERS ONLY

STOCKS FAIL TEST OF 50-DAY LINES -- DOW AND S&P 500 FALL BELOW 200-DAY LINES -- TRANSPORTS, RETAILERS AND HOMEBUILDERS ARE ESPECIALLY WEAK -- INVESTMENT GRADE CORPORATES LEAD BOND PRICES HIGHER AS MOST COMMODITIES AND STOCKS DROP

by John Murphy,
Chief Technical Analyst, StockCharts.com
DOW AND S&P 500 FALLS BELOW 200-DAY LINE... I wrote last Thursday that the next upside target for the market would be a test of 50-day averages. That test has taken place and, so far at least, appears to have failed. Yesterday's early enthusiasm...
READ MORE
MEMBERS ONLY
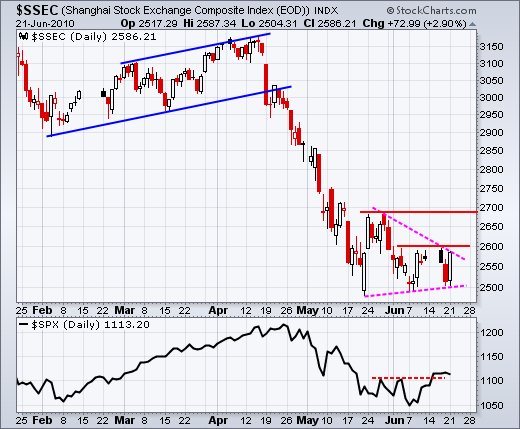
Shanghai Composite remains relatively weak
by Arthur Hill,
Chief Technical Strategist, TrendInvestorPro.com
Despite a big bounce on Monday's currency news, the Shanghai Composite ($SSEC) remains within a trading range and continues to show relative weakness. After a sharp decline in April-May, the index formed a triangle consolidation around 2550. Watch these boundaries for the next directional clue. Also notice...
READ MORE
MEMBERS ONLY

RECENT WEAKNESS IN HOMEBUILDING STOCKS IS A SIGN OF ECONOMIC WEAKNESS -- SO IS THE DROP IN THE PRICE OF LUMBER -- BOTH OF WHICH HELP EXPLAIN FALLING BOND YIELDS AND RISING BOND PRICES
by John Murphy,
Chief Technical Analyst, StockCharts.com
HOMEBUILDING ETF BREAKS 200-DAY LINE... One of the more negative market signs of late has been the breakdown in homebuilding stocks -- both in absolute and relative terms. Chart 1 shows the DJ US Home Contruction iShares (ITB) well below its 200-day moving average and trading near the lowest...
READ MORE
MEMBERS ONLY

A wild day in the market
by Arthur Hill,
Chief Technical Strategist, TrendInvestorPro.com
It was a pretty crazy day on Wall Street - and in the rest of the markets. Stocks surged in early trading on news that China would allow the Yuan to strengthen for the first time since July 2005. Obviously, China is not in any hurry to let its currency rise....
READ MORE
MEMBERS ONLY

TECHS LEAD MARKET LOWER WITH OUTSIDE REVERSALS -- CONSUMER DISCRETIONARY SPDR BATTLES RESISTANCE -- RETAILERS WEIGH ON CONSUMER DISCRETIONARY SECTOR -- MACYS, TARGET AND BEST BUY MOVE SHARPLY LOWER -- GOLD MOVES BACK BELOW RESISTANCE BREAKOUT
by John Murphy,
Chief Technical Analyst, StockCharts.com
TECHS LEAD MARKET LOWER WITH BIG OUTSIDE REVERSALS... Link for todays video. Stocks started the day strong, but gave up early gains and moved into negative territory in the afternoon. Techs were especially weak with the Nasdaq and Nasdaq 100 leading the market lower. Chart 1 shows the Nasdaq 100...
READ MORE
MEMBERS ONLY

Yuan Fund surges to long-term moving average
by Arthur Hill,
Chief Technical Strategist, TrendInvestorPro.com
News that China adjusted its currency's peg to the Dollar sent the Chinese Yuan Fund (CYB) surging back above 25. While the three week move may seem impressive, the ETF is really just making it back to its 52-week average. In fact, the ETF spent most of...
READ MORE
MEMBERS ONLY

SPY holds its breakout
by Arthur Hill,
Chief Technical Strategist, TrendInvestorPro.com
Stocks held their ground on Friday and most major indices ended with small gains, very small gains. Sectors were mixed with three down, five up and one unchanged (tech). Over the last two weeks, industrials and technology have been leading the market higher, but consumer discretionary and finance have been...
READ MORE
MEMBERS ONLY
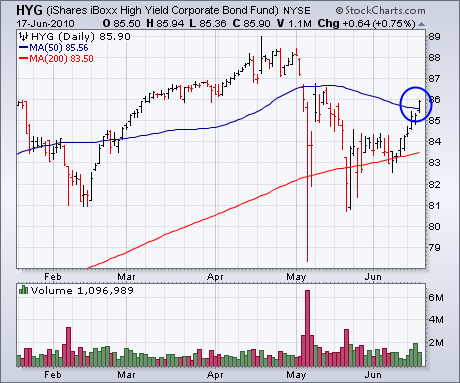
FIXED INCOME ETFS GAIN GROUND
by John Murphy,
Chief Technical Analyst, StockCharts.com
While some money is starting to creep back into stocks, investors are still showing enthusiasm for bonds. And I'm not talking just about Treasuries. More impressive gains were seen in other bond categories like corporate bonds and TIPS. Chart 1 shows the High Yield Corporate Bond ETF (HYG)...
READ MORE
MEMBERS ONLY
SOME OF THESE THINGS ARE NOT LIKE THE OTHERS
Hello Fellow ChartWatchers!
Now this will probably give away my age, but one of my first memories of television was from the educational children's show called "Sesame Street" and the song that they used to sing called "One of These Things is Not Like The...
READ MORE
MEMBERS ONLY
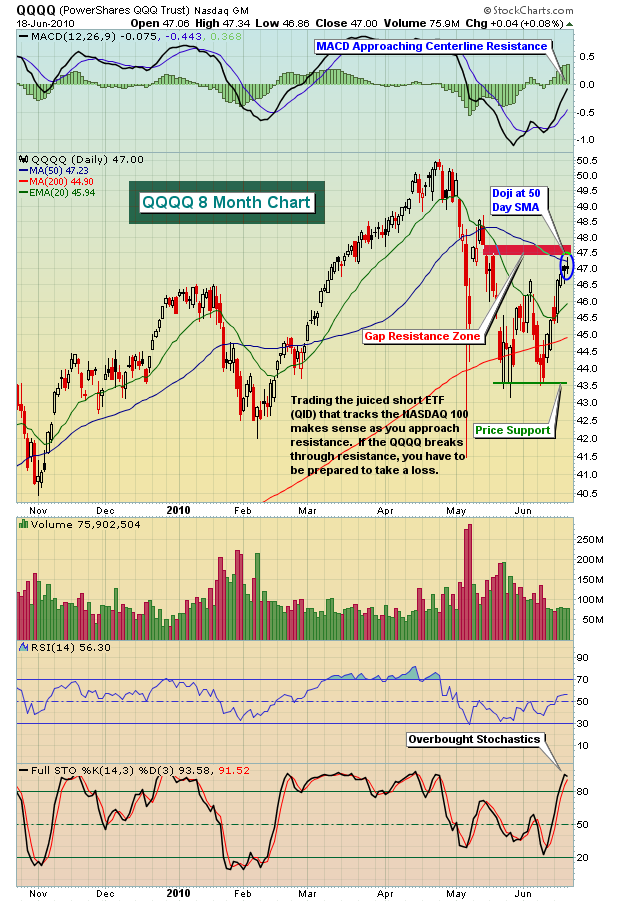
TIME FOR JUICED ETFS?

by Tom Bowley,
Chief Market Strategist, EarningsBeats.com
The market is at a crossroads short-term. We've been bouncing back and forth after that early May drubbing. So is the rally ending or is it just starting? Well, we can only look at the technical, sentiment and historical indicators and come up with a "highest...
READ MORE
MEMBERS ONLY
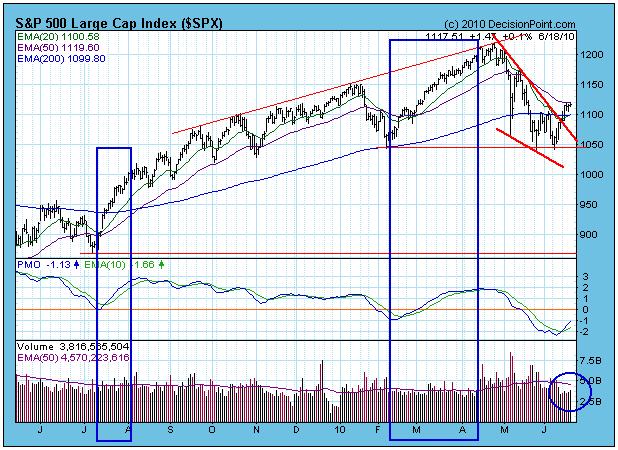
THE VOLUME ISSUE

by Carl Swenlin,
President and Founder, DecisionPoint.com
One of the issues that has concerned many analysts is the lack of volume supporting the rally from the June lows, but looking back over the last year we can see that volume has not been at all impressive for either of the rallies beginning in July 2009 or February...
READ MORE
MEMBERS ONLY
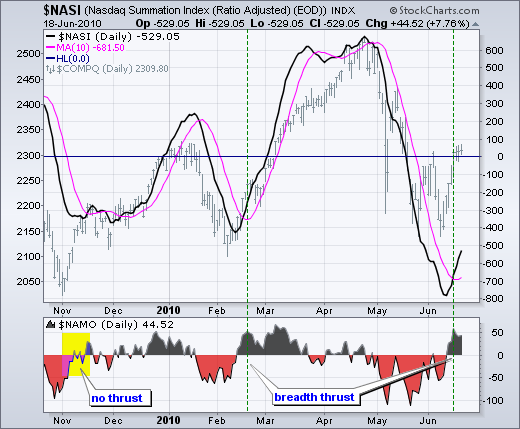
A BREADTH THRUST FOR THE MCCLELLAN OSCILLATOR
by Arthur Hill,
Chief Technical Strategist, TrendInvestorPro.com
Before getting into this breadth thrust, let's review the McClellan Oscillator and McClellan Summation Index. Basically, the McClellan Oscillator is the 19-day EMA of Net Advances less the 39-day EMA of Net Advances (advances less declines). Like MACD, it is a momentum oscillator for Net Advances....
READ MORE
MEMBERS ONLY

HISTORICAL BULL AND BEAR ZONES FOR RSI -- S&P 500 RSI BOUNCES OFF LONG-TERM SUPPORT ZONE -- A BREADTH THRUST FOR THE MCCLELLAN OSCILLATOR -- FINANCE, RETAIL AND HOUSING ETFS LAG BROADER MARKET -- OIL HITS RETRACEMENT RESISTANCE ZONE
by John Murphy,
Chief Technical Analyst, StockCharts.com
HISTORICAL BULL AND BEAR ZONES FOR RSI... Link for todays video. As noted in prior commentaries, there are bull market zones and bear market zones for RSI. In general, RSI ranges from 40 to 80 in an uptrend and 20 to 60 in a downtrend. These are forty point ranges....
READ MORE
MEMBERS ONLY

Staples forms bearish engulfing
by Arthur Hill,
Chief Technical Strategist, TrendInvestorPro.com
Staples surged with the rest of the market over the prior seven days, but hit resistance from broken support with a bearish engulfing candlestick on Thursday. Also notice that the falling 200-day EMA and the 50% retracement mark.
Click this image for details...
READ MORE
MEMBERS ONLY

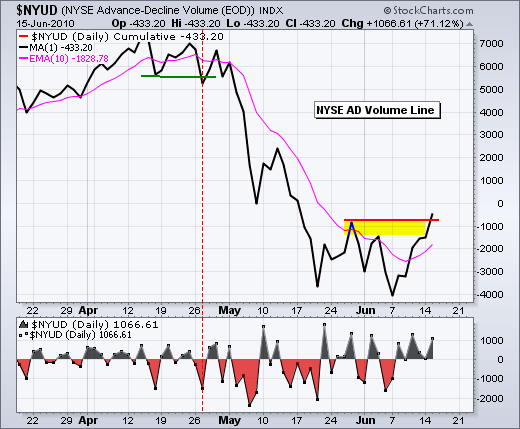
Indicator Summary flips positive
by Arthur Hill,
Chief Technical Strategist, TrendInvestorPro.com
After one week in negative territory, the indicator summary flipped back into positive territory on Friday, 18-June. The surge over the last eight days was strong enough to trigger a breakout in the NYSE AD Volume Line and pushed the 10-day SMA for NYSE Net New Highs into...
READ MORE
MEMBERS ONLY

Stocks eke out another gain
by Arthur Hill,
Chief Technical Strategist, TrendInvestorPro.com
Stocks traded mixed most of the day, but a late rally pushed the S&P 500, Nasdaq and Dow into positive territory for the close. The final gain was small though. In addition, the Russell 2000 and S&P 600 SmallCap Index both finished with small losses. Once...
READ MORE
MEMBERS ONLY

GE forms rising flag near support
by Arthur Hill,
Chief Technical Strategist, TrendInvestorPro.com
GE is trying to bounce off its February low, but the bounce look feeble so far and the stock shows relative weakness. The stock shows relative weakness because the S&P 500 broke above resistance and GE remains below corresponding resistance. The support zone around 15-15.5 is...
READ MORE
MEMBERS ONLY

STOCK INDEXES STAY ABOVE 200-DAY LINES -- RAILS LEAD TRANSPORTS HIGHER -- BOND FUNDS HAVE STRONG DAY -- NEWMONT MINING HITS FOUR-YEAR HIGH IN STRONG GOLD GROUP
by John Murphy,
Chief Technical Analyst, StockCharts.com
FIXED INCOME ETFS GAIN GROUND... While some money is starting to creep back into stocks, investors are still showing enthusiasm for bonds. And I'm not talking just about Treasuries. More impressive gains were seen in other bond categories like corporate bonds and TIPS. Chart 1 shows the High...
READ MORE
MEMBERS ONLY

COMBINING SUMMER RALLY AND FOUR-YEAR CYCLE SUGGESTS ANY JULY BOUNCE WILL BE FOLLOWED BY A WEAKER AUTUMN -- LIGHT TRADING VOLUME ON RECENT RALLY SHOWS LACK OF BULLISH ENTHUSIASM -- DAILY EMA LINES ARE STILL NEGATIVE
by John Murphy,
Chief Technical Analyst, StockCharts.com
MOST OF SUMMER RALLY TAKES PLACE DURING JULY... My Tuesday message suggested that the "summer rally" may have started. I warned, however, that I thought that short-term bounce into July could be followed by a selloff into the autumn months. First, a brief description of the summer...
READ MORE
MEMBERS ONLY
Market turns mixed after big advance
by Arthur Hill,
Chief Technical Strategist, TrendInvestorPro.com
After a big advance the prior six days, trading turned mixed as the market consolidated its gains. Over the last seven days, IWM is up 7.74%, MDY is up 7.2%, QQQQ is up 6.13%, SPY is up 5.01% and DIA is up 4.88%. Even though...
READ MORE
MEMBERS ONLY
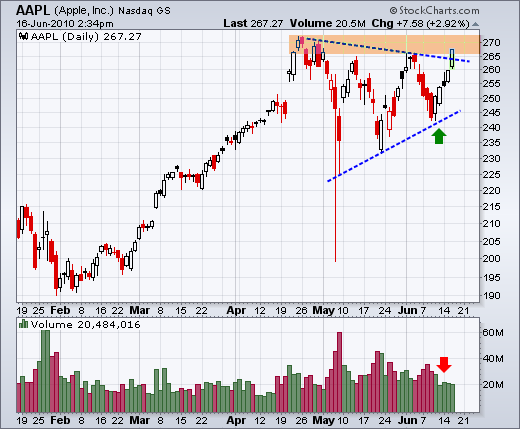
Apple challenges resistance
by Arthur Hill,
Chief Technical Strategist, TrendInvestorPro.com
Apple (AAPL) remains one of the strongest stocks as it surges to resistance from the April-June highs. The stock formed a triangle over the last 2-3 months and broke the upper trendline today. Volume was light though. QQQQ traders should note that Apple accounts for 18.84% of...
READ MORE
MEMBERS ONLY

APPLE AND GOOGLE LEAD QQQQ HIGHER -- GOLD AND BONDS HOLD SUPPORT AS S&P 500 BREAKS RESISTANCE -- BOND ETF CONSOLIDATES ABOVE RESISTANCE -- TREASURY YIELDS TRACK COMMODITY ETF -- GOLD AND SILVER ETFS CONSOLIDATE NEAR RESISTANCE
by John Murphy,
Chief Technical Analyst, StockCharts.com
APPLE AND GOOGLE LEAD QQQQ HIGHER... Link for todays video. Trading was mixed much of Wednesday, but big techs and the Nasdaq 100 ETF (QQQQ) showed some leadership. Chart 1 shows QQQQ breaking above its early June high with a surge today. QQQQ is up four of the last five...
READ MORE
MEMBERS ONLY
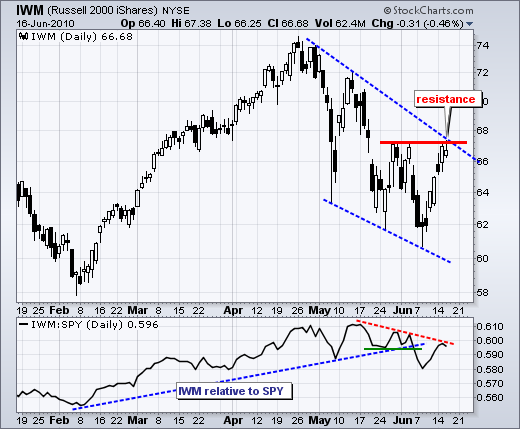
Breakouts and resistance challenges
by Arthur Hill,
Chief Technical Strategist, TrendInvestorPro.com
Stocks surged on Tuesday with the major index ETFs gaining over 2%. The gains were rather uniform with a range from 2.27% in the S&P 100 to 2.82% in the Nasdaq 100. Even though the Nasdaq and Russell 2000 gained more than the S&P...
READ MORE
MEMBERS ONLY
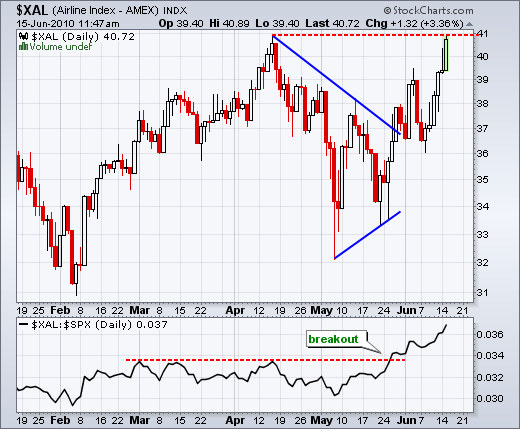
Airline Index closes in on 52-week high
by Arthur Hill,
Chief Technical Strategist, TrendInvestorPro.com
Airlines continue to show relative strength and upside leadership. First, the Airline Index ($XAL) is challenging its April high with a big move on Tuesday. A break would forge a new 52-week high. Second, the price relative broke out in late May and recorded a new high this week....
READ MORE
MEMBERS ONLY

MARKET BOUNCE CONTINUES OFF FEBRUARY LOW -- SHORT-TERM OUTLOOK IMPROVES FOR RISK ASSETS -- SECTOR LEADERS INCLUDE AIRLINES AND CHIPS -- MARKET MAY BE STARTING SUMMER RALLY
by John Murphy,
Chief Technical Analyst, StockCharts.com
VIX TURNS BACK DOWN... A couple of months ago, we warned that an upturn in the CBOE Volatility (VIX) Index signalled a market correction that could take the major stock indexes back to their February lows. The good news is that the February lows have held and the market'...
READ MORE
MEMBERS ONLY
Selling pressure at resistance
by Arthur Hill,
Chief Technical Strategist, TrendInvestorPro.com
Trading turned mixed as the Dow and S&P 500 tested important resistance levels. The S&P 500 and Nasdaq finished with small gains, but the Dow and Nasdaq 100 finished with small losses. The Russell 2000 and S&P 400 Midcap Index closed with modest gains...
READ MORE
MEMBERS ONLY

SPY AND DIA GET COLD FEET AT RESISTANCE -- QQQQ FORMS TRIANGLE AS IWM FALLS SHORT -- FINANCE SECTOR LAGS BROADER MARKET -- UTILITY SPDR BREAKS RESISTANCE TO SHOW LEADERSHIP -- EURO GETS AN OVERSOLD BOUNCE WITHIN DOWNTREND
by John Murphy,
Chief Technical Analyst, StockCharts.com
SPY AND DIA GET COLD FEET AT RESISTANCE... Link for todays video. Trading remains tricky as the major index ETFs get cold feet at or below important resistance levels. Stocks opened strong on Monday and continued higher in the morning, but selling pressure took over in the afternoon and the...
READ MORE
MEMBERS ONLY

Commodities follow stocks
by Arthur Hill,
Chief Technical Strategist, TrendInvestorPro.com
With the exception of precious metals, commodity indices have gone the way of the stock market over the last eight weeks. The PerfChart below shows the S&P 500 six commodity related indices. Only the GSCI Precious Metals Index ($GPX) shows a gain since mid April.
Click this image...
READ MORE
MEMBERS ONLY
SPY surges off support
by Arthur Hill,
Chief Technical Strategist, TrendInvestorPro.com
The surge over the last two days did not occur on the strongest breadth or volume, but support from the February low held and the bigger uptrend remains in place. As long as the bigger trend is up, the odds favor the bulls as SPY surges off support. Selling pressure...
READ MORE
MEMBERS ONLY

A POSSIBLE BROADENING FORMATION FOR THE NY COMPOSITE -- NASDAQ HOLDS ABOVE FEBRUARY LOWS WITH VOLATILE RANGE -- NY COMPOSITE UNDERPERFORMS NASDAQ -- NYSE AD VOLUME LINE IS WEAKER THAN THE AD LINE -- VIX AND VXN REACH MEDIUM-TERM EXTREMES
by John Murphy,
Chief Technical Analyst, StockCharts.com
A POSSIBLE BROADENING FORMATION FOR THE NY COMPOSITE... Link for todays video. With a big bounce on Thursday, the market is making another concerted effort at holding the February lows. Chart 1 shows the NY Composite ($NYA) piercing its February lows, but moving back above by the end of the...
READ MORE
MEMBERS ONLY

A lot of fill black candlesticks
by Arthur Hill,
Chief Technical Strategist, TrendInvestorPro.com
Looking through the pre-defined scans page, it was surprising to see a high number of filled black candlesticks on Thursday. These candlesticks form when the close is below the open and the close is above the prior close. Even though the stock closed up for the day, the stock...
READ MORE
MEMBERS ONLY

Indicator Summary turns negative
by Arthur Hill,
Chief Technical Strategist, TrendInvestorPro.com
Small-caps broke down this week and the Bullish Percent Index indicator turned bearish. These two were enough to turn the indicator summary negative for the first time since March 5th. Techs were also hit hard this week, but the $COMPQ:$NYA ratio remains in an uptrend. In addition, the...
READ MORE
MEMBERS ONLY
SPY gaps and closes strong
by Arthur Hill,
Chief Technical Strategist, TrendInvestorPro.com
Stocks surged with a broad rally that lifted most boats. All major indices were up 3% or so. The Russell 2000 (+3.48%) slightly outperformed the S&P 500 (+2.95%). The Russell 2000 should have been up 5% on a day like today (damper number 1). All sectors...
READ MORE
MEMBERS ONLY

STOCKS SURGE AROUND THE WORLD -- A POSSIBLE SMALL HEAD AND SHOULDERS IN THE S&P 500 -- EURO AND EURO STOXX BOUNCE -- GOLD AND BONDS FALL AS STOCKS RISE -- VOLATILITY INDICES HOLD THEIR MAY BREAKOUTS
by John Murphy,
Chief Technical Analyst, StockCharts.com
STOCKS SURGE AROUND THE WORLD... John Murphy is off today and will return next week. Stock markets around the world moved higher on Thursday. Indices in Japan, Taiwan and Australia got it started with 1+ percent gains. This carried over to Europe where French, German, and Dutch indices also gained...
READ MORE
MEMBERS ONLY

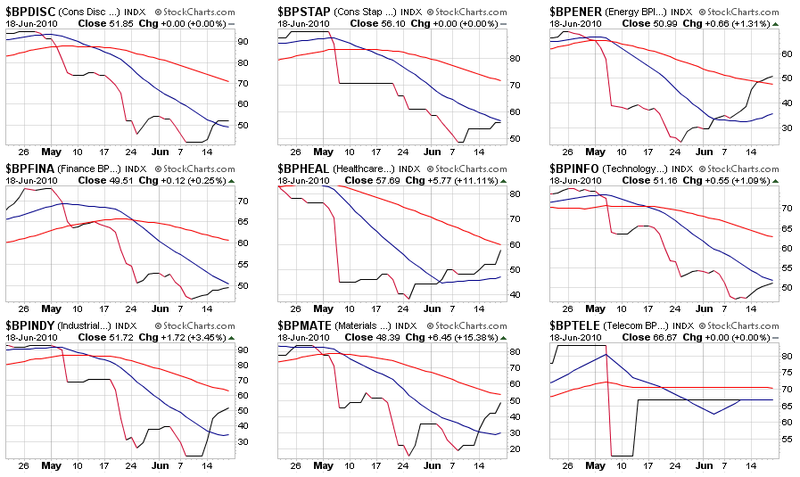
Bullish Percent Indices below 50%
by Arthur Hill,
Chief Technical Strategist, TrendInvestorPro.com
Stockcharts.com tracks the Bullish Percent Indices (BPI) for six major indices and 10 sectors. The BPIs for the major indices are below 50% and eight of the ten sectors have BPIs below 50%. Only telecom and utilities have BPIs above 50%. These numbers can be found at the bottom...
READ MORE
MEMBERS ONLY

Stocks give back their gains
by Arthur Hill,
Chief Technical Strategist, TrendInvestorPro.com
Stocks surged in early trading with SPY moving above 108 in the morning, but gave back these gains, and more, with an afternoon plunge. There it is again: another late round of selling pressure. A lack of buying pressure and a small increase in selling pressure is all it takes...
READ MORE
MEMBERS ONLY

Dow breaks Ichimoku cloud
by Arthur Hill,
Chief Technical Strategist, TrendInvestorPro.com
Ichimoku Clouds, a form of Japanese technical analysis, show a trend reversal in the Dow Industrials. The senior average broke below the cloud formation and the "Standard Line" moved below the cloud formation. This is the red line, which is a moving average of the 26-day high-...
READ MORE
MEMBERS ONLY

MAY SUPPORT LEVELS IN PLAY FOR STOCKS -- MAY RESISTANCE LEVELS IN PLAY FOR BONDS AND GOLD -- EURO STOX50 HOLDS ABOVE MAY LOW AS EURO BREAKS IT -- S&P 500 REMAINS WITHIN HUGE TRADING RANGE -- ABC CORRECTION DEPENDS ON FEBRUARY LOW
by John Murphy,
Chief Technical Analyst, StockCharts.com
MAY LEVELS IN PLAY FOR STOCKS, BONDS AND GOLD... Link for todays video. The major stock index ETFs are getting a bounce off their May lows as bonds and gold hit resistance from their May highs. It is no secret that the Dow and S&P 500 are testing...
READ MORE
MEMBERS ONLY

A lopsided bounce
by Arthur Hill,
Chief Technical Strategist, TrendInvestorPro.com
The stock market rebounded on Tuesday, but the bounce was rather lopsided as techs lagged significantly. The S&P 500 and the Dow gained over 1%, but the Nasdaq and Russell 2000 finished slightly negative. Small-caps and techs are starting to show relative weakness and this is not...
READ MORE
