MEMBERS ONLY

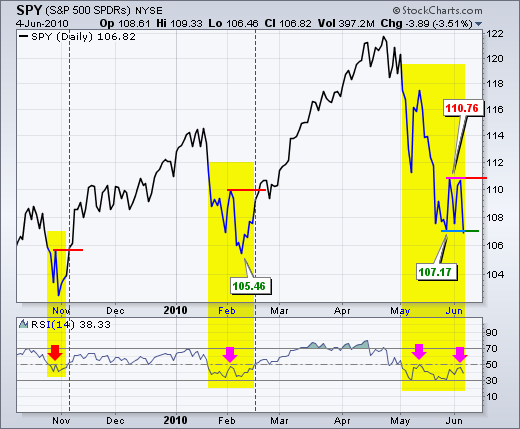
SPY CONTINUES TO BATTLE ITS FEBRUARY LOW -- FINANCE SECTOR FIRMS WITH HARAMI NEAR FEBRUARY LOW -- CONSUMER STAPLES OUTPERFORMING CONSUMER DISCRETIONARY -- XLY HOLDS ABOVE FEBRUARY LOW AS XLP TESTS IT

by John Murphy,
Chief Technical Analyst, StockCharts.com
SPY CONTINUES TO BATTLE ITS FEBRUARY LOW... John Murphy is off Tuesday-Thursday and will return next week. After two sharp declines, stocks managed to firm on Tuesday with the Dow and S&P 500 gaining over 1%. Chart 1 shows the S&P 500 ETF (SPY) firming...
READ MORE
MEMBERS ONLY
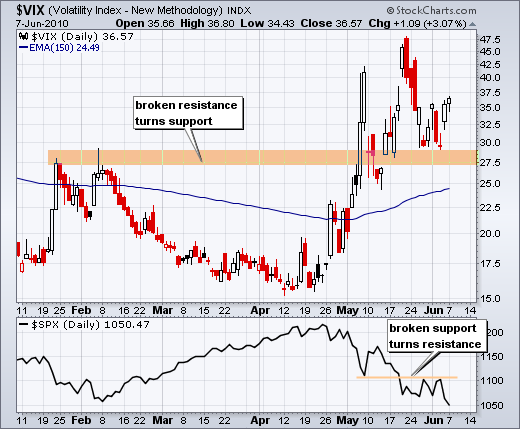
VIX bounces off support

by Arthur Hill,
Chief Technical Strategist, TrendInvestorPro.com
The S&P 500 Volatility Index ($VIX) surged in May and broke above its January-February high. After a pullback, the index found support near broken resistance and bounced the last few days. Also notice that the S&P 500 hit resistance near broken support.
Click this image...
READ MORE
MEMBERS ONLY
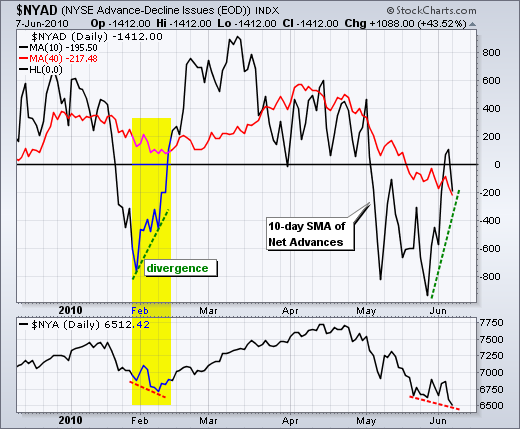
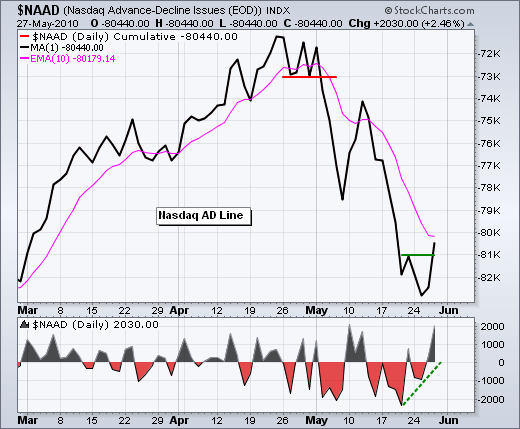
Oversold and near the Feb low
by Arthur Hill,
Chief Technical Strategist, TrendInvestorPro.com
It was another day of heavy selling pressure, but not as heavy as Friday. The AD Lines and AD Volume Lines for the Nasdaq and NYSE all moved to new lows for the move. Even with these new lows, selling pressure is less than it was in May. The first...
READ MORE
MEMBERS ONLY

GOLD AND BONDS SURGE TOWARDS MAY HIGHS -- SMALL CAPS LEAD THE MARKET LOWER -- HEALTHCARE AND UTILITIES HOLD UP IN WEAK MARKET -- LONG-TERM MOMENTUM INDICATOR BREAKS BULL RANGE -- PERCENT OF STOCKS ABOVE 50-DAY SMA BREAKS DOWN
by John Murphy,
Chief Technical Analyst, StockCharts.com
GOLD AND BONDS SURGE TOWARDS MAY HIGHS... Link for todays video. Stocks were weak in Asia, Europe and the US today. Oil and copper followed suit with losses as well. Chart 1 shows Copper Futures ($COPPER) breaking below their February (closing) low on Friday. This is an end of day...
READ MORE
MEMBERS ONLY

An evening star for IBM
by Arthur Hill,
Chief Technical Strategist, TrendInvestorPro.com
With a short-term reversal in stocks over the last three days, the evening star scan was about as full as it's been in a long time. IBM formed an evening star with a long white candlestick on Wednesday, a gap-stall on Thursday and a gap-decline...
READ MORE
MEMBERS ONLY

SPY fails at resistance
by Arthur Hill,
Chief Technical Strategist, TrendInvestorPro.com
Stocks were hit hard on Friday with the major indices losing 3-5%. The Dow held up the best with a 3.15% loss, while the Russell 2000 fared the worst with a 5% loss. Stocks started with a sharp gap down and continued lower throughout the day. Buyers were...
READ MORE
MEMBERS ONLY
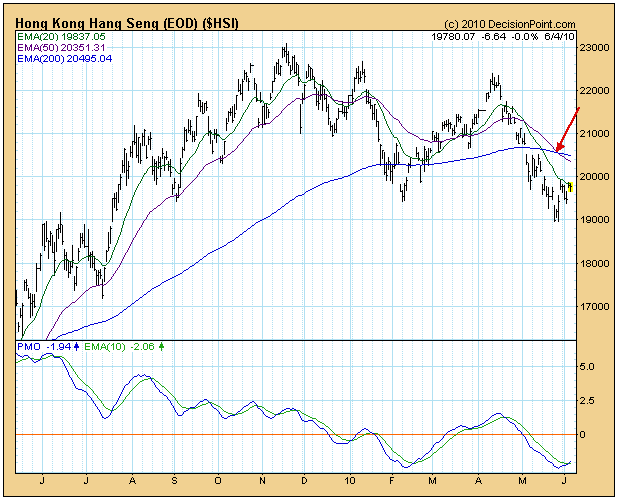
A REVIEW OF GLOBAL MARKETS

by Carl Swenlin,
President and Founder, DecisionPoint.com
A question from a subscriber yesterday prompted me to make a quick review of global markets. I rarely look at global markets because (1) my overriding focus is on the U.S. market and (2) it is my observation that international markets and the U.S. market tend to run...
READ MORE
MEMBERS ONLY
RSI remains bearish for SPY
by Arthur Hill,
Chief Technical Strategist, TrendInvestorPro.com
The Relative Strength Index remains below 50 and bearish for the S&P 500 ETF (SPY). Bounded momentum oscillators trade within a defined range. RSI trades between zero and one hundred with fifty as the centerline. Think of this level as the 50 yard line in a football game....
READ MORE
MEMBERS ONLY
Look out Below!

by Tom Bowley,
Chief Market Strategist, EarningsBeats.com
Technically, this hasn't been brain surgery. Our major indices broke down in early May on very heavy volume and, as technicians, we can never ignore that lethal price/volume combination. The weakness also came on the heels of some of the most extreme complacency that I've...
READ MORE
MEMBERS ONLY
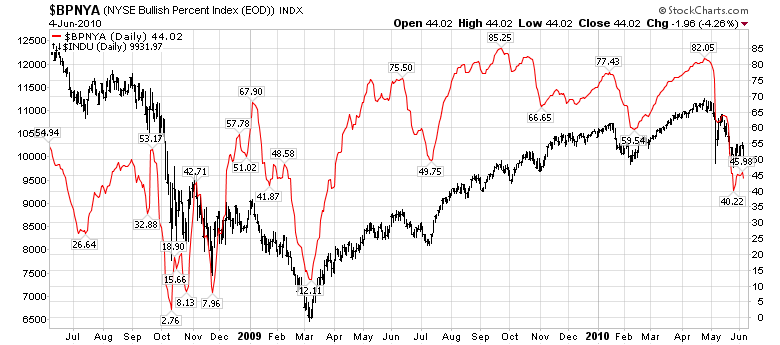
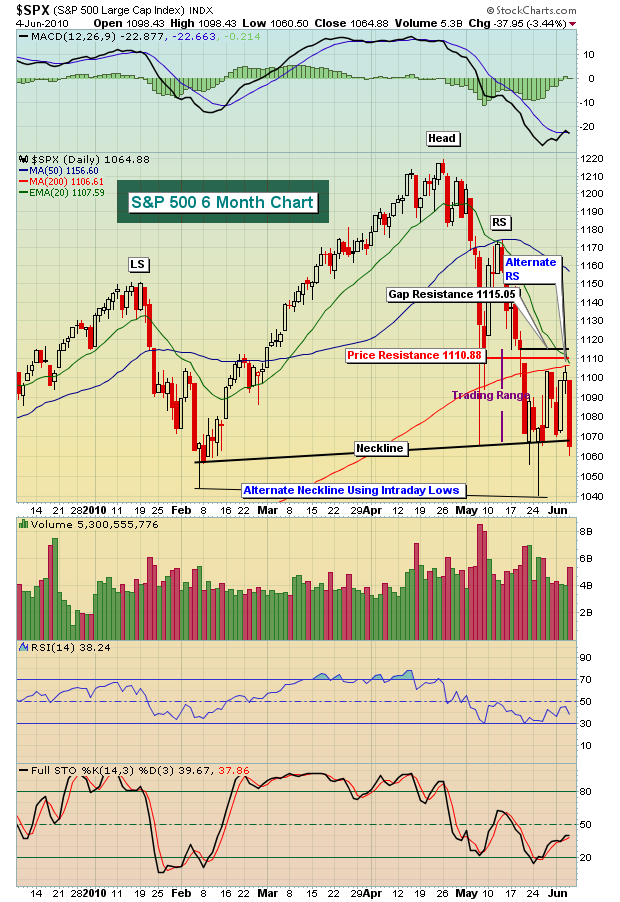
BULLISH PERCENT HANGING ON - BARELY
Hello Fellow ChartWatchers!
Back down below 10,000 we go. This is the fifth time in the past month that the Dow has dipped below that magic number. The past four times resulted in quick rallies back above 10K - will that happen again on Monday? Or have the bulls run...
READ MORE
MEMBERS ONLY

EMPLOYMENT REPORT WEIGHS ON STOCKS AND LIFTS BONDS -- EURO AND EUROPEAN STOCKS FALL SHARPLY -- MACD FORMS DIVERGENCE ON WEEKLY GOLD CHART -- INVERSE GOLD EURO CORRELATION UNDER THREAT -- GOLD MINERS ETF HITS RESISTANCE AT GAP
by John Murphy,
Chief Technical Analyst, StockCharts.com
EMPLOYMENT REPORT WEIGHS ON STOCKS AND LIFTS BONDS... Link for todays video. A negative reaction to todays employment report sent stocks sharply lower on the open. In early trading, the major indices were down around 2% and all sectors were down. Elsewhere, the Dollar was up because of weakness in...
READ MORE
MEMBERS ONLY

XLY and XLK show relative strength
by Arthur Hill,
Chief Technical Strategist, TrendInvestorPro.com
The sector perfchart provides an easy means to identify the leaders and laggards. Even though all sectors are down over the last three weeks (since May 13), some are down more than the S&P 500 (laggards) and some are down less (leaders). It is positive to see the...
READ MORE
MEMBERS ONLY

Indicator Summary remains positive
by Arthur Hill,
Chief Technical Strategist, TrendInvestorPro.com
There is no real change in the indicator summary. The market remains split with some bearish indicators and some bullish indications. This is normal after a severe correction that tests the viability of the long-term bull market (March 2009 to present). Chart-wise, the February lows are holding and...
READ MORE
MEMBERS ONLY

Techs and small-caps lead
by Arthur Hill,
Chief Technical Strategist, TrendInvestorPro.com
Even though the Dow gained just .06% and the S&P 500 was up .46%, the Nasdaq gained .96% and the Russell 2000 was up 1.05%. Techs and small-caps doubled the gains seen in the large-cap dominated S&P 500. Relative strength in these two...
READ MORE
MEMBERS ONLY

Natural Gas ETF surges above April high
by Arthur Hill,
Chief Technical Strategist, TrendInvestorPro.com
The US Natural Gas Fund (UNG) is perking up with a little break above the April-May highs today. However, like the commodity itself, UNG remains in a long-term downtrend. After consolidating the last two months, the breakout argues for an oversold bounce that could retrace 50% of the...
READ MORE
MEMBERS ONLY
A pretty impressive rally
by Arthur Hill,
Chief Technical Strategist, TrendInvestorPro.com
After declining on Friday and Tuesday, stocks rallied throughout the day on Wednesday. This is especially impressive when we consider that European stocks were down sharply and the Euro was getting hit on Wednesday morning. Stocks managed to shrug off bad geopolitical news and rally. There was even a dip...
READ MORE
MEMBERS ONLY
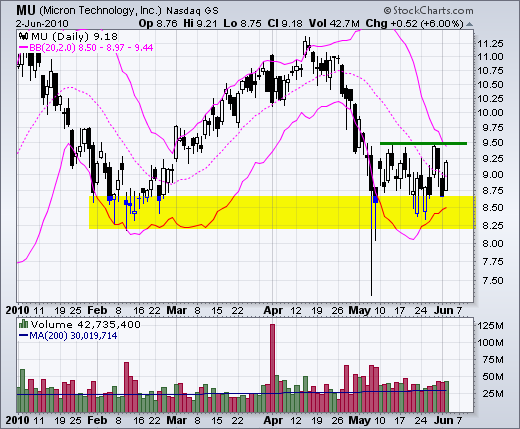
Bollinger Bands contract for Micron
by Arthur Hill,
Chief Technical Strategist, TrendInvestorPro.com
Micron Technology (MU) is testing support with a consolidation over the last four weeks. Support in the 8.25-8.5 area stems from the February lows. The stock has been trading between 8.25 and 9.5 since May 10th. Also notice that the Bollinger Bands are narrowing. Look...
READ MORE
MEMBERS ONLY

S&P 500 SURGES TO HOLD FEBRUARY LOW -- RUSSELL 2000 BOUNCES OFF KEY RETRACEMENT -- SMALL CAP PERFORMANCE FLATTENS -- AIRLINES LEAD THE MARKET HIGHER -- AMR AND CAL SURGE -- HOMEBUILDERS FIRM AT SUPPORT -- PHM AND TOL HIT KEY RETRACEMENT
by John Murphy,
Chief Technical Analyst, StockCharts.com
S&P 500 SURGES TO HOLD FEBRUARY LOW... Link for todays video. The February low represents the last big reaction low and an important support zone for the S&P 500. A break below this support zone would forge a lower low and signal the start of a...
READ MORE
MEMBERS ONLY

SPY breaks wedge support
by Arthur Hill,
Chief Technical Strategist, TrendInvestorPro.com
Weakness in Asia and Europe led to a weak open on Wall Street, but stocks managed to firm in the first hour and tech stocks led a morning rebound. These gains were holding in the early afternoon, but selling pressure in the final hour pushed stocks sharply lower. Small-caps...
READ MORE
MEMBERS ONLY

3 Inside Days for Microsoft
by Arthur Hill,
Chief Technical Strategist, TrendInvestorPro.com
After becoming oversold and plunging on high volume last week, Microsoft is starting to firm with three inside days. Notice the long red candlestick on high volume four days ago. Was that a selling climax? The stock has traded the last three days in the upper half of the long...
READ MORE
MEMBERS ONLY

DOW AND S&P 500 REMAIN BELOW 200-DAY LINE -- COPPER AND OIL LEAD COMMODITY GROUP LOWER -- CHINESE WEAKNESS WEIGHS ON ENERGY AND MATERIAL STOCKS -- GOLD RALLIES -- INVESTMENT GRADE BONDS DROP
by John Murphy,
Chief Technical Analyst, StockCharts.com
MARKET BOUNCE REMAINS CONTAINED ... The inability of major market indexes to reclaim (or stay above) their 200-day moving average is some cause for concern. Charts 1 and 2 show the recent bounce in the Dow Industrials and S&P 500 meeting with resistance at their 200-day line....
READ MORE
MEMBERS ONLY

Getting cold feet already
by Arthur Hill,
Chief Technical Strategist, TrendInvestorPro.com
Last week's reversal and breakout at 110 were positive, but the five week trend remains down. Participants got cold feet on Friday as SPY moved back below 110 by the close. Nevertheless the ETF is holding the majority of last Thursday's gains. A move below 106....
READ MORE
MEMBERS ONLY

SMALL CAPS HOLDING UP BETTER THAN LARGE CAPS -- INTERMARKET DYNAMICS SHOW INVERSE STOCK BOND RELATIONSHIP -- GOLD FORMS WEEKLY BEARISH ENGULFING -- OIL FINDS SUPPORT AROUND 70 AGAIN -- BONDS HIT LONG TERM RESISTANCE ZONE
by John Murphy,
Chief Technical Analyst, StockCharts.com
SMALL-CAPS HOLDING UP BETTER THAN LARGE-CAPS ... Link for todays video. While the S&P 500 ETF (SPY) tested its February low this month, the Russell 2000 ETF (IWM) held well above its February low. Chart 1 shows SPY dipping below 106 three times this month and recovering...
READ MORE
MEMBERS ONLY
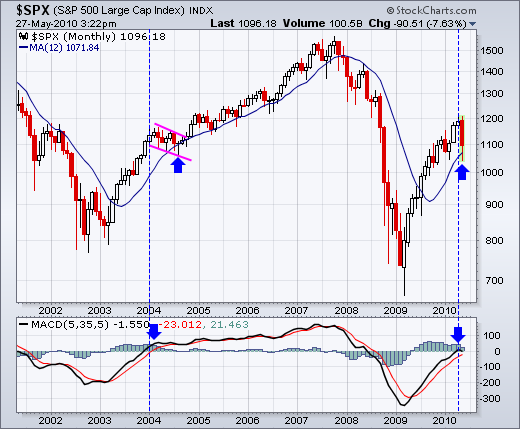
S&P 500 tests 12-month moving average
by Arthur Hill,
Chief Technical Strategist, TrendInvestorPro.com
With the May decline, the S&P 500 tested the rising 12-month moving average for the first time since breaking above in July. Also notice that MACD (5,35,5) turned positive for the first time since the first half of 2008. The bulls are in good shape...
READ MORE
MEMBERS ONLY
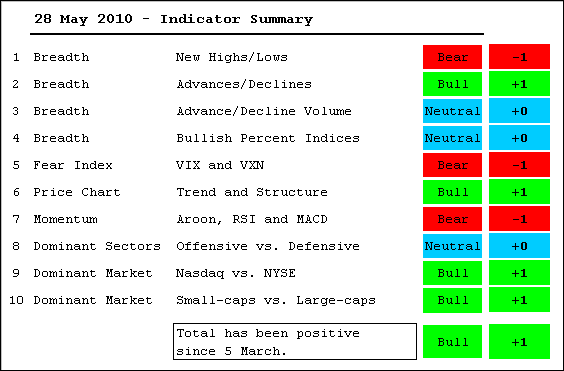
Indicator Summary remains positive
by Arthur Hill,
Chief Technical Strategist, TrendInvestorPro.com
The Indicator Summary remains positive, just barely. I changed the name to better reflect the actual contents of the table. Two lagging indicators turned this week. Net New Highs turned bearish as the 10-day SMA moved into negative territory. The Bullish Percent Indices turned neutral because some moved below...
READ MORE
MEMBERS ONLY
A reversal and breakout
by Arthur Hill,
Chief Technical Strategist, TrendInvestorPro.com
Stocks surged with a broad rally that lifted most boats. Over 90% of NYSE stocks advanced and over 85% of Nasdaq stocks were up on the day. Over 97% of NYSE volume was attributed to advancing issues. Over 90% of Nasdaq volume went into advancers. All major indices were up...
READ MORE
MEMBERS ONLY

MARKET BOUNCES SHARPLY OFF FEBRUARY LOW -- S&P MAY REGAIN A THIRD TO A HALF OF THE MAY LOSS -- TAKE SOME PROFITS IN BEAR FUNDS
by John Murphy,
Chief Technical Analyst, StockCharts.com
SHORT-TERM OVERSOLD CONDITION LEADS TO MARKET BOUNCE... The combination of a short-term oversold condition and the presence of chart support at the February low has produced gains of more than 2% in most major stock indexes, including the S&P 500. The short-term oversold condition in...
READ MORE
MEMBERS ONLY

$SPX is stuck in the middle
by Arthur Hill,
Chief Technical Strategist, TrendInvestorPro.com
Talk about the lost decade. With the May decline, the S&P 500 is trading in the middle of its 10 year range. Note that this is a semi-log scale that reflects percentage change. We are looking at the mother of all consolidations.
Click this image for details...
READ MORE
MEMBERS ONLY

Inverse HS forms on 30-minute chart
by Arthur Hill,
Chief Technical Strategist, TrendInvestorPro.com
SPY followed through on Tuesday's reversal day with a surge above 109 in early trading, but failed to hold early gains and closed in negative territory for the day. It looks like a redux of Friday-Monday. While the inability to follow through is not positive, the two...
READ MORE
MEMBERS ONLY

Retail SPDR establishes clear resistance
by Arthur Hill,
Chief Technical Strategist, TrendInvestorPro.com
The Retail SPDR (XRT) is finding support just above the rising 150-day EMA with two white candlesticks in the last four days. There was a follow through attempt on Wednesday, but the ETF closed weak to establish resistance instead. Look for a move above Wednesday's high to...
READ MORE
MEMBERS ONLY

STOCKS GIVE UP EARLY GAINS -- DISCRETIONARY AND INDUSTRIALS SECTORS BATTLE KEY RETRACEMENTS -- FINANCE AND TECHNOLOGY SECTORS BATTLE FEBRUARY LOWS -- TRANSPORT GETS A LIFT -- AIRLINE INDEX SHOWS RELATIVE STRENGTH
by John Murphy,
Chief Technical Analyst, StockCharts.com
STOCKS GIVE UP EARLY GAINS... Link for todays video. Stocks opened strong and remained in positive territory most of the day, but afternoon selling pressure erased early gains. The S&P 500 and S&P 100 (large-caps) finished in negative territory, but the Russell 2000 and S&...
READ MORE
MEMBERS ONLY
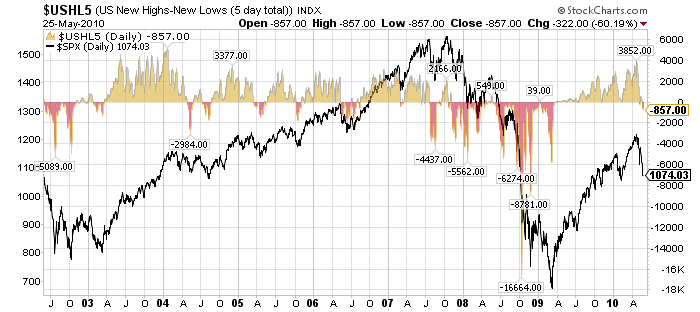
Elder's Weekly New Highs - New Lows
Here's a 8 year look at a new market indicator that we just added to the website - the "Weekly New High - New Low Index" popularized by Dr. Alexander Elder in his books.
Click here for a live version of this chart.
The index (in yellow and...
READ MORE
MEMBERS ONLY

Another big recovery candlestick
by Arthur Hill,
Chief Technical Strategist, TrendInvestorPro.com
The pieces are in place for a short-term bounce, but we have yet to see the catalyst that actually reverses the 5-week downtrend. On the daily chart, SPY opened weak with a gap below last week's low and then rallied to close near the high for...
READ MORE
MEMBERS ONLY

KOREAN MARKET LEADS GLOBAL STOCKS LOWER -- MOST FOREIGN MARKETS HAVE ALREADY BROKEN THEIR FEBRUARY LOWS -- TECHNICAL ODDS SUGGEST THE US MARKET WILL PROBABLY DO THE SAME
by John Murphy,
Chief Technical Analyst, StockCharts.com
NOW IT'S ASIA FALLING... First it was China that started falling a few months ago which gave an early warning of global weakness. Then it was Europe pulling the rest of the world lower, which is where most of the attention has been focused over the last month....
READ MORE
MEMBERS ONLY

A test of the February lows looms
by Arthur Hill,
Chief Technical Strategist, TrendInvestorPro.com
On the daily chart, SPY remains in a 4-5 week downtrend with support from the February lows close at hand. Support in the 106 area is confirmed by the February lows, the May flash-crash low and Friday's piercing line. In addition, SPY was oversold after a...
READ MORE
MEMBERS ONLY

Garmin forms triangle consolidation
by Arthur Hill,
Chief Technical Strategist, TrendInvestorPro.com
After a gap down and sharp decline in early May, Garmin (GRMN) formed a triangle consolidation the last few weeks. The gap and support break around 36 are bearish. A break below triangle support would signal a continuation of this decline.
Click this image for details...
READ MORE
MEMBERS ONLY

BANKS, REITS AND BROKERS WEIGH ON THE MARKET -- LATE SELLING PRESSURE PUSHES TECHS IN THE RED -- INDUSTRIALS AND ENERGY SPDRS FORM PIERCING LINES -- FINANCE AND CONSUMER DISCRETIONARY SPDRS FORM ENGULFING LINES
by John Murphy,
Chief Technical Analyst, StockCharts.com
BANKS, REITS AND BROKERS WEIGH ON THE MARKET... Link for todays video. Weakness in finance related stocks weighed on the overall market on Monday. The European debt crisis and financial reform in the US are the clouds of uncertainty overhanging the banking stocks. Gains one day are met by selling...
READ MORE
MEMBERS ONLY
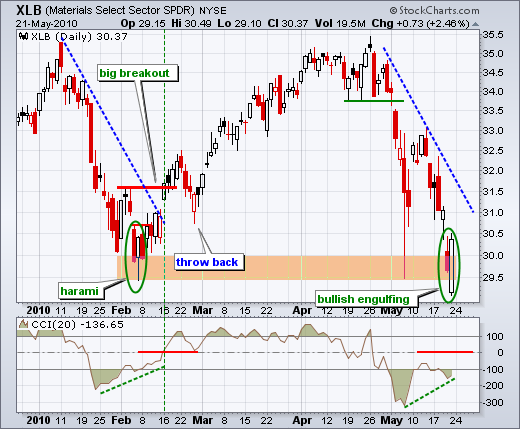
Materials SPDR tests February low
by Arthur Hill,
Chief Technical Strategist, TrendInvestorPro.com
The Materials SPDR (XLB) was one of the hardest hit sector SPDRs over the last four weeks. After a 15+ percent decline, the ETF is testing support from the February low. A big bullish engulfing pattern formed on Friday as the ETF opened weak and closed strong. Notice how the...
READ MORE
MEMBERS ONLY

Oversold and near support
by Arthur Hill,
Chief Technical Strategist, TrendInvestorPro.com
The decline over the last four weeks was severe, but still within the realm of a bigger uptrend. The weekly chart still sports a series of higher highs and higher lows. A break below the February low is needed to end this series and call for the end of the...
READ MORE
MEMBERS ONLY
BLOG ARTICLES WORTH READING
Hello Fellow ChartWatchers!
One of the more unexpected pieces of feedback that I've gotten as I have travelled around recently is that some people aren't reading our free Blog Articles because they associate blogs with rumor, innuendo, amateur writing, and lots of false information. While that...
READ MORE
