MEMBERS ONLY
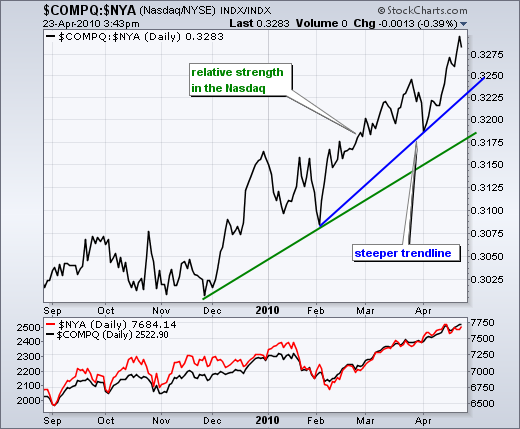
Nasdaq outperformance accelerates

by Arthur Hill,
Chief Technical Strategist, TrendInvestorPro.com
The Nasdaq has been outperforming the NY Composite since December and outperformance is accelerating. The green trendline defines the first rate of outperformance. The blue trendline, which is steeper, defines the second rate of outperformance. Also notice how the Nasdaq:NY Composite price relative shot higher in April.
Click this...
READ MORE
MEMBERS ONLY

EURO BOUNCES OFF PRIOR LOWS AS GREECE ACCEPTS AID - FALLING DOLLAR SPURS BUYING IN SILVER AND GOLD - OIL AND OIL-RELATED SHARES SURGE - BONDS TEST RESISTANCE AS FED CONSIDERS ASSET SALES - PERCENT OF STOCKS ABOVE 50-DAY LINES SURGES TO PRIOR HIGHS

by John Murphy,
Chief Technical Analyst, StockCharts.com
EURO BOUNCES OFF PRIOR LOWS AS GREECE ACCEPTS AID... Link for todays video. Debt-laden Greece formally requested assistance from the EU and IMF. News of possible bailout to help Greece get through the year lifted the Euro. Chart 1 shows the Euro ETF (FXE) finding support near the prior...
READ MORE
MEMBERS ONLY
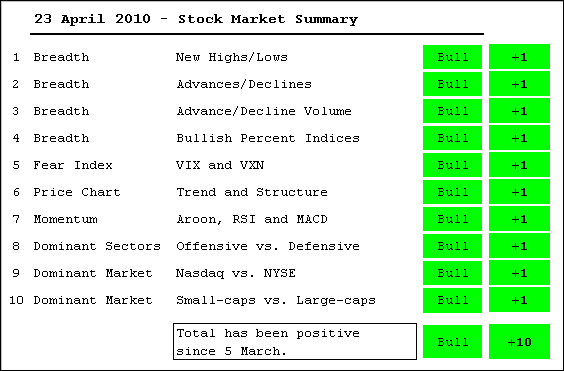
Medium-Term Evidence Remains Bullish
by Arthur Hill,
Chief Technical Strategist, TrendInvestorPro.com
There is no change in the Stock Market Summary this week. The bulk of the evidence turned bullish again on March 5th and remains bullish. All 10 indicators are in bull mode. The only potential negative is the frothiness of the current advance. Nasdaq outperformance surged this month and small-...
READ MORE
MEMBERS ONLY
Resilience rules the day
by Arthur Hill,
Chief Technical Strategist, TrendInvestorPro.com
After a gap down and weak open, the S&P 500 ETF (SPY) firmed throughout the morning and then surged in the late afternoon to close positive. Once again, the bulls remain resilient as even the smallest dips bring out the buyers. The consumer discretionary sector and small-caps...
READ MORE
MEMBERS ONLY
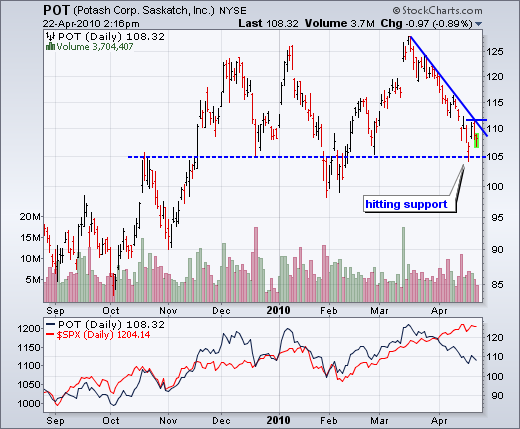
Potash hits support
by Arthur Hill,
Chief Technical Strategist, TrendInvestorPro.com
After a sharp decline the last five weeks, Potash (POT) hit support last week and bounced this week. A nice three candlestick reversal formed Thursday-Friday-Monday, but the stock fell back on Tuesday-Wednesday. Upside follow through would affirm support and trigger a short-term breakout.
Click this image...
READ MORE
MEMBERS ONLY
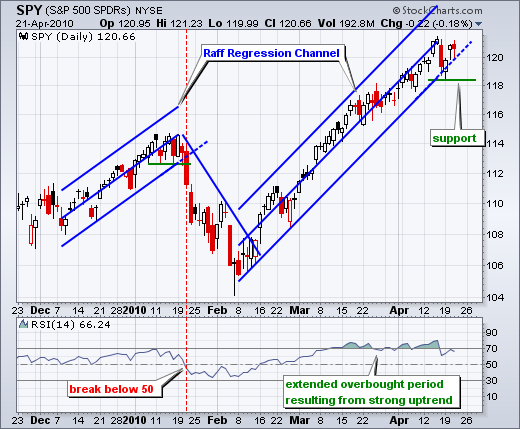
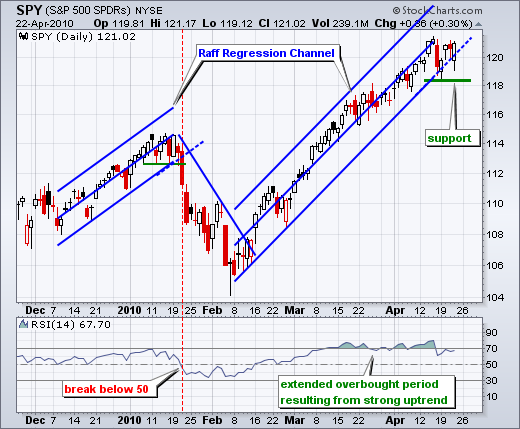
SPY stalls below prior high
by Arthur Hill,
Chief Technical Strategist, TrendInvestorPro.com
There is no change on the daily chart as SPY remains just above the Raff Regression Channel extension. SPY affirmed channel support with a reversal day on Monday and bounced on Tuesday. There was not much upside follow through after Tuesday's strong open as the ETF stalled around...
READ MORE
MEMBERS ONLY
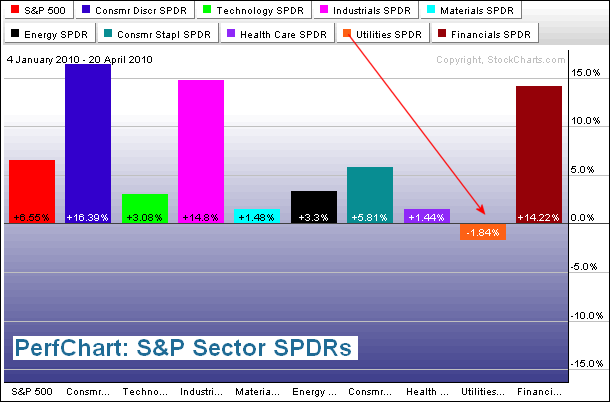
Utilities down for the year
by Arthur Hill,
Chief Technical Strategist, TrendInvestorPro.com
The Utilities SPDR (XLU) is not partaking in the 2010 market advance. While the S&P 500 is up over 6% year-to-date, the defensive oriented XLU is down almost 2%. It is the only sector sporting a loss this year. In sharp contrast, the offensive oriented consumer...
READ MORE
MEMBERS ONLY

QQQQ AND SPY EXCEED CHANNEL TRENDLINES - SMH GIVES UP EARLY GAINS - GOLD HOLDS BREAKOUT ON WEEKLY CHART AND HITS RESISTANCE ON DAILY CHART - GOLD-DOLLAR RELATIONSHIP TURNS POSITIVE - SHANGHAI COMPOSITE LAGS OTHER BRIC COUNTRIES AND THE US
by John Murphy,
Chief Technical Analyst, StockCharts.com
QQQQ AND SPY EXCEED CHANNEL TRENDLINES... Link for todays video. The Nasdaq 100 ETF (QQQQ) and S&P 500 ETF (SPY) were featured with rising price channels in the March 29th Market Message. These channels are still there, but charts 1 and 2 shows these ETFs exceeding their upper...
READ MORE
MEMBERS ONLY
SPY holds channel support; Charts: APA,CCI,CTXS,DISH,FTR,LIFE,QCOM,SYMC,THC
by Arthur Hill,
Chief Technical Strategist, TrendInvestorPro.com
We made it through the ash cloud and I am back at the office with my normal work setup (computers, big monitors, Nespresso, etc...). Office sweet office!
After a sharp decline on Friday, SPY recovered from early weakness on Monday and extended its gains on Tuesday. Once again, the pullback...
READ MORE
MEMBERS ONLY
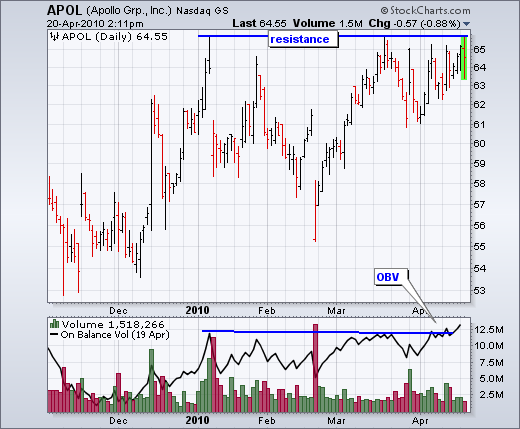
APOL consolidates near resistance
by Arthur Hill,
Chief Technical Strategist, TrendInvestorPro.com
The chart for Apollo Group (APOL) sports a consolidation pattern that looks like an inverse head-and-shoulders. Resistance in the 65-66 area stems from reaction highs in January-March as well as the consolidation in April. A break above these highs would be bullish. Notice that OBV already...
READ MORE
MEMBERS ONLY

OIL SERVICE HOLDERS LEAD ENERGY SECTOR INTO ANOTHER TEST OF OLD HIGHS -- CONOCOPHILLIPS AND HALLIBURTON ARE ENERGY LEADERS -- STRONG CANADIAN DOLLAR IS GOOD FOR OIL PRICES -- SURGING LUMBER MARKET MAY HOLD GOOD NEWS FOR HOUSING SECTOR
by John Murphy,
Chief Technical Analyst, StockCharts.com
ENERGY SPDR TESTS JANUARY HIGH... One of the themes I've repeated over the past few weeks is that commodity-related stocks should start playing catchup to the rest of the market. I mentioned energy stocks in particular. After a modest dip last week, the energy sector is today&...
READ MORE
MEMBERS ONLY

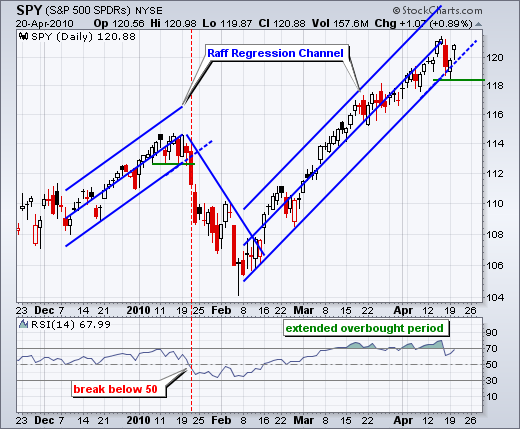
SPY hits channel support
by Arthur Hill,
Chief Technical Strategist, TrendInvestorPro.com
After a sharp decline on Friday and further weakness early Monday, the S&P 500 ETF (SPY) recovered and managed to firm at the Raff Regression Channel. This channel defines the current advance and a break below would call for a re-evaluation of this uptrend.
Click this image...
READ MORE
MEMBERS ONLY

MATERIALS SPDR BACKS OFF RESISTANCE - RISK-AVERSION TRADE RETURNS AS DOLLAR BOUNCES - EURO ETF RETURNS TO BROKEN TRENDLINE - ENERGY SPDR ALSO HITS RESISTANCE - OIL SERVICE HOLDRS FORMS LARGE DIAMOND
by John Murphy,
Chief Technical Analyst, StockCharts.com
MATERIALS SPDR BACKS OFF RESISTANCE ZONE... The Materials SPDR (XLB) is running into resistance on both the daily and weekly charts. First, chart 1 shows a long-term resistance zone from broken supports and the 62% retracement mark. Also note that XLB is up around 100% from its March 2009...
READ MORE
MEMBERS ONLY
Breadth and intermarket charts updated
by Arthur Hill,
Chief Technical Strategist, TrendInvestorPro.com
Note that Net Advances on the Nasdaq and NYSE plunged to their lowest levels since February. Net Advancing Volume on the NYSE and Nasdaq also plunged to its lowest level since February.
Click here for breadth charts and here for intermarket charts....
READ MORE
MEMBERS ONLY
Flying through the ash
by Arthur Hill,
Chief Technical Strategist, TrendInvestorPro.com
After being stranded for a few days, we finally caught a flight home that will arrive on Tuesday. Unfortunately, I will not be able to provide an SPY update on Tuesday. Normal updates will continue on Wednesday, provided we make it through the volcanic ash!...
READ MORE
MEMBERS ONLY
SOME SLIDES FROM MY "WORLD TOUR"
For the past couple of months, I've been visiting with investments clubs around the country who have been gracious enough to invite me to talk. So far I've talked with clubs in Portland, Pheonix and Dallas. Calgary, Denver, and Houston are coming up with east coast...
READ MORE
MEMBERS ONLY

SPY hits short-term support zone
by Arthur Hill,
Chief Technical Strategist, TrendInvestorPro.com
I am almost back in the saddle. Vacations are great, but it usually takes a day or two to get re-acclimated to the market environment. Stocks remained strong the last two weeks as the major index ETFs hit new highs for the move last week. The Dollar slipped as...
READ MORE
MEMBERS ONLY
FINANCIALS FALL HEAVILY
by John Murphy,
Chief Technical Analyst, StockCharts.com
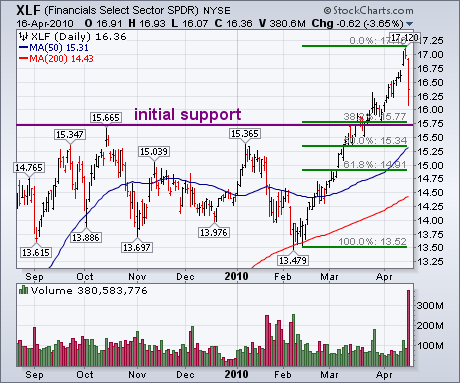
Financial stocks are considered to be leading indicators for the rest of the market. Over the last year, the group has led the market higher. Yesterday, they led it lower. The chart below shows the Financial SPDR (XLF) falling 3.6% on huge volume. The big volume is more serious...
READ MORE
MEMBERS ONLY
FINANCIALS TOPPING?

by Tom Bowley,
Chief Market Strategist, EarningsBeats.com
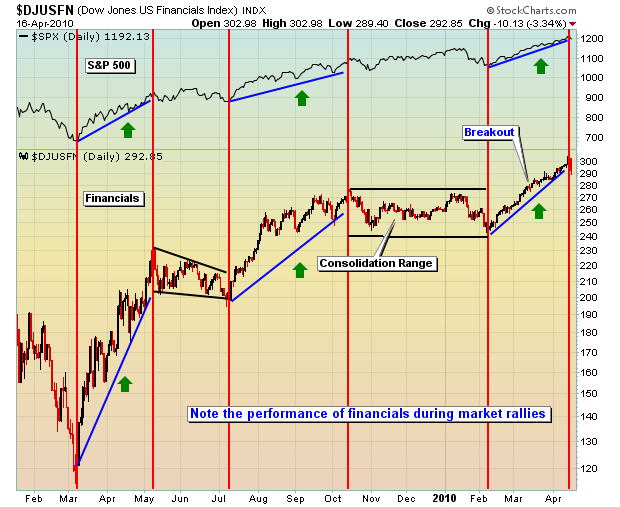
In my first article of 2010, I indicated that financials would need to lead on a relative basis in order for us to see strength in overall equity prices this year. Until late last week, financials have performed very well on a relative basis. Take a look visually at what...
READ MORE
MEMBERS ONLY
CONSUMER DISCRETIONARY STOCKS PRIMED TO LEAD

by Richard Rhodes,
Founder and President, Rhodes Capital Management and Rhodes Trading Group
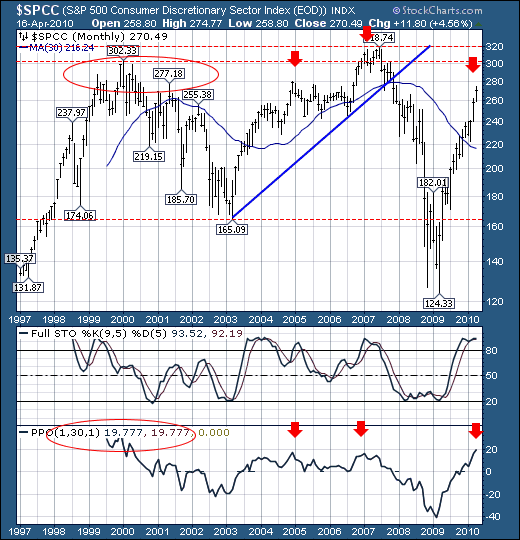
Since the beginning of the year, the market "Generals" if you will have been the S&P Consumer Discretionary, S&P Financial and S&P Industrial sectors given they are the only sectors to have out-performed the S&P 500. However, there is...
READ MORE
MEMBERS ONLY
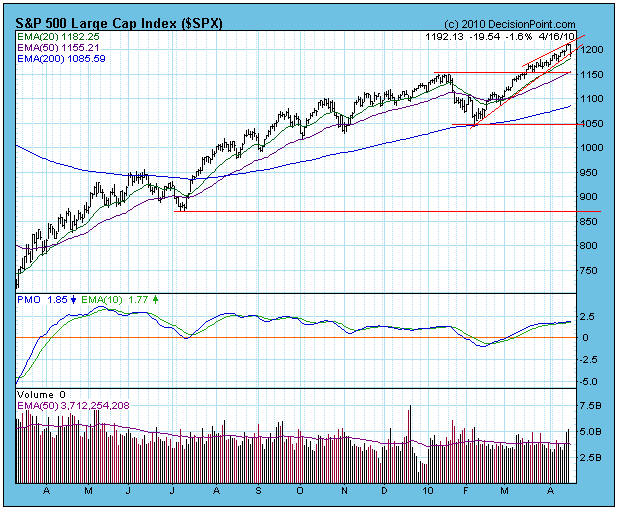
BREAKOUT FAILS

by Carl Swenlin,
President and Founder, DecisionPoint.com
STOCKS: Based upon a 3/1/2010 Thrust/Trend Model buy signal, our current intermediate-term market posture for the S&P 500 is bullish. The long-term component of the Trend Model is on a buy signal as of 8/11/2009.
On Wednesday the S&P...
READ MORE
MEMBERS ONLY

FINANCIAL DROP PULLS MARKET LOWER -- THE FACT THAT OVERSOLD TREASURY BOND PRICES ARE STARTING TO BOUNCE OFF CHART SUPPORT MAY ALSO SUGGEST THAT STOCKS ARE DUE FOR A PULLBACK
by John Murphy,
Chief Technical Analyst, StockCharts.com
GOLDMAN SACHS PLUNGES NEARLY 13%... The SEC sued Goldman Sachs on Friday for fraud in the mortage market. That shocking news caused the stock to plunge nearly 13% on huge trading volume. Chart 1 shows the chart damage. GS hasn't exactly been a market leader over the has...
READ MORE
MEMBERS ONLY

SPX: now versus 1965 to 1980
by Arthur Hill,
Chief Technical Strategist, TrendInvestorPro.com
From the historical charts at Stockcharts.com, we have cutouts of two large trading ranges. The S&P 500 was largely range bound from the mid 60s to the late 70s (~15 years) and from the late 90s until the present (~13 years). The current rally looks similar to...
READ MORE
MEMBERS ONLY

SECTOR RANKINGS SHOW BULLISH CONFIDENCE -- TOP 2010 PERFORMERS ARE FINANCIALS, DISCRETIONARY, SMALL CAPS, TRANSPORTS, AND THE NASDAQ -- DEFENSIVE GROUPS LAG BEHIND -- MARKET BREADTH REMAINS POSITIVE AS NYSE ADVANCE-DECLINE HITS RECORD HIGH
by John Murphy,
Chief Technical Analyst, StockCharts.com
GROUP LEADERSHIP SHOWS CONFIDENCE... The fact that major market indexes are hitting new recovery highs is a vote of confidence for the market and the economy. That's because the stock market is a leading indicator of the economy. What's also impressive is where market leadership is...
READ MORE
MEMBERS ONLY

Gold-Dollar relationship challenged
by Arthur Hill,
Chief Technical Strategist, TrendInvestorPro.com
The nine year chart for the US Dollar Index ($USD) and Gold-Continuous Futures ($GOLD) shows a clear inverse relationship from 2002 until 2007. Gold advanced as the Dollar declined. This inverse relationship continued with the swings of 2008 and 2009 (Dollar down/gold up and visa versa). The potential...
READ MORE
MEMBERS ONLY

SEMICONDUCTOR SURGE GIVES MARKET A BIG BOOST -- THAT'S MAY ALSO BE HELPING BULLISH BREAKOUT IN ASIA -- A WEAKER DOLLAR SHOULD ALLOW COMMODITIES (AND STOCKS TIED TO THEM) TO PLAY CATCHUP TO THE STOCK MARKET -- NATIONAL SEMICONDUCTOR BREAKS OUT
by John Murphy,
Chief Technical Analyst, StockCharts.com
SOX INDEX SOARS... Nearly two weeks ago (April 1) I showed the Semiconductor (SOX) Index breaking through its January high at 370 and noted that was giving a nice boost to technology shares and the market as whole. That positive effect is even more obvious today. Chart 1 shows the...
READ MORE
MEMBERS ONLY

Long-term support for the Euro
by Arthur Hill,
Chief Technical Strategist, TrendInvestorPro.com
The Euro Index ($XEU) appears to be in a long-term downtrend with the next support zone around 117-120. With a lower high in December, a falling channel is taking shape. The lower trendline extends to 115 and there is support around 117-120 from the 2004-2005 lows....
READ MORE
MEMBERS ONLY

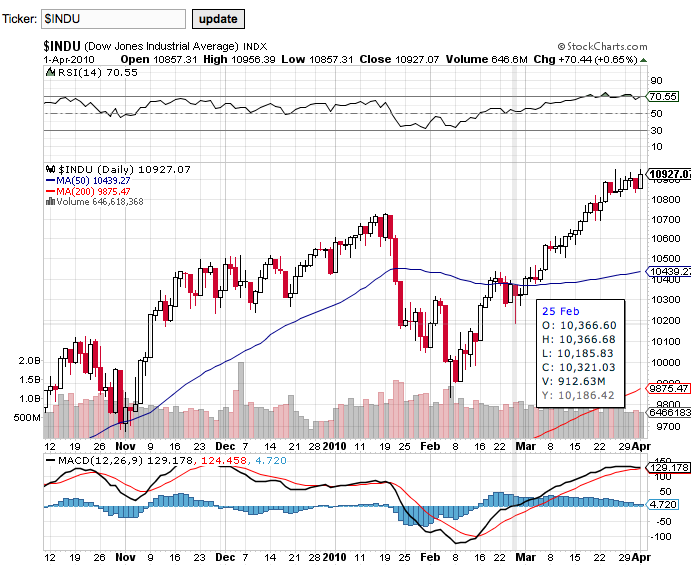
DOW 11000 DOESN'T HAVE MUCH TECHNICAL SIGNIFICANCE AND PROBABLY WON'T STOP THE DOW'S ADVANCE -- BUT CHART RESISTANCE IS VISIBLE BETWEEN 11200 AND 11600 -- KEEP AN EYE ON UPPER MONTHLY BOLLINGER BAND AS A POTENTIAL UPSIDE TARGET
by John Murphy,
Chief Technical Analyst, StockCharts.com
DOW REACHES 11000... A lot is being made in the media about the ability of the Dow Industrials to reach the 11,000 level which has led to a discussion as to whether or not that number means anything. That's what we'll try to determine here....
READ MORE
MEMBERS ONLY
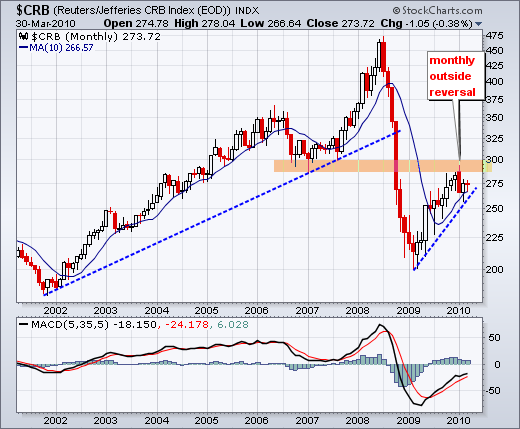
CRB forms monthly outside reversal
by Arthur Hill,
Chief Technical Strategist, TrendInvestorPro.com
The CRB Index ($CRB) advanced with the stock market in 2009, but hit resistance from broken support and formed a monthly outside reversal. This is also known as a bearish engulfing. The combination of resistance and reversal could cap this rally. A monthly close below the rising 10-month SMA...
READ MORE
MEMBERS ONLY
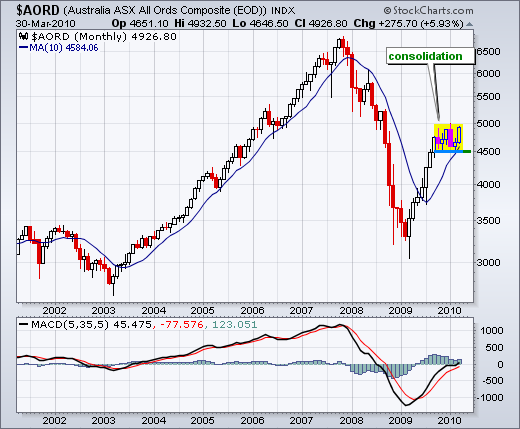
All Ords establish support
by Arthur Hill,
Chief Technical Strategist, TrendInvestorPro.com
The Australian All Ords Composite ($AORDS) has been rallying with the rest of the world over the last 14 months. With a stall around 4500-5000 the last six months, the index established support at 4500. "No worries" for the bulls as long as this support level holds....
READ MORE
MEMBERS ONLY

EMERGING CURRENCIES HAVE BEEN RISING AGAINST THE DOLLAR -- EVEN THE CHINESE YUAN IS CLIMBING -- WHY RISING BOND YIELDS ARE GOOD FOR STOCKS AND BAD FOR TREASURIES -- OTHER BOND CATEGORIES ARE LESS RATE SENSITIVE
by John Murphy,
Chief Technical Analyst, StockCharts.com
EMERGING MARKET CURRENCIES ARE RISING... My Tuesday message repeated the view that the 2010 increase in the U.S. Dollar Index has masked gains in a lot of foreign currencies (mainly because of its heavy weighting in Europe and Japan). I showed February upturns in commodity-based currencies like the...
READ MORE
MEMBERS ONLY
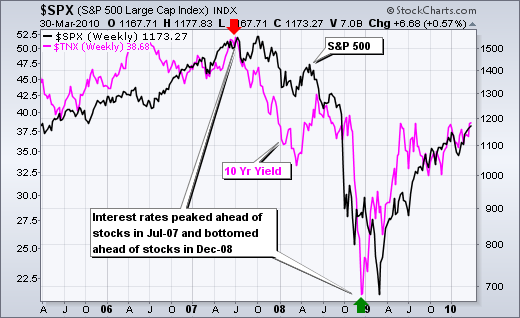
Stocks follow interest rates
by Arthur Hill,
Chief Technical Strategist, TrendInvestorPro.com
Are rising rates bullish or bearish for the stock market? Those answering bearish may want to consider the chart below. Over the last five years, there appears to be a positive correlation between the 10-Year Treasury Yield ($TNX) and the S&P 500. Both rise and fall together....
READ MORE
MEMBERS ONLY
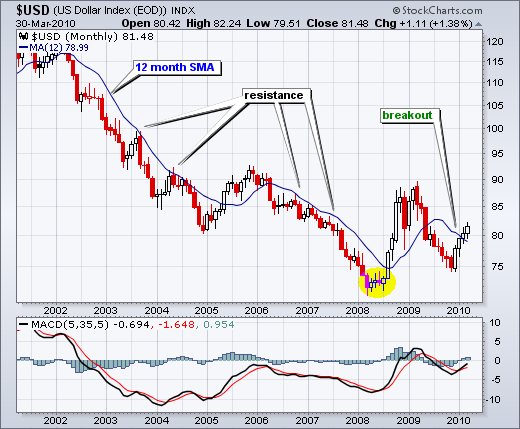
Dollar Index breaks 12-month SMA
by Arthur Hill,
Chief Technical Strategist, TrendInvestorPro.com
The 12-month SMA provides a pretty good clue on the overall direction for the US Dollar Index ($USD). There have been six crosses since 2002. Downside breaks captured long downtrends in 2002-2004 and 2006-2007. The upside breaks produced relatively short rallies that lasted almost a year. The...
READ MORE
MEMBERS ONLY

GOLD AND GOLD MINERS INDEX TURN UP -- NEWMONT AND SILVER WHEATEN ARE GDX LEADERS -- BARRICK GOLD IS BREAKING OUT -- GOLD MINERS BULLISH PERCENT INDEX SHOWS MOST GDX STOCKS HAVE TURNED UP
by John Murphy,
Chief Technical Analyst, StockCharts.com
GLD COMPLETES H&S BOTTOM ... In last Thursday's message, I wrote a positive piece on commodity prices in general, and precious metals in particular (PRECIOUS METALS ARE TURNING UP). Part of my renewed optimism on the group was caused by the fact that silver had already turned...
READ MORE
MEMBERS ONLY

XLE and XLU come up short
by Arthur Hill,
Chief Technical Strategist, TrendInvestorPro.com
With the advance over the last 13 months, the Energy SPDR (XLE) and the Utilities SPDR (XLU) retraced less than 50% of the prior declines. Excluding the Financials SPDR (XLF), these retracements were the shallowest of the eight sector SPDRs, which makes these two chart laggards over the last few...
READ MORE
MEMBERS ONLY

WHY COMMODITIES ARE STRONGER THAN THEY APPEAR WHILE THE DOLLAR IS WEAKER -- TOO MUCH FOCUS IS BEING PLACED ON THE WEAK EURO AND NOT ENOUGH ON RISING COMMODITY CURRENCIES
by John Murphy,
Chief Technical Analyst, StockCharts.com
DOLLAR STRENGTH COMES FROM EUROPE AND JAPAN ... In a message dated March 2, I expressed the view that the dollar wasn't as strong as it appeared to be. I also wrote that an upturn in commodity-based currencies would lend support to commodity prices. I'd like...
READ MORE
MEMBERS ONLY

XLP nears 2007 high
by Arthur Hill,
Chief Technical Strategist, TrendInvestorPro.com
The Consumer Staples SPDR (XLP) is the only one of the nine sector SPDRs challenging its 2007 high. The other 8 sector SPDRs are not even close. While XLP may be lagging in percentage terms, its advance over the last 13 months is the strongest in chart terms because the...
READ MORE
MEMBERS ONLY

IWM hits pre-Lehman consolidation
by Arthur Hill,
Chief Technical Strategist, TrendInvestorPro.com
With the massive rally over the last 13 months, the Russell 2000 ETF (IWM) hit levels note seen since Lehman brothers dominated the news. IWM was trading in the 63-75 range just before the Lehman bankruptcy and is nearing 70. This area could mark resistance.
Click this image for...
READ MORE
MEMBERS ONLY

STRONG JOBS REPORT BOOSTS STOCKS AND COMMODITIES -- BUT TREASURY BONDS TUMBLE AS YIELDS SURGE --COMMODITY ETF TURNS UP -- GOLD AND ENERGY SHARES ARE BREAKING OUT -- PLATINUM LEADS PRECIOUS METALS HIGHER -- EMERGING MARKET ETF HITS NEW 2010 HIGH
by John Murphy,
Chief Technical Analyst, StockCharts.com
BOND YIELDS SURGE ON STRONG JOBS REPORT... There's good and bad news in Friday's strong jobs report. The bad news is that bond yields are surging. Chart 1 shows the 10-Year Treasury Note Yield (TNX surging to the highest level since last June and heading...
READ MORE
MEMBERS ONLY
THE ROAD AHEAD - OUR TRANSITION TOWARDS "THE INSPECTOR"
Hello Fellow ChartWatchers!
Is the two-month old rally coming to a end now that April has arrived? The Dow's PPO is tantalizingly close to a bearish crossover right now. Arthur Hill sees weakness in the S&P 500 while Tom Bowley still sees opportunities. Read their...
READ MORE
