MEMBERS ONLY
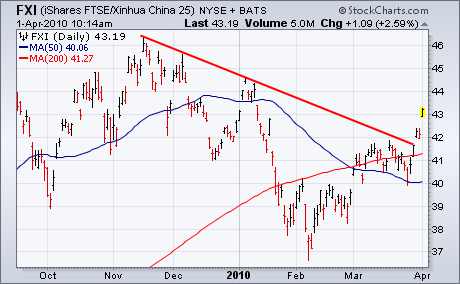
JUMP IN CHINESE SHARES BOOSTS COMMODITIES

by John Murphy,
Chief Technical Analyst, StockCharts.com
Stocks and commodity markets rallied on Thursday on news of an expansion in manufacturing in China, which is the world's biggest user of commodities. A few weeks back I wrote that weakness in Chinese shares was one of the factors weighing on commodity markets (along with a stronger...
READ MORE
MEMBERS ONLY
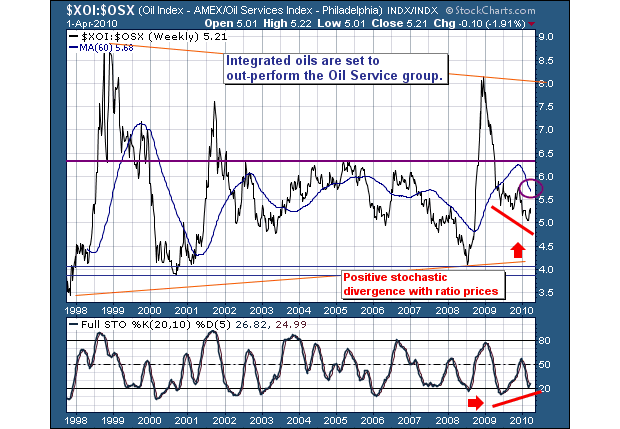
LOOKING INTO OIL SERVICES

by Richard Rhodes,
Founder and President, Rhodes Capital Management and Rhodes Trading Group
The market rally higher has taken quite a few stock groups along for the ride - most notably the Consumer Discretionary and Industrial sectors. However, we've begun to see some very small rotations out of this group, and into the Energy group. This interests us greatly, for Crude Oil...
READ MORE
MEMBERS ONLY
INDUSTRIALS LEADING THE CHARGE

by Tom Bowley,
Chief Market Strategist, EarningsBeats.com
If you're looking for sector leadership in 2010, look no further than the industrials. While other sectors have performed admirably, especially financials and consumer discretionary, none top the 13.13% year-to-date gain that industrials are sporting. Compare that return to the paltry 0.57% gain in...
READ MORE
MEMBERS ONLY
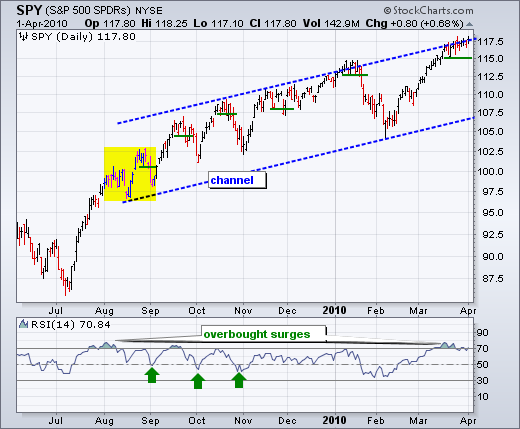
SPY stalls at channel trendline

by Arthur Hill,
Chief Technical Strategist, TrendInvestorPro.com
The S&P 500 ETF (SPY) and Nasdaq 100 ETF (QQQQ) are trading near the upper trendline of a rising price channel that extends back to August. I drew the lower trendlines first, created a second parallel trendline and then moved it up to match the reaction highs. After...
READ MORE
MEMBERS ONLY
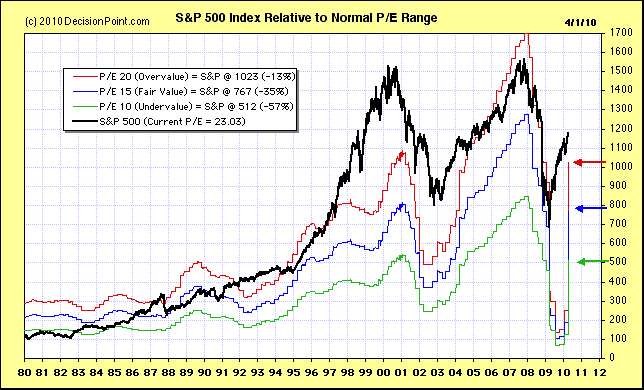
MORE NORMAL EARNINGS PICTURE

by Carl Swenlin,
President and Founder, DecisionPoint.com
S&P has still not finalized 2009 Q4 earnings, but 99% of companies have reported, and I want to get the most current earnings picture out there, so I have updated our database to TMT earnings as of Q4 2009. This causes the horrible Q4 2008 numbers to drop...
READ MORE
MEMBERS ONLY

Falling Dollar boosts Gold and Oil $GLD
by Arthur Hill,
Chief Technical Strategist, TrendInvestorPro.com
Weakness in the Dollar over the last few days spurred buying in gold and oil. The chart below shows the Gold ETF (GLD), US Oil Fund ETF (USO) and DB Dollar Bullish ETF (UUP) over the last seven days. Gold took off first with a move on March 26th. Oil...
READ MORE
MEMBERS ONLY
Gone fishing
by Arthur Hill,
Chief Technical Strategist, TrendInvestorPro.com
I will be on vacation the first two weeks of April. The next posting to Art's Charts will be on Monday, April 19th. See you then - refreshed and rejuvenated!...
READ MORE
MEMBERS ONLY

GROWTH IN CHINA -- AND HIGHER CHINESE STOCKS -- BOOSTS STOCKS AND COMMODITIES -- ENERGY AND PRECIOUS METALS ARE TURNING UP ALONG WITH THEIR SHARES -- SILVER IS LEADING GOLD HIGHER -- NYSE COMPOSITE AND SOX HIT NEW 2010 HIGHS
by John Murphy,
Chief Technical Analyst, StockCharts.com
JUMP IN CHINESE SHARES BOOSTS COMMODITIES ... Stocks and commodity markets are rallying today on news of an expansion in manufacturing in China, which is the world's biggest user of commodities. A few weeks back I wrote that weakness in Chinese shares was one of the factors weighing on...
READ MORE
MEMBERS ONLY
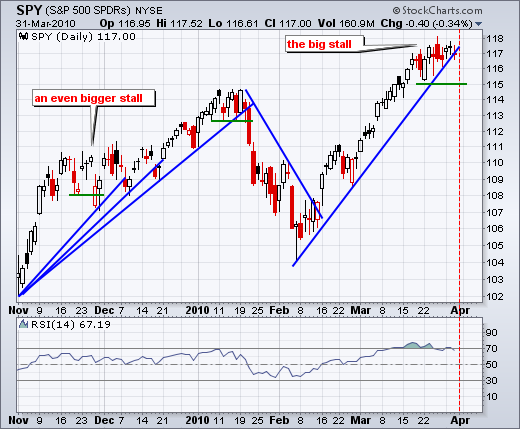
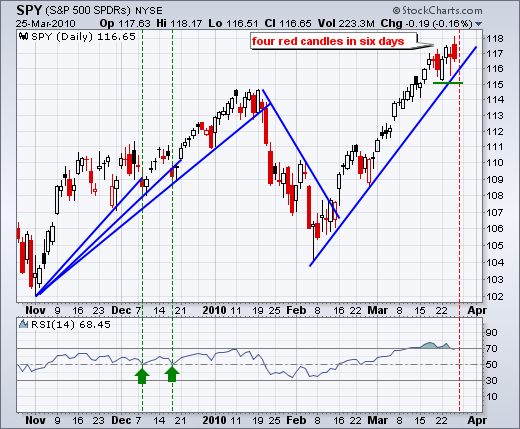
SPY forms third indecisive candlestick
by Arthur Hill,
Chief Technical Strategist, TrendInvestorPro.com
SPY hit 117 eleven days ago and then stalled the last 10 days. Daily ranges were relatively wide from March 19th until March 26th (six days). The daily range narrowed this week with three indecisive candlesticks. This is hardly surprising considering the four day trading week, the Good Friday employment...
READ MORE
MEMBERS ONLY

Juniper slows to a crawl
by Arthur Hill,
Chief Technical Strategist, TrendInvestorPro.com
After surging above 30 in early March, Juniper slowed to a crawl the last six days. Notice that Bollinger Bands (10,2) are contracting and the Standard Deviation is at its lowest point since early February, which is when the surge started.
Click this image for details...
READ MORE
MEMBERS ONLY

DOLLAR PULLS BACK WITHIN RISING CHANNEL - OIL AND GASOLINE CHALLENGE RESISTANCE - GOLD CHALLENGES FLAG/CHANNEL RESISTANCE - GOLD HOLDING UP BETTER THAN THE EURO - PLATINUM, SILVER AND COPPER MAINTAIN UPTRENDS
by John Murphy,
Chief Technical Analyst, StockCharts.com
DOLLAR PULLS BACK WITHIN RISING CHANNEL... Link for todays video. Wednesday is turning into a redux of Monday. The Euro advanced, the Dollar fell, oil bounced and commodities moved higher. Lets start with the Euro and the Dollar. Chart 1 shows the Euro ETF (FXE) within a clear downtrend defined...
READ MORE
MEMBERS ONLY

SPY continues to stall
by Arthur Hill,
Chief Technical Strategist, TrendInvestorPro.com
Yesterday I showed a rising price channel extending from August and SPY was consolidating near the upper trendline. No change on that front as SPY continued its stall with another relatively narrow range day. Monday's high-low range was the narrowest in seven days (NR7). This is the...
READ MORE
MEMBERS ONLY

New highs still outpacing new lows $BA
by Arthur Hill,
Chief Technical Strategist, TrendInvestorPro.com
A look at the predefined scans page shows new 52-week highs outpacing new 52-week lows by a wide margin. In fact, new lows are quite minimal, which is hardly surprising considering the current rally is some 55 weeks old. The Aerospace group is well represented with Boeing (BA)...
READ MORE
MEMBERS ONLY

APPLYING PERCENTAGE BOX SIZES TO POINT & FIGURE CHARTS ON THE DOLLAR, COMMMODITIES, AND BOND ETFS
by John Murphy,
Chief Technical Analyst, StockCharts.com
USING PERCENT P&F BOX SIZE ... My recent point & figure articles have been limited to stock indexes and traditional box sizes. Some readers have asked about the use of "percentage" box sizes. I find percentage box sizes very helpful, especially when looking at financial markets other...
READ MORE
MEMBERS ONLY

SPY hits channel trendline
by Arthur Hill,
Chief Technical Strategist, TrendInvestorPro.com
I will start with the chart shown in yesterday's Market Message. There is no new price action so the analysis has not changed. SPY hit the upper trendline of a rising price channel and stalled over the last two weeks. Stalling is not the same as weakness though....
READ MORE
MEMBERS ONLY
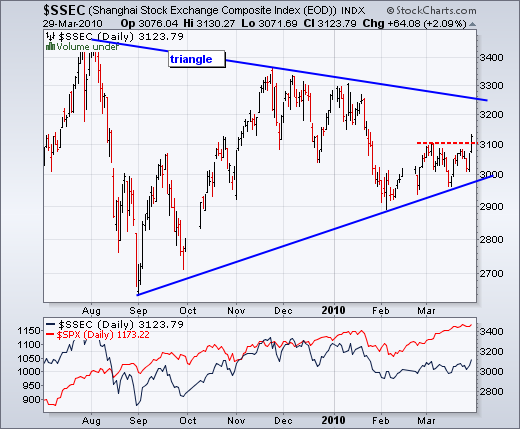
Shanghai Composite breaks resistance
by Arthur Hill,
Chief Technical Strategist, TrendInvestorPro.com
It's been a long time coming, but the Shanghai Composite ($SSEC) finally broke above 3100 resistance. The index has been lagging the S&P 500 the last six weeks as it traded flat. Today's break above 3100 takes the index to its highest level since...
READ MORE
MEMBERS ONLY

SPY STALLS AT CHANNEL TRENDLINE - EURO GETS OVERSOLD BOUNCE - STRENGTH IN CHINA LIFTS CRUDE - ENERGY SECTOR RECOVERS AFTER SUPPORT BREAK - GOLD STALLS AFTER BIG SURGE
by John Murphy,
Chief Technical Analyst, StockCharts.com
SPY STALLS AT CHANNEL TRENDLINE ... Link for todays video. The S&P 500 ETF (SPY) and Nasdaq 100 ETF (QQQQ) are trading near the upper trendline of a rising price channel that extends back to August. I drew the lower trendline first, created a second parallel trendline and then...
READ MORE
MEMBERS ONLY
Uptrend continues as bullish sentiment increases
by Arthur Hill,
Chief Technical Strategist, TrendInvestorPro.com
There is really no change on the daily chart. SPY remains in a medium-term uptrend with a higher low in February and higher high in March. The ETF is also in a short-term uptrend with a sharp advance from the February low. Since moving above 116 eight days...
READ MORE
MEMBERS ONLY

MARKET ADVANCE EXCEEDS 52 WEEKS - NET NEW HIGHS EXPAND IN MARCH - EARLY SIGNS OF RELATIVE WEAKNESS IN SMALLCAPS - IWM STALLS AS MACD ROLLS OVER - NASDAQ NET ADVANCES HIT HARD THIS WEEK - NYSE AD VOLUME LINE FORMS SMALL NEGATIVE DIVERGENCE
by John Murphy,
Chief Technical Analyst, StockCharts.com
MARKET ADVANCE EXCEEDS 52 WEEKS ... Link for todays video. Net New Highs on the NYSE and Nasdaq were exceptionally strong this month. This is hardly surprising considering that the current advance turned 1 year old in March. Perfchart 1 shows performance for the major indices since early March 2009. These...
READ MORE
MEMBERS ONLY
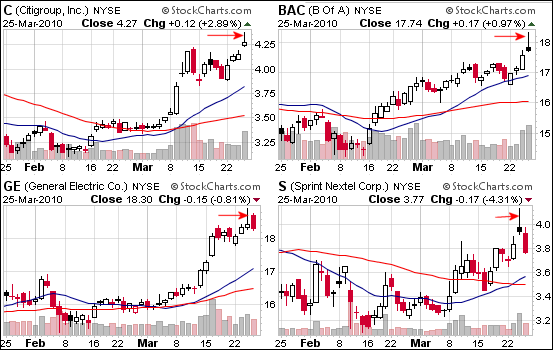
Shooting stars popping up
by Arthur Hill,
Chief Technical Strategist, TrendInvestorPro.com
Shooting star candlesticks are popping up after a couple of volatile days. A CandleGlance view of Thursday's most active list shows shooting stars in the four most active stocks. GE and S formed shooting stars on Wednesday. C and BAC formed shooting stars on Thursday. Click here for...
READ MORE
MEMBERS ONLY

Medium-Term Evidence Remains Bullish
by Arthur Hill,
Chief Technical Strategist, TrendInvestorPro.com
There is no change in the Stock Market Summary this week. All indicators are in bull mode, but there were some signs of less strength this week. The NYSE AD Volume Line did not exceed last week's high. Nasdaq Net Advances dipped to their lowest (negative) level since...
READ MORE
MEMBERS ONLY
SPY gives up early gains
by Arthur Hill,
Chief Technical Strategist, TrendInvestorPro.com
Trading is turning rather volatile, which is just one more sign that a pullback or corrective period may begin soon. SPY first crossed above 116.5 seven days ago. Since this first cross, the ETF has dipped to around 115 and surged above 118. Yesterday's close at 116....
READ MORE
MEMBERS ONLY

USE 45 DEGREE TRENDLINES TO FILTER P&F SIGNALS -- USING FIVE-BOX REVERSALS AS ADDITIONAL FILTER -- THE S&P 500 CONTINUES FIFTH WAVE ADVANCE WITH NO SIGN OF TOP -- NEXT POTENTIAL TARGET IS 1250 TO 1300 ZONE
by John Murphy,
Chief Technical Analyst, StockCharts.com
USING TRENDLINES AS FILTERS... I received so much feedback on my Tuesday point & figure message that I'd like to use this article to answer some of the questions and elaborate on the technique even further. My Tuesday message showed two versions of the Consumer Discretionary SPDR (using...
READ MORE
MEMBERS ONLY
SPY stalls within uptrend
by Arthur Hill,
Chief Technical Strategist, TrendInvestorPro.com
As with the end of February, SPY is currently stalling within an uptrend. The ETF moved above 116 six days ago and has traded on either side of 116.5 the last six days. The pink ovals show periods with a red candlestick, recovery candlestick and a subsequent gain. The...
READ MORE
MEMBERS ONLY

Staples breaks flag trendline
by Arthur Hill,
Chief Technical Strategist, TrendInvestorPro.com
After a sharp decline with a gap in early March, Staples (SPLS) retraced 50-62% with a rising flag over the last 2-3 weeks. The stock broke the lower flag trendline with a sharp decline on Wednesday, but firmed at support around 23.5 on Thursday.
Click this image...
READ MORE
MEMBERS ONLY

Techs, healthcare and utilities lead lower
by Arthur Hill,
Chief Technical Strategist, TrendInvestorPro.com
The Market Carpet shows the technology, healthcare and utilities sectors leading the market lower on Wednesday. The average decline for stocks in these sectors was 1.13%, 1.01% and .96%, respectively. Only financials were up with the average advance per stock running .13%.
Click this image for details...
READ MORE
MEMBERS ONLY

DIA FORMS INSIDE DAY AT CHANNEL RESISTANCE - BONDS FALL SHARPLY ON RECORD TREASURY AUCTION - EURO EXTENDS DOWNTREND WITH SHARP DECLINE - DOLLAR ETF SURGES TO EIGHT MONTH HIGH - SURGING DOLLAR PUSHES GOLD BELOW 1100
by John Murphy,
Chief Technical Analyst, StockCharts.com
A STRANGE DAY INDEED... Link for todays video. Before getting to todays gap, I would like to start with an overview and observation. Stocks started the day weak and remained weak throughout the day. Eight of the nine sectors were down with healthcare and utilities leading the way lower. These...
READ MORE
MEMBERS ONLY

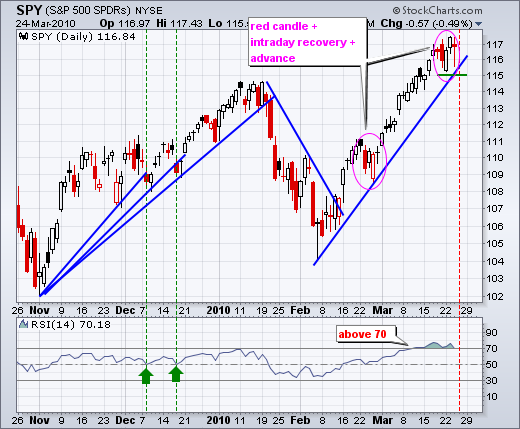
A new high for SPY
by Arthur Hill,
Chief Technical Strategist, TrendInvestorPro.com
There it is again. After one long red candlestick, SPY opened weak and closed strong. This intraday reversal was followed by further gains on Tuesday as the ETF moved above 117 for the first time since September 2008, which was when Lehman declared bankruptcy. The pink circle shows the prior...
READ MORE
MEMBERS ONLY

Industry leaders since early February
by Arthur Hill,
Chief Technical Strategist, TrendInvestorPro.com
The John Murphy industry group PerfChart shows banks, biotechs, retail and semis leading the market higher since early February. Oil services and pharmaceuticals are lagging the S&P 500.
Click this image for details...
READ MORE
MEMBERS ONLY

HOW TO SENSITIVE P&F CHARTS TO SUIT DIFFERENT TIME DIMENSIONS -- USER BIGGER BOX SIZES FOR MAJOR TRENDS AND SMALLER BOXES FOR SHORT-TERM TRADING SIGNALS
by John Murphy,
Chief Technical Analyst, StockCharts.com
CHANGE BOX SIZE TO VARY SENSITIVITY ... One of the things I like most about point & figure charts is the clarity and simplicity of their buy and sell signals. And you can adjust the charts to suit the time frame you're trading. Less sensitive charts lend themselves to...
READ MORE
MEMBERS ONLY

Bulls refuse to relent
by Arthur Hill,
Chief Technical Strategist, TrendInvestorPro.com
Even after a high-volume bearish engulfing on quadruple witching Friday and weak open on Monday, the bulls refused to give up the trend and pushed stocks higher immediately after the open. One day does not a trend change make. Selling pressure has been very limited since the early February...
READ MORE
MEMBERS ONLY
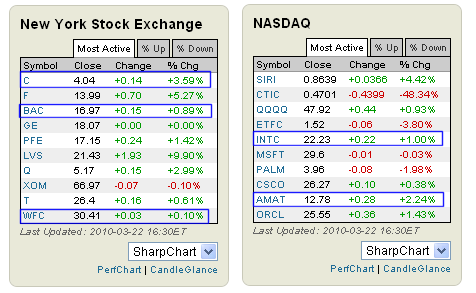
Banks and Semis Shine
by Arthur Hill,
Chief Technical Strategist, TrendInvestorPro.com
From the Free Charts page, the most active list for the NYSE shows strength in three banks (C, BAC, WFC). The most active Nasdaq list shows strength in two semis (INTC, AMAT). The CandleGlance link at the bottom of these tables shows all 10 with small candlestick charts.
Click this...
READ MORE
MEMBERS ONLY

QQQQ SHRUGS OFF BEARISH ENGULFING - SEMIS LEAD TECHS - AMAT BREAKS TRIANGLE RESISTANCE - LRCX SURGES ON GOOD VOLUME - XLY HITS CHANNEL RESISTANCE - RETAIL ETF CONTINUES TO LEAD - VIX HITS COMPLACENCY LOW FROM MAY 2008
by John Murphy,
Chief Technical Analyst, StockCharts.com
QQQQ SHRUGS OFF BEARISH ENGULFING PATTERN ... Link for todays video. Many of the major index ETFs formed bearish engulfing patterns on Friday, but these were not confirmed with further weakness on Monday. A bearish engulfing pattern forms when the open is above the prior close and the close is below...
READ MORE
MEMBERS ONLY

High volume and overbought conditions
by Arthur Hill,
Chief Technical Strategist, TrendInvestorPro.com
Stocks fell on Friday with the highest volume since early February, which was the scene of the last reversal. High volume sometimes marks a turning point. Stockcharts.com provides volume figures for the S&P 500, Dow Industrials, Nasdaq 100, Nasdaq and NYSE. The first three are the most...
READ MORE
MEMBERS ONLY
SIX THINGS ABOUT STOCKCHARTS.COM THAT YOU NEED TO KNOW
Hello Fellow ChartWatchers!
The markets continue to rise impressively with the Dow closing higher for 13 of the last 16 days. Arthur, John and the rest of the ChartWatchers team discuss that in more detail in just a bit. I wanted to take some time to talk about six very...
READ MORE
MEMBERS ONLY
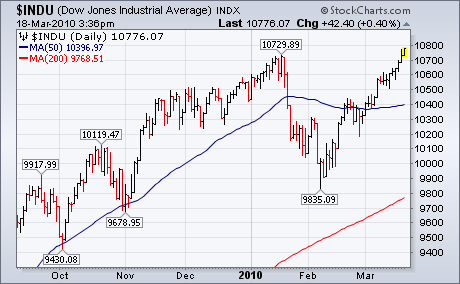
DOW THEORY UPTREND IS CONFIRMED
by John Murphy,
Chief Technical Analyst, StockCharts.com
Dow Theory holds that the Dow Transports and Industrials must both hit new highs to confirm an ongoing bull market. The ability of the Dow Industrials to exceed their January high has done just that. That doesn't tell us how far the bull market will run, or for...
READ MORE
MEMBERS ONLY
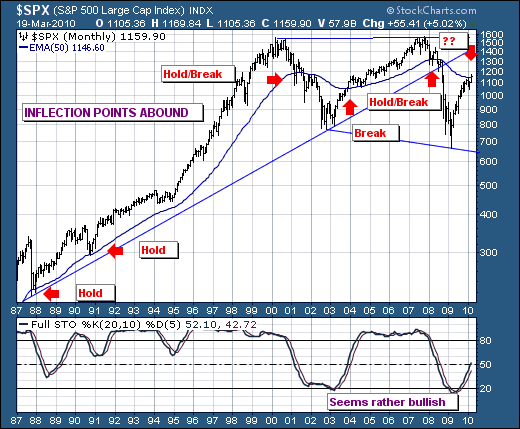
IS THE S&P ON SOUND-FOOTING, OR NOT?
by Richard Rhodes,
Founder and President, Rhodes Capital Management and Rhodes Trading Group
The recent S&P rally to new reactionary highs has shown to be on rather slim-footing given that volume patterns are rather tepid. We don't disagree in the least, but the fact of the matter is that the advance/decline figures have been rather "good&...
READ MORE
MEMBERS ONLY
THE POWER OF THE REVERSING CANDLE
by Tom Bowley,
Chief Market Strategist, EarningsBeats.com
Candlesticks and candlestick patterns are the foundation to trading in my view. I use them on every charting timeframe, whether it's a one minute, hourly, daily, weekly or monthly chart. If you're a daytrader or swing trader, trading without the knowledge of reversing candlesticks is doing...
READ MORE
MEMBERS ONLY
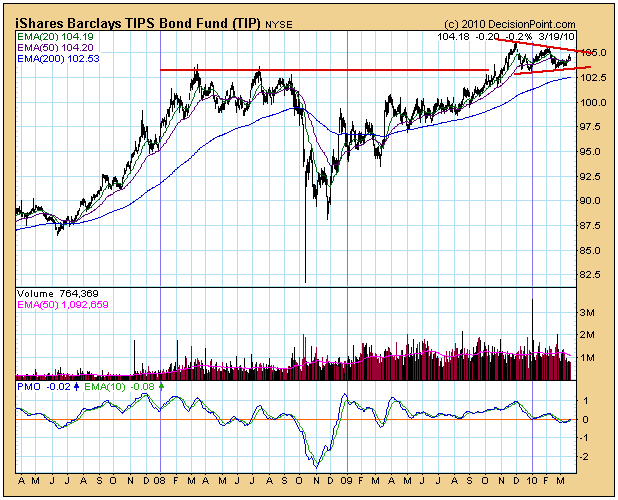
A TIP ON TIPS
by Carl Swenlin,
President and Founder, DecisionPoint.com
TIPS are bonds that provide inflation protection. While Erin covered this subject in yesterday's blog, I wanted to cover it with a little more depth and from a somewhat different perspective. Our default "first look" charts are usually set for one year, but I personally like...
READ MORE
MEMBERS ONLY
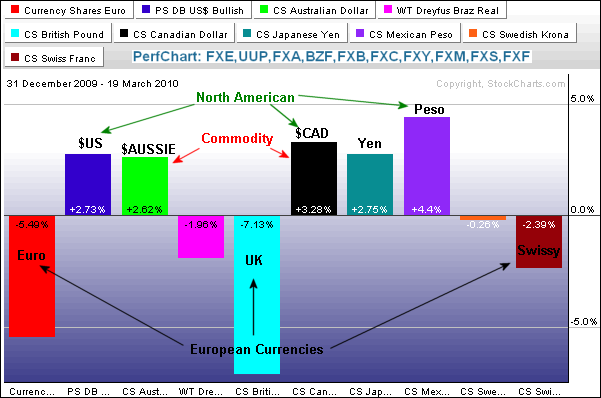
North American Currencies show strength in 2010
by Arthur Hill,
Chief Technical Strategist, TrendInvestorPro.com
The Perfchart below shows the performance trends for 10 currency ETFs in 2010. The North American and commodity currencies are strong, while the European currencies are weak. First, notice that the DB Dollar Bullish ETF (UUP), Mexican Peso ETF (FXM) and the Canadian Dollar ETF (FXC) are up. Strength in...
READ MORE
