MEMBERS ONLY
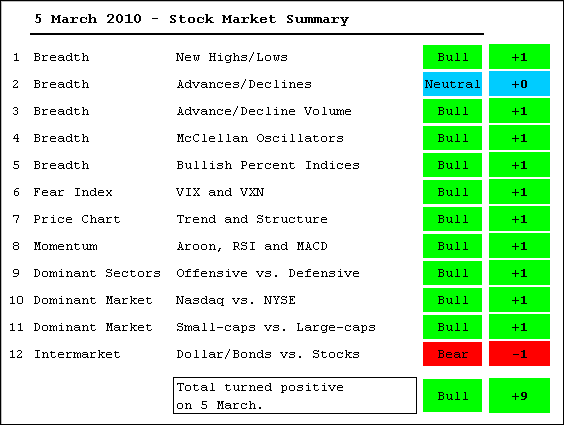
MT Evidence shifts back to the bulls

by Arthur Hill,
Chief Technical Strategist, TrendInvestorPro.com
With further strength this week, the market summary table moved from -2 to +9. The only negative indications come from the Nasdaq AD Line and strength in the Dollar. In addition, relative weakness in the large-cap indices (SPY and DIA) is a concern. The rally over the last four...
READ MORE
MEMBERS ONLY
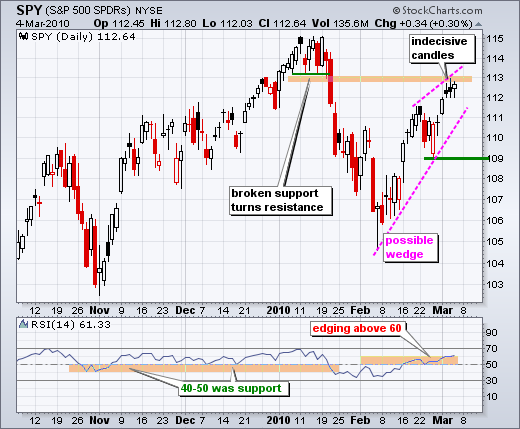
SPY stalls in an uptrend
by Arthur Hill,
Chief Technical Strategist, TrendInvestorPro.com
The S&P 500 ETF (SPY) stalled for the third day running as the ETF formed its third indecisive candlestick in a row. While this indecision can sometimes foreshadow a reversal, stalling is not the same as weakness. At this point, it is just a rest within the advance,...
READ MORE
MEMBERS ONLY

WEEKLY EMA LINES ARE STILL POSITIVE -- DAILIES TURN POSITIVE -- STRENGTH IN RETAIL STOCKS IS A POSITIVE SIGN FOR THE MARKET -- RETAIL BREAKOUTS ARE OCCURRING IN BIG LOTS, FAMILY DOLLAR STORES, AND TARGET -- AVOID INVERSE ETFS WHILE MARKET IS RISING

by John Murphy,
Chief Technical Analyst, StockCharts.com
WEEKLY EMA COMBINATION IS STILL UP ... Several recent messages have dealt with the use of "daily" exponentially smoothed average (EMA) crossovers (in particular the 13-34 day EMA combination ) to generate buy and sell signals . One reader suggested that I take a longer-range view of things. Another...
READ MORE
MEMBERS ONLY

AA and AXP lagging within the Dow
by Arthur Hill,
Chief Technical Strategist, TrendInvestorPro.com
A look at the CandleGlance page for the Dow stocks shows Alcoa (AA) and American Express (AXP) lagging in February. The Dow and S&P 500 were up sharply in February, but these two stocks simply consolidated and shows relative weakness. Click this image to see all Dow stocks....
READ MORE
MEMBERS ONLY
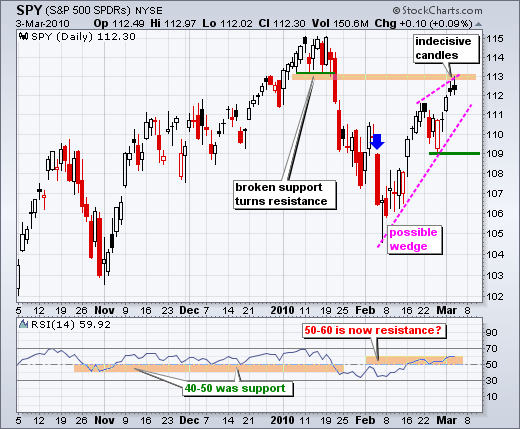
SPY extends its stall + stock charts
by Arthur Hill,
Chief Technical Strategist, TrendInvestorPro.com
For the second day running, the S&P 500 ETF (SPY) stalled with an indecisive candlestick. Notice the small body (open-close) and the modest upper-lower shadows (intraday high-low). These candlesticks show a stalemate between buyers and sellers. DIA and QQQQ formed similar candlesticks. Even though IWM...
READ MORE
MEMBERS ONLY

DOW LAGS SMALL-CAPS AND MID-CAPS - SURGING EURO WEIGHS ON THE GREENBACK - FALLING DOLLAR BOOSTS MATERIALS SECTOR - STEEL ETF FORMS GRAVESTONE DOJI - YIELDS HIT SUPPORT AS BONDS HIT RESISTANCE
by John Murphy,
Chief Technical Analyst, StockCharts.com
DOW SPDR LAGS OTHER INDICES... Link for todays video. It is a tale of two markets. Small-caps and mid-caps show relative strength, but large-caps show relative weakness. Chart 1 shows the Russell 2000 ETF (IWM) hitting a new 52-week high intraday on Wednesday. IWM exceeded the...
READ MORE
MEMBERS ONLY
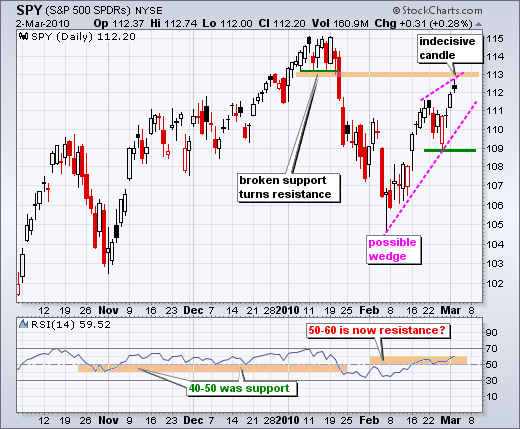
SPY stalls with indecisive candlestick
by Arthur Hill,
Chief Technical Strategist, TrendInvestorPro.com
Technically, there is a case for a medium-term uptrend. SPY recorded a 52-week high in January and the February reaction low is above the early November reaction low. Also, consider that the Russell 2000 ETF (IWM) and S&P 400 MidCap ETF (MDY) are already back near...
READ MORE
MEMBERS ONLY

STOCK INDEXES EXCEED 50-DAY LINES -- THAT IMPROVES THE MARKET'S SHORT-TERM TREND -- SO DOES THE NYSE ADVANCE-DECLINE LINE HITTING A RECORD HIGH -- NEWMONT MINING LEADS GOLD MINERS HIGHER AS GOLD RALLIES
by John Murphy,
Chief Technical Analyst, StockCharts.com
50 DAY AVERAGES ARE EXCEEDED ... The ability of major U.S. stock indexes to rally back above their 50-day moving averages has improved the market's short-term trend picture. Chart 1 shows the S&P 500 closing above its 50-day average for two consecutive days...
READ MORE
MEMBERS ONLY
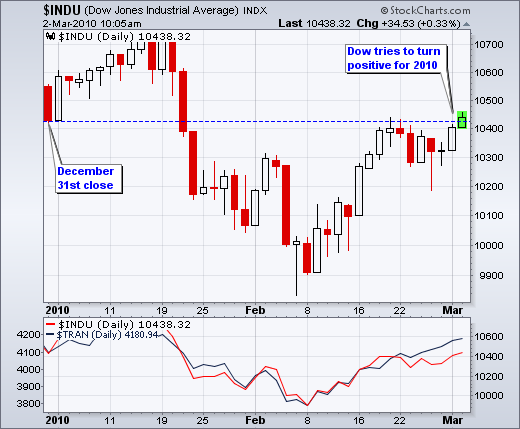
Dow tries to go positive for 2010
by Arthur Hill,
Chief Technical Strategist, TrendInvestorPro.com
The Dow Industrials is attempting to turn positive for 2010. The senior Average closed at 10,428 on December 31st and flirted with the 10428 area 7-8 days ago. After falling back below 10300 last week, the Dow is making another go at positive ground.
Click this image for...
READ MORE
MEMBERS ONLY

SPY follows through on reversal day
by Arthur Hill,
Chief Technical Strategist, TrendInvestorPro.com
Stocks moved higher on Monday with broad participation. All of the major indices were up 1% or more. All sectors were up with the Consumer Discretionary SPDR (XLY) leading the way. The Financials SPDR (XLF), however, was clearly the weakest link with a fractional gain (+.27%). This could develop into...
READ MORE
MEMBERS ONLY

SMALL-CAPS AND TECHS LEAD FEBRUARY BOUNCE - IWM OUTPERFORMS SPY ON THE CHART - S&P 500 EQUAL WEIGHT OUTPERFORMS - CONSUMER DISCRETIONARY AND STAPLES LEADING - KEY LEVELS FOR XLY AND XLF
by John Murphy,
Chief Technical Analyst, StockCharts.com
SMALL-CAPS AND TECHS LEAD THE BOUNCE... Link for todays video. Small-caps and tech stocks are showing relative strength over the last few weeks. There are many ways to measure relative strength or relative weakness. Comparing percentage gains is perhaps the easiest and most straight forward. Perfchart 1 shows...
READ MORE
MEMBERS ONLY
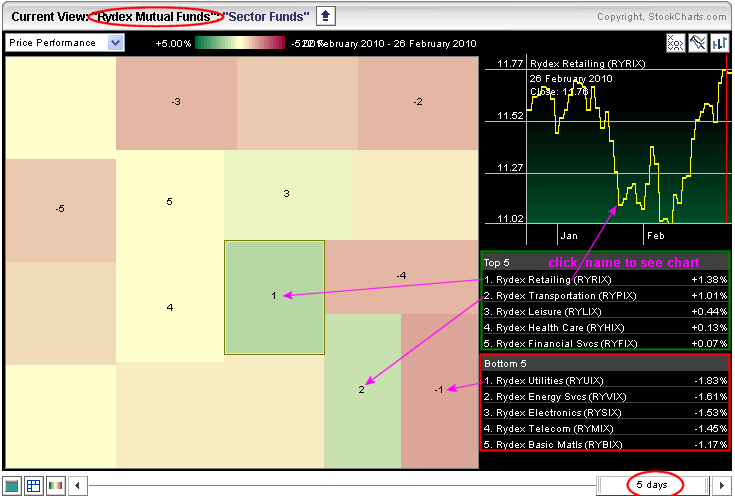
Retail leads Rydex Funds
by Arthur Hill,
Chief Technical Strategist, TrendInvestorPro.com
The Market Carpet for the Rydex Sector Funds shows the Rydex Retailing Fund (RYRIX) leading the way higher last week. Notice that the slider at the bottom is set at 5 days to show last week's results. The Rydex Transportation Fund (RYPIX) came in second with a 1....
READ MORE
MEMBERS ONLY
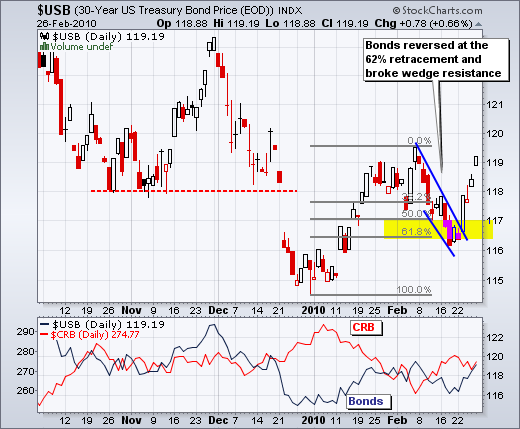
Intermarket charts updated
by Arthur Hill,
Chief Technical Strategist, TrendInvestorPro.com
All daily and weekly intermarket charts have been updated ( click here). Below for four charts featuring some highlights from last week.
Bonds had a big week as the 30-year Treasury Bond ($USB) surged over 2%.
The US Dollar Index ($USD) is overbought, but refuses to give up gains.
West...
READ MORE
MEMBERS ONLY

SPY edges above flag resistance
by Arthur Hill,
Chief Technical Strategist, TrendInvestorPro.com
On the daily chart, SPY surged to resistance around 111 and then consolidated the last few days. The ETF appeared headed down after a sharp decline on Tuesday and weak open on Thursday, but recovered on Thursday afternoon and closed strong. This long-red-hollow candlestick represents a reversal day....
READ MORE
MEMBERS ONLY
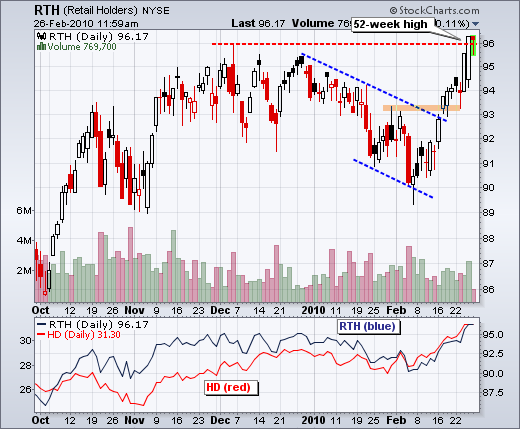
Home Depot powers Retail HOLDRS
by Arthur Hill,
Chief Technical Strategist, TrendInvestorPro.com
The Retail HOLDRS (RTH) recorded a 52-week high with help from Home Depot (HD). RTH broke above channel resistance in mid February and above its December highs this week. The indicator window shows both RTH and HD. Notice how HD also moved above its December high.
Click this chart...
READ MORE
MEMBERS ONLY

EURO DECLINE SLOWS - PICKING THE RIGHT RETRACEMENT - GOLD AND THE EURO STILL POSITIVELY CORRELATED - GOLD BATTLES WEDGE TRENDLINE - OIL, STOCKS AND THE DOLLAR - OIL REMAINS STUCK IN A RUT
by John Murphy,
Chief Technical Analyst, StockCharts.com
EURO DECLINE SLOWS... Link for todays video. The decline in the Euro is slowing over the last few weeks, but we have yet to see a bounce last more than two days since late December. Chart 1 shows weekly candlesticks for the Euro ETF (FXE) Should the ETF close down...
READ MORE
MEMBERS ONLY
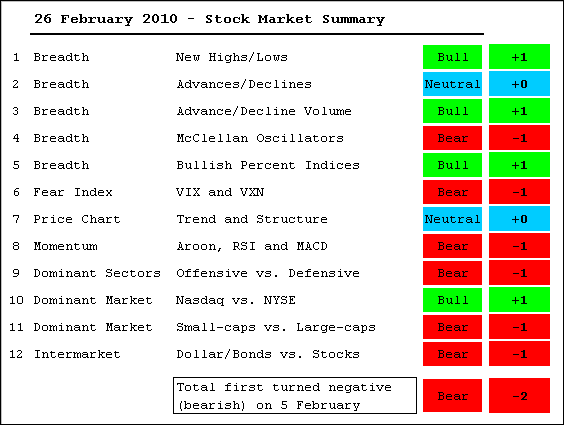
Medium-Term evidence remains slightly bearish
by Arthur Hill,
Chief Technical Strategist, TrendInvestorPro.com
It remains a tricky period for the stock market. Overall, the market summary table comes in at -2, which is slightly bearish. There are, however, a few indicators that could go either way. The McClellan Oscillators both surged above +50 in mid February, but only for a day and I...
READ MORE
MEMBERS ONLY

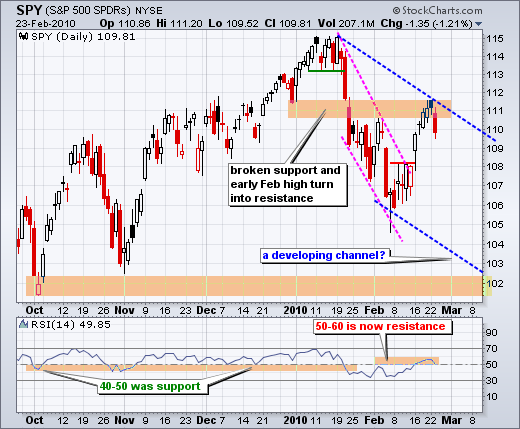
Falling flag taking shape in SPY
by Arthur Hill,
Chief Technical Strategist, TrendInvestorPro.com
Before looking at the falling flag on the 60-minute chart, let's review some candlestick action on the daily chart. There is no change in the overall analysis as SPY appears to be developing a falling price channel. A break above 111.10 would throw cold water on...
READ MORE
MEMBERS ONLY
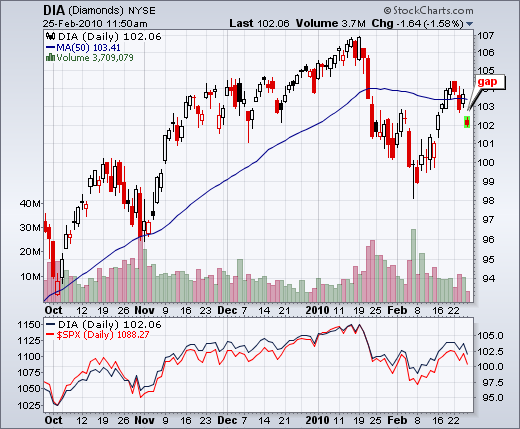
Dow Diamonds gaps down
by Arthur Hill,
Chief Technical Strategist, TrendInvestorPro.com
After battling its 50-day moving average the prior five days, the Dow Diamonds (DIA) gapped down in early trading on Thursday. This gap reinforces resistance around the 50-day and is considered short-term bearish as long as it remains unfilled.
Click this chart for details....
READ MORE
MEMBERS ONLY

MORE WAYS TO USE MOVING AVERAGES -- 20-50 AND 13-34 EMA COMBINATIONS ARE STILL NEGATIVE -- SIMPLIFY MOVING AVERAGE SIGNALS -- YEN RALLIES IN FLIGHT TO SAFETY AS GLOBAL STOCKS SELLOFF
by John Murphy,
Chief Technical Analyst, StockCharts.com
MORE SENSITIVE EMA CROSSINGS ... I got such an overwhelming response on Tuesday's message on using exponentially smoothed moving averages (EMAs) in conjunction with simple averages that I'd like to expand even further on the subject. One reader asked if shorter-term EMAs could be employed in...
READ MORE
MEMBERS ONLY
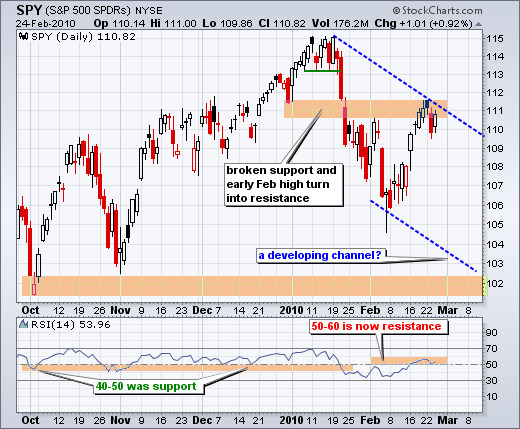
SPY and charts of interest
by Arthur Hill,
Chief Technical Strategist, TrendInvestorPro.com
There is not much change on the daily chart. SPY hit resistance in the 111 area over the last few days. This resistance zone stems from broken support and the early February high. It also marks a 62% retracement of the January-February decline. Should a lower high form, I...
READ MORE
MEMBERS ONLY

Raff Regression Channel for the Euro ETF
by Arthur Hill,
Chief Technical Strategist, TrendInvestorPro.com
Since peaking in late November, bounces in the Euro ETF (FXE) have been limited to three days. In fact, except for one 3-day bounce in late December, bounces have actually been 1-2 days. The Raff Regression Channel with extensions defines the current downtrend. A break above the upper...
READ MORE
MEMBERS ONLY

CONSUMER DISCRETIONARY SPDR CHALLENGES RESISTANCE - A BEAR TRAP OR OVERSOLD BOUNCE? - WATCHING THE VOLATILITY INDICES - ACCUMULATION DISTRIBUTION LINE VERSUS ON BALANCE VOLUME
by John Murphy,
Chief Technical Analyst, StockCharts.com
CONSUMER DISCRETIONARY SPDR CHALLENGES RESISTANCE... Link for todays video. While the S&P 500 and the Dow remain well below their January highs, the Consumer Discretionary SPDR (XLY) is challenging its January highs after a sharp advance the last few weeks. Chart 1 shows XLY within a rising price...
READ MORE
MEMBERS ONLY
A crack in the bounce
by Arthur Hill,
Chief Technical Strategist, TrendInvestorPro.com
After yakking about SPY resistance in the 111 area and RSI resistance in the 50-60 area for at least a week, it finally came to pass. With a broad decline on Tuesday, SPY backed off the potential resistance zone to turn it into a confirmed resistance zone. All major...
READ MORE
MEMBERS ONLY
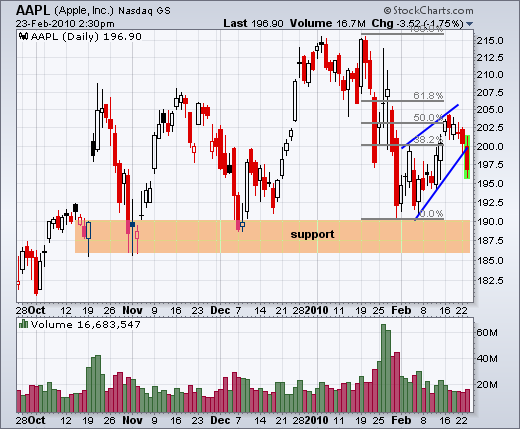
Apple breaks wedge support
by Arthur Hill,
Chief Technical Strategist, TrendInvestorPro.com
Apple (AAPL) met resistance at a key retracement zone last week and broke below the wedge trendline with a sharp decline today. Notice that Apple was turned back in the 50-62% retracement zone. With the wedge break, the next target is the support zone around 187.50.
Click this...
READ MORE
MEMBERS ONLY

A LOT OF MARKETS ARE MEETING RESISTANCE AT THEIR 50-DAY AVERAGES -- COMBINING SIMPLE AND EMA AVERAGES -- WHY 50-DAY LINES ARE LIKELY TO KEEP FALLING
by John Murphy,
Chief Technical Analyst, StockCharts.com
RALLY STALLS AT 50-DAY LINES ... Two Tuesdays ago (February 9), I wrote a message about the number of markets (domestic and foreign) that were starting to bounce off their 200-day moving averages and the likelihood for a short-term rally. The last part of that headline, however read:...
READ MORE
MEMBERS ONLY

SPY holds its gains
by Arthur Hill,
Chief Technical Strategist, TrendInvestorPro.com
Even though the advance slowed over the last few days, the S&P 500 ETF (SPY) continues to hold its gains as buying pressure exceeds selling pressure. On the daily chart, SPY is up around 5% in the last two weeks and trading in a potential resistance zone around...
READ MORE
MEMBERS ONLY

A mixed up market in 2010
by Arthur Hill,
Chief Technical Strategist, TrendInvestorPro.com
The sector SPDR perchart reflects a mix market (at best) for 2010. The S&P 500 is down around 2.46% since January 6th. Of the nine sectors, only three are up (consumer discretionary, industrials and consumer staples. The other six sectors are down with technology and materials shows...
READ MORE
MEMBERS ONLY

ELLIOTT WAVE COUNT FOR S&P 500 - REVIEWING LONG-TERM RETRACEMENTS FOR SPY AND DIA - INTERNATIONAL INDICES ALSO NEAR KEY RETRACEMENTS - XHB CHALLENGES RESISTANCE AS XLF TESTS SUPPORT
by John Murphy,
Chief Technical Analyst, StockCharts.com
ELLIOTT WAVE COUNT FOR S&P 500 ... Link for todays video. Chart 1 shows an Elliott Wave interpretation for the S&P 500 over the last three years. There are currently four waves with a potential fifth wave coming. Wave 1 extends down from October 2007 to March...
READ MORE
MEMBERS ONLY

SPY remains near resistance zone
by Arthur Hill,
Chief Technical Strategist, TrendInvestorPro.com
When marking support, resistance and reversal levels, zones are preferred to exact levels for two reasons. First, indices and ETFs are based on a basket of stocks. With more than one stock influencing price, we cannot expect support, resistance or reversal levels to be EXACT. Second, there are many buyers...
READ MORE
MEMBERS ONLY
ON DATA ACCURACY AT STOCKCHARTS.COM
Hello Fellow ChartWatchers!
Last time I talked about the great lengths that we go to here at StockCharts.com to make sure that our indicator values are calculated correctly. This time I want to talk about how we work hard to make sure that the data used in those calculations...
READ MORE
MEMBERS ONLY
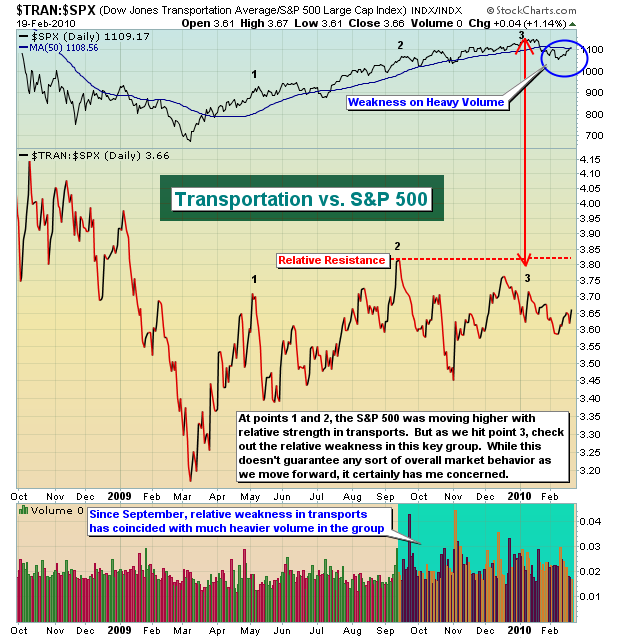
TRANSPORTATION STOCKS LAGGING - MORE TURBULENCE AHEAD?

by Tom Bowley,
Chief Market Strategist, EarningsBeats.com
History is a valuable tool in the stock market as we witness cycles repeating themselves all the time. Our major indices and the various sectors and industries rotate back and forth as our economy moves from strength to weakness and back to strength again. Certain sectors perform better during strong...
READ MORE
MEMBERS ONLY
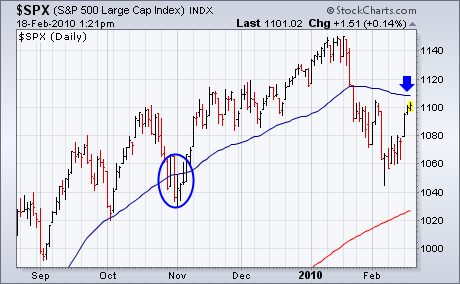
DOES FALLING 50-DAY LINE MEAN ANYTHING?
by John Murphy,
Chief Technical Analyst, StockCharts.com
One of our readers recently pointed out that the blue 50-day moving average is declining for the first time since last March, and asked if that makes it more of a resistance barrier. The short answer is probably. Although most attention is paid to "crossings" above and...
READ MORE
MEMBERS ONLY
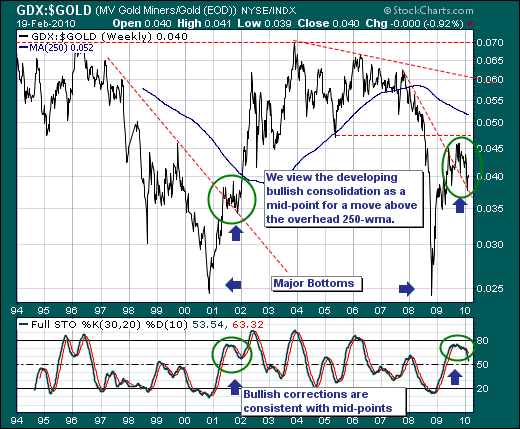
GOLD MINERS VS. GOLD FUTURES

by Richard Rhodes,
Founder and President, Rhodes Capital Management and Rhodes Trading Group
The Gold Futures ($GOLD) market has begun to capture traders' attention once again, for the developing technical patterns would suggest new highs above $1225/oz will materialize in the months ahead. Unfortunately, we haven't included a Gold Futures price here, but take our word for it: a...
READ MORE
MEMBERS ONLY
POSSIBLE BULL TRAP

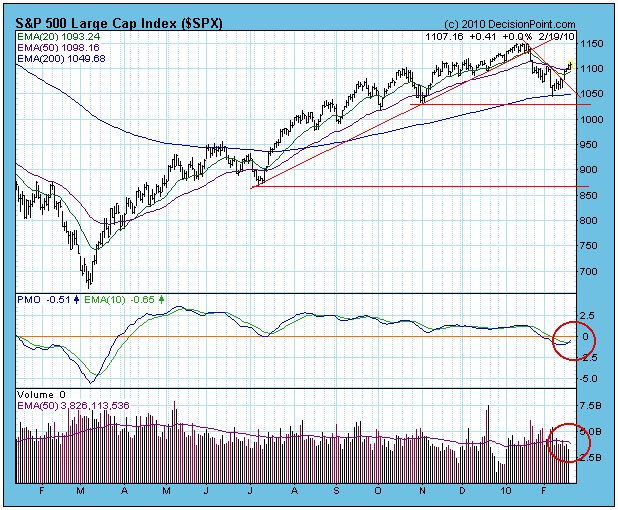
by Carl Swenlin,
President and Founder, DecisionPoint.com
Last week we were looking at a bearish reverse flag formation, but this week prices broke above a short-term declining trend line, effecting a bullish resolution of the flag and changing the short-term outlook to bullish. This was confirmed by a PMO (Price Momentum Oscillator) buy signal, generated...
READ MORE
MEMBERS ONLY
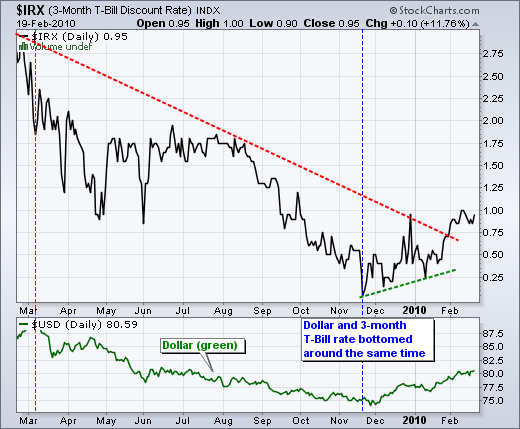
Short-term rates move ahead of Fed
by Arthur Hill,
Chief Technical Strategist, TrendInvestorPro.com
With a quarter point hike in the discount rate, the Fed surprised some in the media, but few in the bond market. As one of the most interest rate sensitive asset classes, the bond market often moves before an actual Fed move. First, the Fed has been jawboning about the...
READ MORE
MEMBERS ONLY

RETRACEMENTS REINFORCE MOVING AVERAGES - SHORT-TERM RATES MOVE AHEAD OF FED - RATES STILL LOW BY HISTORICAL STANDARDS - DOLLAR BENEFITS FROM RISING RATES - SWINGS WITHIN THE 2004 CORRECTION
by John Murphy,
Chief Technical Analyst, StockCharts.com
RETRACEMENTS REINFORCE MOVING AVERAGES... This week John Murphy featured the S&P 500 and other global indices with the falling 50-day moving averages coming into play. Key Fibonacci retracements and short-term overbought readings are also coming into play. The Fibonacci Retracements Tool shows potential reversal/resistance levels...
READ MORE
MEMBERS ONLY

Raytheon shows relative strength
by Arthur Hill,
Chief Technical Strategist, TrendInvestorPro.com
Raytheon (RTN) shows relative strength with a break above the January high. The S&P 500 and RTN are shown in the indicator window. Notice that RTN is trading above its January high, but the S&P 500 remains well below its January high. Defense is attracting money....
READ MORE
MEMBERS ONLY
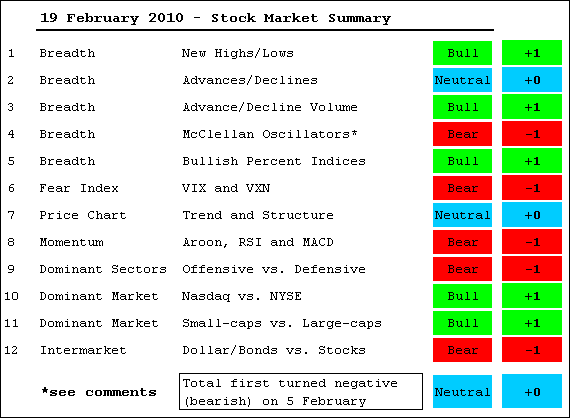
Bounce turns Market Summary Neutral
by Arthur Hill,
Chief Technical Strategist, TrendInvestorPro.com
Transition periods are tricky. The bulk of the evidence shifted towards the bears on February 5th, but the Market Summary Table shifted to +2 this week, which slightly favors the bulls. Three items are responsible for this shift. The McClellan Oscillators both moved above +50. The Nasdaq is outperforming the...
READ MORE
MEMBERS ONLY
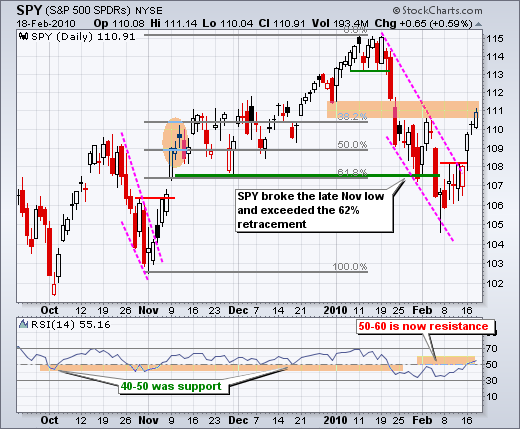
SPY reaches Fibonacci Retracement
by Arthur Hill,
Chief Technical Strategist, TrendInvestorPro.com
Even though SPY closed at its highest close of the month, I still think the ETF is in a resistance zone and this oversold bounce is getting long on tooth. In short, yesterday's advance does not change my overall view. SPY was oversold in early February and this...
READ MORE
