MEMBERS ONLY
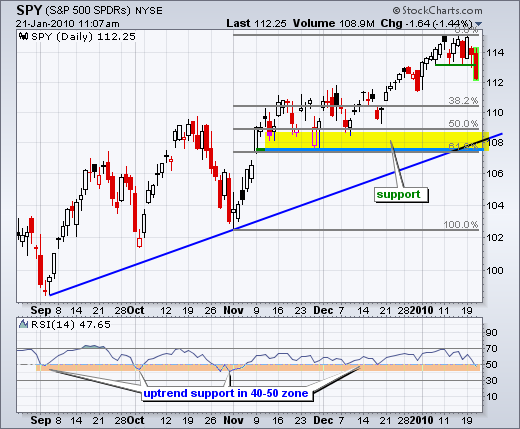
SPY breaks short-term support

by Arthur Hill,
Chief Technical Strategist, TrendInvestorPro.com
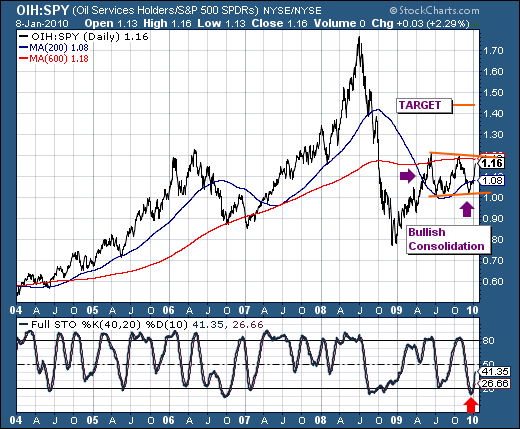
Even though the trend on the daily chart remains up, SPY broke short-term support and a correction appears to be unfolding. With the short-term support break, we can now start estimating a downside target for this correction. The last big move extends from the early November low to...
READ MORE
MEMBERS ONLY

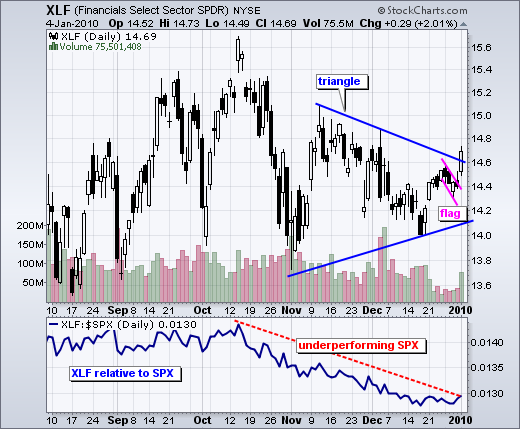
STOCKS GIVE UP TUESDAYS GAINS (QQQQ, IWM) - FINANCE SECTOR HOLDS UP RELATIVELY WELL (XLF, BAC, STT) -DOLLAR SURGES AS EURO PLUNGES (UUP) - EURO BREAKS 200-DAY SMA (FXE) - GLD ETF BREAKS BELOW 110 (GLD) - CHINESE STOCKS FALL SHARPLY ($SSEC)

by John Murphy,
Chief Technical Analyst, StockCharts.com
STOCKS GIVE UP TUESDAYS GAINS... Link for todays video. Stocks came under pressure in early trading and closed lower. All major indices were down with small-caps and large techs leading the way lower. These two groups led the major indices higher on Tuesday, but the tables were turned on...
READ MORE
MEMBERS ONLY
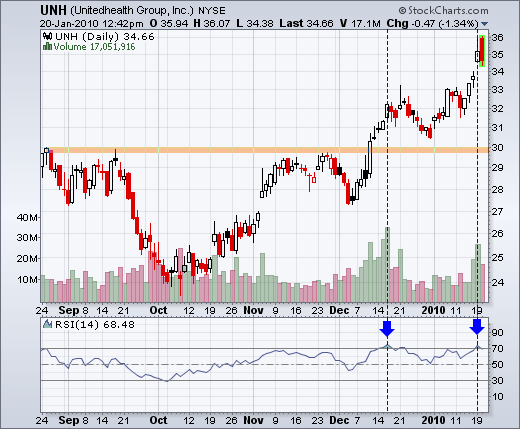
UNH becomes overbought
by Arthur Hill,
Chief Technical Strategist, TrendInvestorPro.com
United Health (UNH) remains in a clear, and strong, uptrend, but the advance could be getting frothy as RSI becomes overbought and red candlestick takes shape on Wednesday. Notice that RSI moved above 70 for the second time in two months (blue arrows). Tuesday's gap is holding for...
READ MORE
MEMBERS ONLY
SPY Battles 114
by Arthur Hill,
Chief Technical Strategist, TrendInvestorPro.com
The medium-term uptrend is not in jeopardy at this point, but there is a clear battle raging around 114 as SPY crossed this level six times in the last eight days. Three of the downside crosses featured some intense selling pressure. Last Tuesday's decline occurred with a...
READ MORE
MEMBERS ONLY

TECHS AND SMALL-CAPS LEAD MARKET (AAPL, QCOM) - HEALTHCARE SPDR SURGES TO NEW HIGH (AMGN, LLY) - IGN EXCEEDS 2009 HIGHS (CIEN, CSCO) - DOLLAR ETF BOUNCES OFF KEY RETRACEMENT - EURO BREAKS FLAG SUPPORT
by John Murphy,
Chief Technical Analyst, StockCharts.com
TECHS AND SMALL-CAPS LEAD MARKET HIGHER... Link for todays video.After a broad-based decline on Friday, buyers returned and pushed stocks higher on Tuesday. All of the major indices were up strong with large-cap techs and small-caps leading the way higher. Chart 1 shows the Nasdaq...
READ MORE
MEMBERS ONLY

LEAP forms bullish engulfing
by Arthur Hill,
Chief Technical Strategist, TrendInvestorPro.com
Direct from the StockScans candlestick page, Leap Wireless (LEAP) formed a bullish engulfing on big volume Friday. A bullish engulfing forms with a filled black or red candlestick and longer white candlestick. The white candlestick's open is below the prior close, but the stock rallies to close above...
READ MORE
MEMBERS ONLY
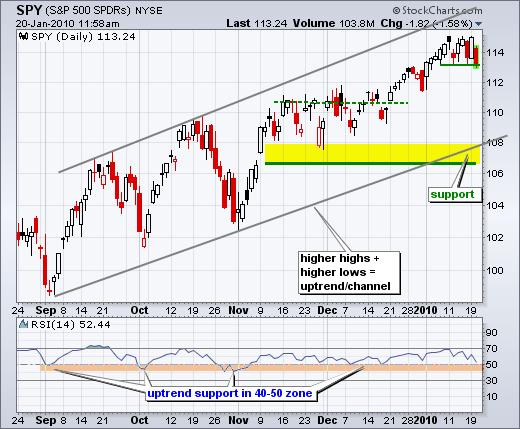
SPY bounces off support
by Arthur Hill,
Chief Technical Strategist, TrendInvestorPro.com
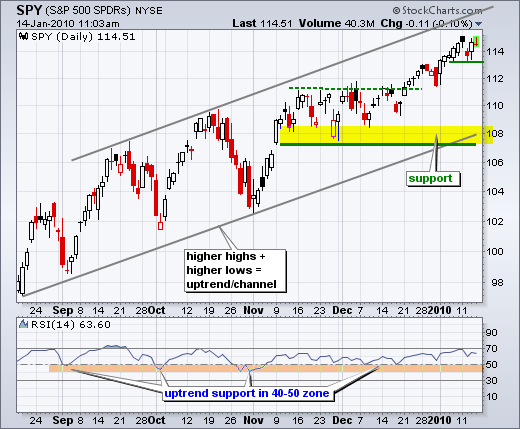
There is no change in the medium-term uptrend (daily chart). SPY is trading in the upper half of a rising price channel. Starting from around 103 in early November, the ETF broke resistance at 111 in late December and moved above 114 in early January. Even though SPY seems...
READ MORE
MEMBERS ONLY

NASDAQ AND NY COMP FALL SHARPLY - BREADTH REMAINS BULLISH OVERALL - INTEL LEADS SEMIS LOWER - SMH PULLS BACK TO BROKEN RESIST - BONDS BOUNCE ON LOW CPI NUMBERS - INFLATION-INDEXED BONDS FOLLOW GOLD
by John Murphy,
Chief Technical Analyst, StockCharts.com
STOCKS FALL SHARPLY ... Link for todays video. Stocks came under pressure for the second time this week. All of the major indices were down on Friday with the small-caps leading the way lower. All nine sectors were down with the finance sector leading lower. Healthcare, consumer staples and utilities,...
READ MORE
MEMBERS ONLY

GLD and TIP move step-for-step
by Arthur Hill,
Chief Technical Strategist, TrendInvestorPro.com
The Gold ETF (GLD) and the Inflation-Protected Bond ETF (TIP) show a positive correlation over the last few months. Both advanced from August to November, fell in December and bounced in January. Looks like gold is following the inflation outlook.
Click this chart for details...
READ MORE
MEMBERS ONLY

Evidence remains bullish
by Arthur Hill,
Chief Technical Strategist, TrendInvestorPro.com
Even though stocks seem overbought and ripe for a correction, there is still more evidence of buying pressure than selling pressure. This means that a correction would be just that - a pullback within a bigger uptrend. It is hard to say when a correction might hit because everyone seems to...
READ MORE
MEMBERS ONLY

SPY tests short-term support
by Arthur Hill,
Chief Technical Strategist, TrendInvestorPro.com
SPY is meeting resistance in the 115 area with a gap down on Monday and some weakness on Thursday. This is not enough to affect the medium-term uptrend. Short-term, the ETF is testing the lower trendline of a rising price channel. Support is marked in the 113-113....
READ MORE
MEMBERS ONLY

IWM HOLDS DECEMBER BREAKOUT - QQQQ FORGES PRICE RELATIVE BREAKOUT - FINANCIALS START THE YEAR STRONG - REGIONAL ENTERS RETRACEMENT SUPPORT ZONE - EURO FORMS RISING FLAG - GOLD ETF ENTERS RETRACEMENT RESISTANCE ZONE
by John Murphy,
Chief Technical Analyst, StockCharts.com
STOCKS EDGE HIGHER IN MIXED TRADING... Link for todays video. All major indices finished slightly higher on Thursday, but trading was mixed within the sectors. Four sectors were up, three were down and two were unchanged. Healthcare led the way higher with the Healthcare SPDR (XLV) recording a new 52-...
READ MORE
MEMBERS ONLY

XLV hits another new high
by Arthur Hill,
Chief Technical Strategist, TrendInvestorPro.com
Money continues to flow into the healthcare sector as the Healthcare SPDR (XLV) recorded another 52-week high this week. XLV bounced off support in early November and surged over 12% in the last 12 weeks. Even though the advance is getting overextended, there are currently no signs of weakness...
READ MORE
MEMBERS ONLY
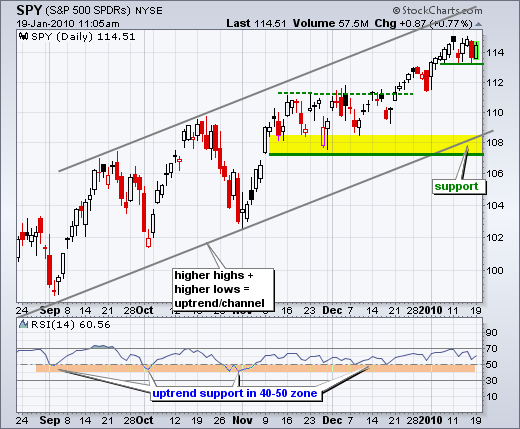
SPY channels higher
by Arthur Hill,
Chief Technical Strategist, TrendInvestorPro.com
Both the daily and 60-minute charts show SPY within rising channels. The daily chart captures the bigger uptrend, while the 60-minute chart captures the short-term uptrend. After an advance from 109 to 115 in 5-6 weeks, the ETF is short-term overbought and ripe for a...
READ MORE
MEMBERS ONLY

XLK gets off to rough start
by Arthur Hill,
Chief Technical Strategist, TrendInvestorPro.com
2010 has not been nice to the technology sector. The PerfChart below extends from January 4th until January 12th. Of the nine sectors SPDRs, and the S&P 500, the Technology SPDR (XLK) is down the most (over 2%). The Industrials SPDR (XLI) and Financials SPDR (XLF) are off...
READ MORE
MEMBERS ONLY

REIT ISHARES BOUNCE OFF CHART SUPPORT -- KIMCO ACHIEVES BULLISH BREAKOUT -- OTHER REIT LEADERS
by John Murphy,
Chief Technical Analyst, StockCharts.com
REIT ISHARES ARE BOUNCING OFF CHART SUPPORT... Last Thursday, I wrote about the improving chart picture in financials and homebuilders, and showed some individual stock leaders in each group. At the end of that message, I showed REIT iShares bouncing off chart support and showing good relative strength. I'...
READ MORE
MEMBERS ONLY

CHINESE BANK TIGHTENING WORRIES GLOBAL STOCKS AND COMMODITIES -- ANOTHER WORRY IS THAT CHINESE STOCKS ARE NO LONGER LEADING THE REST OF THE WORLD HIGHER
by John Murphy,
Chief Technical Analyst, StockCharts.com
KEEPING AN EYE ON CHINA ... The announcement that China is tightening monetary policy by raising bank reserve requirements has caused nervous profit-taking in global stock and commodity markets. Since China has been the engine driving the global economic recovery (not to mention rising stock and commodity prices), any hint...
READ MORE
MEMBERS ONLY
Dow Transports hit new 52-week high
by Arthur Hill,
Chief Technical Strategist, TrendInvestorPro.com
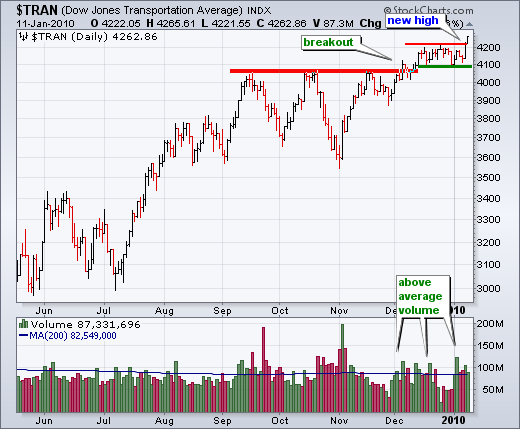
After breaking resistance in December, the Dow Transports consolidated a few weeks and then broke to a new 52-week high this week. Volume has also been strong since early December as many up days occurred with above average volume. And finally, broken resistance turned into support around 4090-4000....
READ MORE
MEMBERS ONLY

DOW THEORY UPTREND CONTINUES -- CATERPILLAR AND CHEVRON ARE DOW LEADERS -- OVERSEAS SHIPBUILDING AND UPS CATAPULT TRANSPORTS TO NEW HIGH -- UTILITIES ARE LAGGING BEHIND BUT REMAIN IN UPTREND
by John Murphy,
Chief Technical Analyst, StockCharts.com
DOW THEORY UPDATE CONFIRMED ... Dow Theorists will be happy to see today's first two charts which show the Dow Industrials and Dow Transports hitting new recovery highs. Dow Theory holds that a healthy uptrend should see new highs in one index confirmed by the other, which is what...
READ MORE
MEMBERS ONLY

XLB hits 62% retracement
by Arthur Hill,
Chief Technical Strategist, TrendInvestorPro.com
With a huge advance since March 2009, the Materials SPDR (XLB) has retraced 62% of the prior decline, which extended from May 2008 to March 2009. There is also potential resistance from broken supports around 34-36.
Click this chart for details...
READ MORE
MEMBERS ONLY

SPY chart update
by Arthur Hill,
Chief Technical Strategist, TrendInvestorPro.com
There is no change in SPY. Both the short-term and medium-term trends remain up, but both are getting overextended and ripe for a pullback or consolidation. Even though this is not reason enough to turn bearish, it does argue for caution on the bullish side. I am off...
READ MORE
MEMBERS ONLY
FINANCIALS CONTINUE TO SURGE
by John Murphy,
Chief Technical Analyst, StockCharts.com
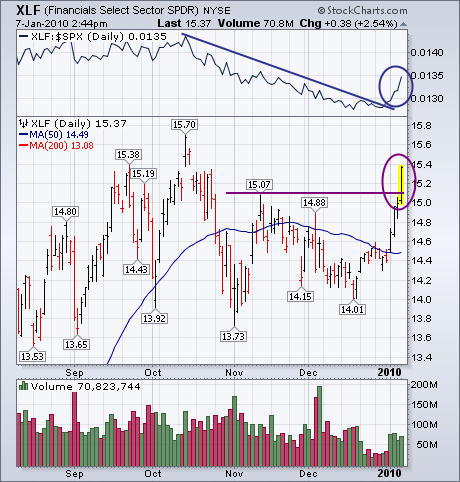
On Tuesday, I showed the financial sector in the process of turning from a market laggard into a market leader. Chart 1 shows that new financial leadership continuing. The Financials SPDR (XLF) has now exceeded its mid-November peak at 15.07 to turn its short-term trend back up...
READ MORE
MEMBERS ONLY
RELATIVE STRENGTH RETURNING TO FINANCIALS

by Tom Bowley,
Chief Market Strategist, EarningsBeats.com
Happy New Year!!!!
It's been awhile since I've spoken about the financials in a positive light. As sector rotation continues though, it appears as if the financials may get their turn after all. I've been watching bank after bank, financial after financial, either moving...
READ MORE
MEMBERS ONLY
ROTATION THE THEME OF 2010

by Richard Rhodes,
Founder and President, Rhodes Capital Management and Rhodes Trading Group
Rotation, rotation and more rotation. This is what 2010 will be about, with the first week of trading a very good example of what to expect. During 2009, there were only 3 S&P sectors out of 10 that out-performed the S&P 500: Consumer Discretionary, Basic...
READ MORE
MEMBERS ONLY
STILL NO DECISIVE MOVE

by Carl Swenlin,
President and Founder, DecisionPoint.com
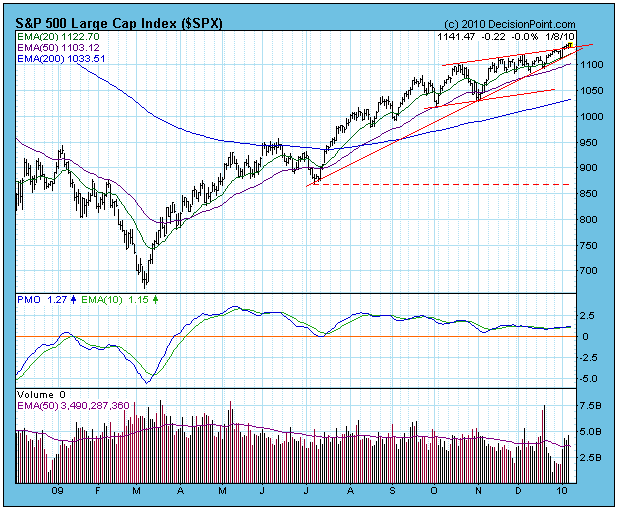
One would think, after a three-week hiatus, that there would be plenty to write about the market. But there isn't. The S&P 500 has drifted higher in an ever-narrowing ascending wedge pattern, making little progress. Since the mid-October top, the S&P...
READ MORE
MEMBERS ONLY
New highs expand in December-January
by Arthur Hill,
Chief Technical Strategist, TrendInvestorPro.com
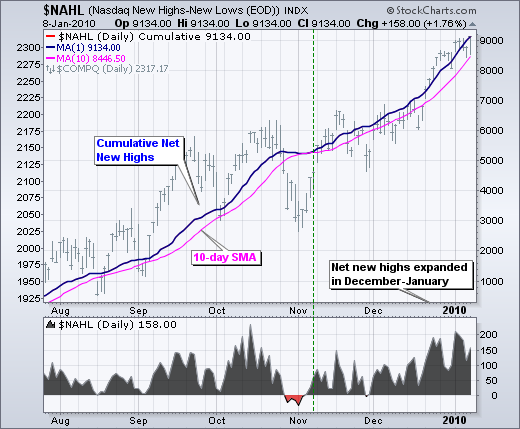
With the advance over the last 3-4 weeks, Net New Highs expanded to their highest levels since October. Net New Highs equals new 52-week highs less new 52-week lows. The bulls have a clear edge when Net New Highs are positive and rising. Conversely, the bears have...
READ MORE
MEMBERS ONLY

TECHNICAL ANALYSIS 101 - PART 16
This is the next part of a series of articles about Technical Analysis from a new course we're developing. If you are new to charting, these articles will give you the "big picture" behind the charts on our site. if you are an "old hand&...
READ MORE
MEMBERS ONLY

FIBONACCI RETRACEMENTS REVISITED - SPY ADVANCES WITHIN CHANNEL - VOLUME FAILS TO IMPRESS, BUT PRICE DOES - AD VOLUME LINES HIT NEW HIGHS - NEW HIGHS EXPAND IN DECEMBER-JANUARY
by John Murphy,
Chief Technical Analyst, StockCharts.com
FIBONACCI RETRACEMENTS REVISITED... Link for todays video. Wednesdays Market Message triggered a number question regarding my decision to base retracements on the decline from May 2008 to March 2009. Chart 1 shows the S&P 500 ETF (SPY) with the Fibonacci Retracements Tool based on this decline. Representing the...
READ MORE
MEMBERS ONLY

Evidence remains bullish
by Arthur Hill,
Chief Technical Strategist, TrendInvestorPro.com
The bulk of the medium-term evidence remains bullish for stocks. Commentary featuring some of these indicators can be found in the Market Message later today.
There is a brief run down of the 12 indicator groups after the jump. Updated breadth charts can be found on the breadth charts...
READ MORE
MEMBERS ONLY

QQQQ holds Ichimoku support
by Arthur Hill,
Chief Technical Strategist, TrendInvestorPro.com
The strength of the current rally can be seen with QQQQ and the Ichimoku cloud indicator, which marks a support zone. Notice how QQQQ bounced near the top of the cloud in July and in the middle of the cloud in early November. Cloud support is currently in the 42....
READ MORE
MEMBERS ONLY

SPY chart update
by Arthur Hill,
Chief Technical Strategist, TrendInvestorPro.com
As one may have guessed, there is no change in SPY. I am, however, providing updated daily and 60-minute charts. On the daily chart, SPY continued its January run with a close above 114 for the first time since September 2008. January is getting off to a good start...
READ MORE
MEMBERS ONLY

FINANCIALS CONTINUE TO SURGE -- REGIONAL BANK HOLDERS TURN UP AS WELL -- BANK RALLY IS HELPED BY JUMP IN HOMEBUILDERS -- REITS BOUNCE OFF SEPTEMBER PEAK AND CONTINUE TO SHOW RELATIVE STRENGTH
by John Murphy,
Chief Technical Analyst, StockCharts.com
FINANCIAL RALLY CONTINUES... On Tuesday, I showed the financial sector in the process of turning from a market laggard into a market leader. Chart 1 shows that new financial leadership continuing today. The Financials SPDR (XLF) has now exceeded its mid-November peak at 15.07 to turn its short-...
READ MORE
MEMBERS ONLY

DELL enters gap zone
by Arthur Hill,
Chief Technical Strategist, TrendInvestorPro.com
With a pretty nice advance the last 4-5 weeks, DELL returned to the gap zone and retraced 62% of its prior decline. Resistance in this area is becoming apparent with four red candlesticks over the last eight days.
Click this chart for details...
READ MORE
MEMBERS ONLY

Waiting on the employment report
by Arthur Hill,
Chief Technical Strategist, TrendInvestorPro.com
There is no change on the daily or 60-minute charts, both of which are currently bullish. SPY has been up 14 of the last 19 trading days with the ETF moving from ~109 to ~114 over this four week period (up ~4.5% since December 9th). Even though one...
READ MORE
MEMBERS ONLY

BOOM breaks resistance with volume
by Arthur Hill,
Chief Technical Strategist, TrendInvestorPro.com
Dynamic Materials (BOOM) broke through resistance with a high volume surge over the last three days. In addition, the pattern from October to December looks like an inverse head-and-shoulders with neckline resistance around 21....
READ MORE
MEMBERS ONLY

COMMODITY ETF SCORES BIG - WHEAT LIFTS AGRICULTURE ETF - METALS ETF HITS NEW HIGH - MATERIALS LEAD THE MARKET - INVESTOR SENTIMENT SURVEYS HIT EXTREMES - SPY AND DIA EDGE ABOVE KEY RETRACEMENTS - QQQQ AND IWM EXCEED KEY RETRACEMENTS
by John Murphy,
Chief Technical Analyst, StockCharts.com
COMMODITY ETF SCORES BIG GAINS... Link for todays video. An array of positive factors boosted commodity related ETFs on Wednesday. Commodities benefited from weakness in the Dollar over the last two weeks and energy-related commodities benefited from the cold weather. In particular, oil surged over 10% in the last...
READ MORE
MEMBERS ONLY

No change in SPY
by Arthur Hill,
Chief Technical Strategist, TrendInvestorPro.com
There is no change in my SPY analysis, but I will post updated daily and 60-minute charts for your viewing pleasure. I will post a Market Message commentary later this afternoon....
READ MORE
MEMBERS ONLY

FINANCIAL ETF EXCEEDS 50-DAY AVERAGE -- SO DO SEVERAL BIG BANKS AND BROKERS -- HARTFOLD FINANCIAL IS DAY'S FINANCIAL LEADER
by John Murphy,
Chief Technical Analyst, StockCharts.com
FINANCIAL LAGGARDS TURN UP ... We normally focus on market groups that have been market leaders. Today, however, I'm going to focus on the sector that has been the market's weakest throughout the fourth quarter. That would be the financials. The reason I'm turning to...
READ MORE
MEMBERS ONLY
Semis lead industry groups
by Arthur Hill,
Chief Technical Strategist, TrendInvestorPro.com
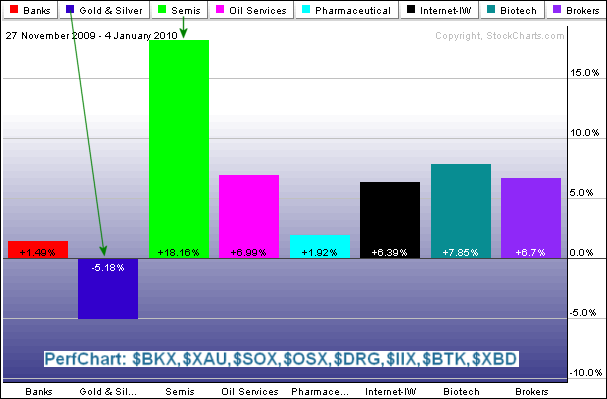
The Perfchart below shows eight industry groups over the last five weeks (25 trading days). Semis ($SOX) are by far the strongest group. Gold & Silver ($XAU) represent the weakest group. It is also notable that Banks ($BKS) are lagging the other advancing groups.
Click this chart for details...
READ MORE
MEMBERS ONLY
Charts of Interest
by Arthur Hill,
Chief Technical Strategist, TrendInvestorPro.com
AMGN, ANF, DRYS, GERN, GT, IGT, MOT, S , SII, SVNT, XLF, XLY...
READ MORE
