MEMBERS ONLY

Stocks: Bearish Setups

by Arthur Hill,
Chief Technical Strategist, TrendInvestorPro.com
Comerica (CMA), Ebay (EBAY) and Joy Global (JOYG).
Comerica (CMA) fails resistance test. After breaking support with a sharp decline in October, CMA rebounded and never came close to its October high. Broken support around 29.5 turned into resistance and the stock formed a bearish engulfing pattern on Thursday....
READ MORE
MEMBERS ONLY
Stocks: Bullish Setups
by Arthur Hill,
Chief Technical Strategist, TrendInvestorPro.com
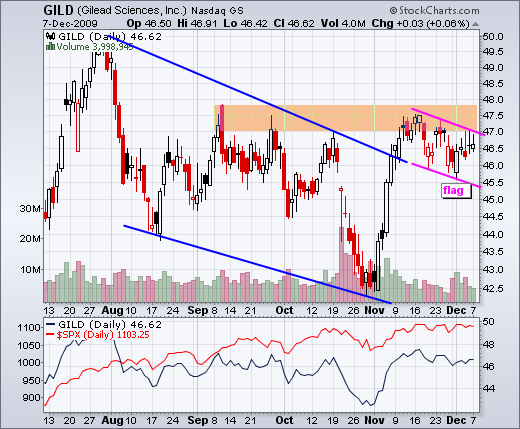
Gilead (GILD), Kroger (KR) and NY Times (NYT)
Gilead (GILD) forms a bull flag. After a big surge on good volume in early November, GILD consolidated with a falling flag over the last few weeks. There was a bullish reversal day last Monday, but no follow through with a breakout....
READ MORE
MEMBERS ONLY
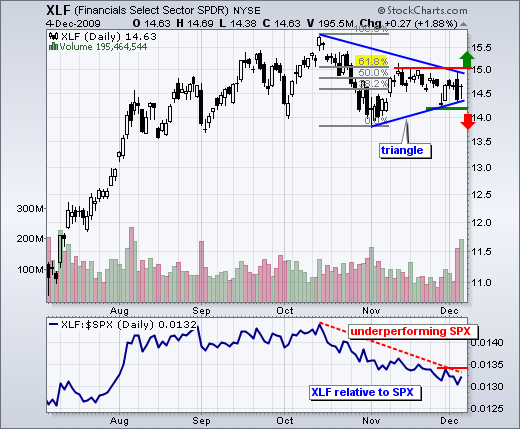
XLE and XLF: the weakest sectors
by Arthur Hill,
Chief Technical Strategist, TrendInvestorPro.com
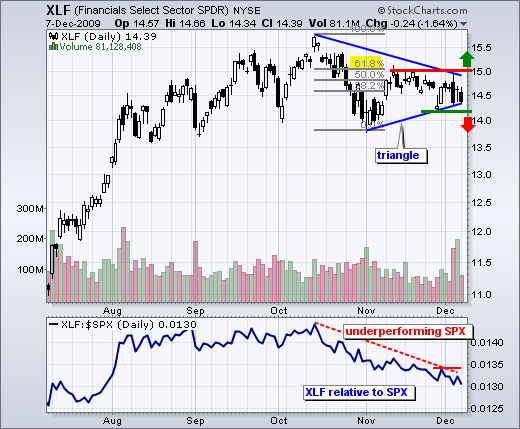
Although the energy and the finance sectors are not related, both are clearly the weakest of the nine sector SPDRs over the last two months. The Financials SPDR (XLF) is more important to the overall market. You know the drill. While SPY moved to a new reaction high in November,...
READ MORE
MEMBERS ONLY
SPY: consolidation within uptrend
by Arthur Hill,
Chief Technical Strategist, TrendInvestorPro.com
There is a difference between actual weakness and flat trading, especially within a bigger uptrend. I think we can all agree that SPY has been trending higher since early July, perhaps even since mid March. The ETF first crossed above 111 on November 16th and closed just below 111 on...
READ MORE
MEMBERS ONLY
Under-invested in an uptrend
by Arthur Hill,
Chief Technical Strategist, TrendInvestorPro.com
What makes me think under-invested portfolio managers could keep the market buoyant into yearend? The following quote comes from Jeffrey Saut, Chief Investment Strategist at Raymond James:
Net long positions at professional money management firms remain in the 50-60% range, which is well below the 70-75% level...
READ MORE
MEMBERS ONLY

TELECOM AND UTILITIES SHOW STRONG CHART ACTION AND CONTINUE TO BENEFIT FROM MOVE INTO DIVIDEND-PAYING STOCKS

by John Murphy,
Chief Technical Analyst, StockCharts.com
BARRON'S ARTICLE GIVES BOTH GROUPS A BOOST... I've written a couple of articles over the last two weeks about the recent move into dividend paying stocks like telecom and utilities. A weekend Barron's article (Even Better Than Bonds) wrote about how relatively low bond...
READ MORE
MEMBERS ONLY

XLU forges a 52-week high
by Arthur Hill,
Chief Technical Strategist, TrendInvestorPro.com
Seven of the nine sector SPDRs recorded new 52-week highs in November or December. Among those, the Utilities SPDR (XLU) broke resistance from its 2009 highs with a surge above 31 this month. The ETF is short-term overbought after a 10% advance the last six weeks, but the...
READ MORE
MEMBERS ONLY

SPY battles 111
by Arthur Hill,
Chief Technical Strategist, TrendInvestorPro.com
Despite closing up on the day, I was not impressed with Friday's price action. A surprisingly small decline (-11K) in non-farm payrolls prompted the bulls into action as SPY opened around 111.84. These gains were fleeting as SPY declined to 110.04 in late morning. Even...
READ MORE
MEMBERS ONLY

Dollar, gold, oil and bonds
by Arthur Hill,
Chief Technical Strategist, TrendInvestorPro.com
-Dollar surges as bonds and gold plunge
-The Dollar is on the verge of a breakout and trend reversal
-Gold moves into corrective mode
-Extended channel defines downtrend in oil
-Bonds remain in overall uptrend despite last week's plunge
-Inter-market charts updated
Dollar*********************************************************
The US Dollar Index...
READ MORE
MEMBERS ONLY
ETF SCANS, STUFFED MAILBAGS, AND SNOWFLAKES - OH MY!
WINTER HAS ARRIVED AT STOCKCHARTS - Snowflakes are now at the top of most of our pages.
SCANNING FOR JUST ETFs - Members can now choose to run their scans against ETFs only. Members can use the "Groups" dropdown on the Standard Scan Workbench (or the "Indices and ETFs&...
READ MORE
MEMBERS ONLY
HOT STOCK(CHARTS) TIPS
Hello Fellow ChartWatchers!
This week, I'm taking time off from our on-going "Technical Analysis 101" series, to enlist your help. We are in the process of compiling a list of "Tips" for using StockCharts.com and we need you to review the tips...
READ MORE
MEMBERS ONLY
BOND YIELDS AND DOLLAR BOUNCE
by John Murphy,
Chief Technical Analyst, StockCharts.com
Sometimes good news produces a bad effect. That's especially true when dealing with financial markets. Today's unemployment report dropped to 10% and payrolls fell by an unusually small amount. That good news was given a positive reception by most markets. By day's end, however,...
READ MORE
MEMBERS ONLY
Finance sector still lagging
by Arthur Hill,
Chief Technical Strategist, TrendInvestorPro.com
The finance sector continues to underperform the overall market. While the S&P 500 and Dow are consolidating near 52-week highs, the Financials SPDR (XLF) remains well below its October high and shows relative weakness. The bottom indicator contains the price relative, which is the XLF:$SPX ratio....
READ MORE
MEMBERS ONLY
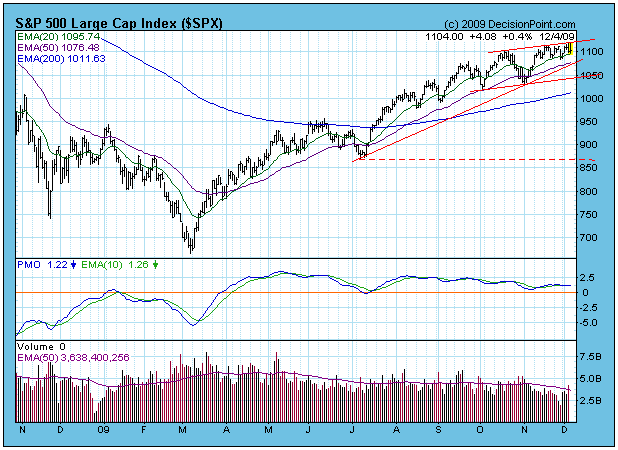
EXPECTING UPSIDE BREAKOUT

by Carl Swenlin,
President and Founder, DecisionPoint.com
On Thanksgiving Day Dubai announced that it would be delaying loan payments by six months. This resulted in a global selloff, in which the U.S. markets participated on the following day. There was virtually no follow through selling this week. Looking at the S&P 500 chart below,...
READ MORE
MEMBERS ONLY
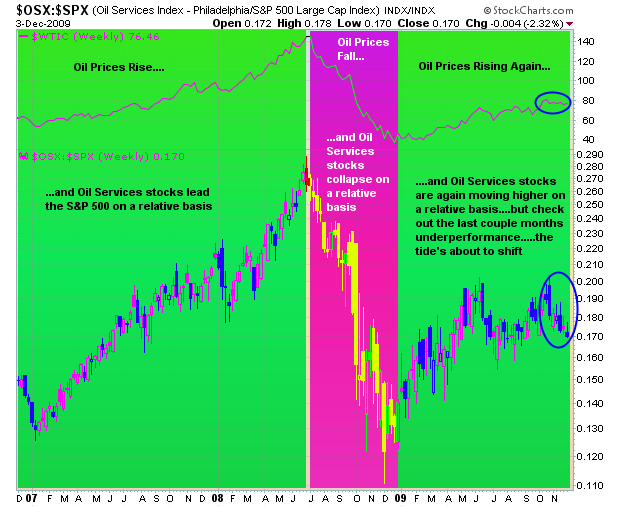
Oil Services Ready to Run?

by Tom Bowley,
Chief Market Strategist, EarningsBeats.com
When I see a relationship in the market that tends to hold true over time, it always peaks my interest when the market varies from that "norm". That seems to be the case right now with oil services stocks. Generally speaking, when oil prices rise, money flows to...
READ MORE
MEMBERS ONLY

STRONG JOBS REPORT BOOSTS BOND YIELDS AND THE DOLLAR -- GOLD PLUNGES -- CHIPS, TRANSPORTS, REITS, AND SMALL STOCKS STRENGTHEN -- MAJOR STOCK INDEXES TEST LONG-TERM RESISTANCE LINES
by John Murphy,
Chief Technical Analyst, StockCharts.com
BOND YIELDS AND DOLLAR BOUNCE... Sometimes good news produces a bad effect. That's especially true when dealing with financial markets. Today's unemployment report dropped to 10% and payrolls fell by an unusually small amount. That good news was given a positive reception by most markets. By...
READ MORE
MEMBERS ONLY
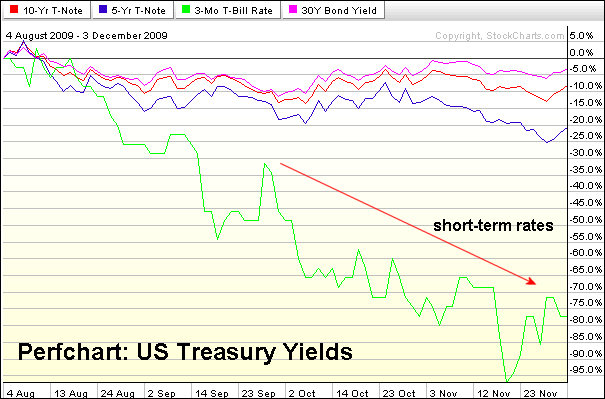
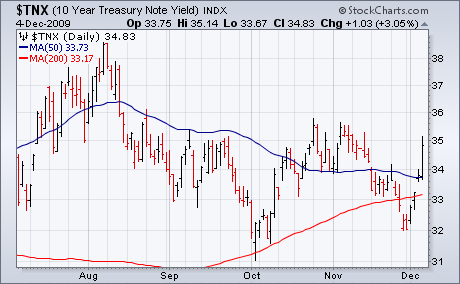
Short-term rates fall sharply
by Arthur Hill,
Chief Technical Strategist, TrendInvestorPro.com
The US Treasury Yield Perfchart shows yields falling since early August. In particular, short-term rates (green line) have fallen sharply in the last three months. Treasuries rise when rates fall so these declines suggest money moving into Treasuries.
Click this chart for details...
READ MORE
MEMBERS ONLY
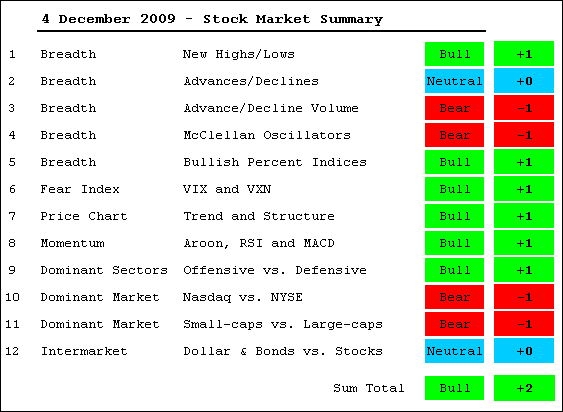
MT Evidence remains bullish
by Arthur Hill,
Chief Technical Strategist, TrendInvestorPro.com
-MT Evidence remains bullish
-Net New Highs are fewer, but still positive
-Nasdaq AD Line shows weakness in small techs
-AD Volume Lines remain below October highs
-Consumer discretionary Bullish% Index declines sharply
-Volatility remains low
-DIA and SPY consolidate near highs
-Momentum indicators still bullish overall
-Finance sector continues...
READ MORE
MEMBERS ONLY
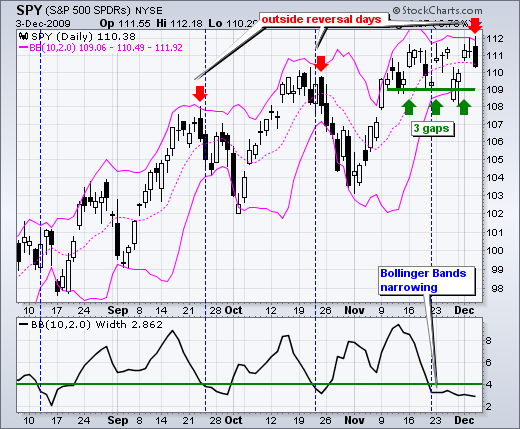
An outside reversal day for SPY
by Arthur Hill,
Chief Technical Strategist, TrendInvestorPro.com
The S&P 500 ETF (SPY) traded on either side of unchanged most of the day and then got hit with some late selling pressure in the final 20 minutes. Market participants were probably squaring positions ahead of Friday's employment report, which often produces a sizable gap...
READ MORE
MEMBERS ONLY

RELATIVE WEAKNESS IN FINANCE WEIGHS - HOMEBUILDERS CONTINUE TO UNDERPERFORM - RETAILS UNDER PRESSURE - WALMART HANGING TOUGH
by John Murphy,
Chief Technical Analyst, StockCharts.com
RELATIVE WEAKNESS FINANCE WEIGHS... Link for todays video. Even though the major indices and sectors remain in uptrends overall, there are a few key areas of weakness that merit attention. First and foremost, the Financials SPDR (XLF) remains a drag on the overall market. Even with strength in Bank of...
READ MORE
MEMBERS ONLY

ENERGY CONTINUES TO LAG S&P 500 - BOLLINGER BANDS CONTRACT IN XLE - OIH SHOWS RELATIVE WEAKNESS - OIL TESTS SUPPORT FROM BROKEN RESISTANCE - A DISCONNECT WITH THE NATURAL GAS ETFS
by John Murphy,
Chief Technical Analyst, StockCharts.com
ENERGY CONTINUES TO LAG THE S&P 500... Note: There will be another posting with a video later today. November was not a good month for the Energy SPDR (XLE). Chart 1 shows the Sector SPDR Perfchart with the absolute performance for the nine sectors and the S&...
READ MORE
MEMBERS ONLY
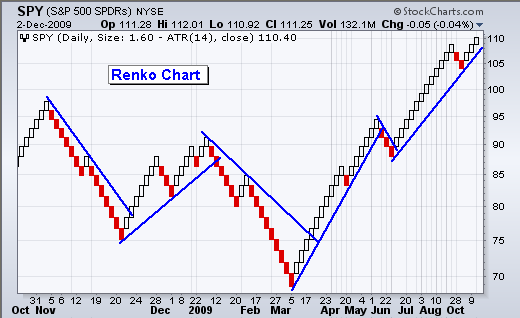
Renko charts filter the noise
by Arthur Hill,
Chief Technical Strategist, TrendInvestorPro.com
The chart below shows a Renko chart for the S&P 500 ETF (SPY). Like Point & Figure, these charts focus on price action, independent of time. Notice that the first half of the chart extends from late October 2008 to early March 2009. The second half extends from...
READ MORE
MEMBERS ONLY

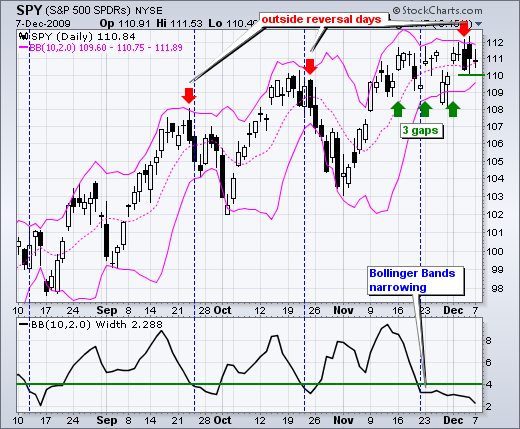
A volatility contraction for SPY
by Arthur Hill,
Chief Technical Strategist, TrendInvestorPro.com
Despite three up gaps in the last three weeks and a volatile range on the 60-minute chart, SPY remains stuck in a trading range with contracting volatility on the daily chart. The chart shows Bollinger Bands (10,2) with Bollinger Band Width in the indicator window. Bollinger Band Width...
READ MORE
MEMBERS ONLY

DOW STALLS NEAR TOP OF CHANNEL - BOLLINGER BAND WIDTH NARROWS FOR SPY - SMH SURGES BACK TO RESISTANCE - LRCX-SNDK-TSM LEAD SEMIS HIGHER - DOW TRANSPORTS CHALLENGES RESISTANCE - DJ TRUCKING INDEX SURGE - DJ AIRLINE INDEX LEADS TRANSPORTS HIGHER
by John Murphy,
Chief Technical Analyst, StockCharts.com
DOW STALLS NEAR TOP OF CHANNEL... Link for todays video. The Dow Industrials stalled as the market traded with indecision on Wednesday. Chart 1 shows a clear uptrend over the last several months. A series of higher highs and higher lows formed since August. With this zigzag higher we can...
READ MORE
MEMBERS ONLY

Airlines go from lagging to leading
by Arthur Hill,
Chief Technical Strategist, TrendInvestorPro.com
After underperforming the S&P 500 in October, the Amex Airline Index ($XAL) reversed course to become a leader in November. This leadership role picked up steam the last three days as XAL broke above consolidation resistance. The indicator window shows the price relative ($XAL:$SPX ratio). $XAL outperforms...
READ MORE
MEMBERS ONLY

SPY extends volatile range
by Arthur Hill,
Chief Technical Strategist, TrendInvestorPro.com
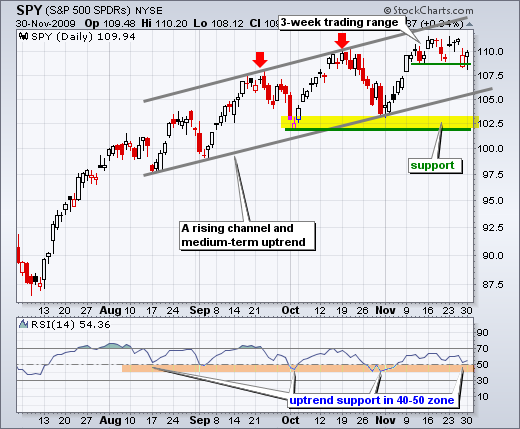
SPY gapped up and held its gains to close above 111 for the fifth time in eleven days. There is no change in the medium-term picture. SPY remains within a rising price channel overall with key support around 102. The ETF surged above 110 the second week of October...
READ MORE
MEMBERS ONLY

Japan lags Europe and China
by Arthur Hill,
Chief Technical Strategist, TrendInvestorPro.com
The US and European markets bottomed in early July and have been moving higher the last five months. These indices are up 18-23% since early July. The Shanghai Composite ($SSEC) is also up, but less than 5% and lagging the US and Europe. In stark contrast to these gainers,...
READ MORE
MEMBERS ONLY

GLOBAL STOCKS AND COMMODITIES JUMP AS DOLLAR DROPS -- 50-DAY MOVING AVERAGES CONTAIN PULLBACK -- GOLD STOCKS HIT NEW HIGHS -- SEMICONDUCTORS TRY TO RETAKE 50-DAY LINE -- UTILITIES ARE BREAKING OUT
by John Murphy,
Chief Technical Analyst, StockCharts.com
GLOBAL PULLBACK FINDS SUPPORT AT 50-DAY LINES... As fears about Dubai reside, global stocks have regained their upside momentum. All three U.S. stock indexes found support at or above their rising 50-day moving averages as shown in the first three charts. That has removed any immediate threat...
READ MORE
MEMBERS ONLY
Tuesday video includes...
by Arthur Hill,
Chief Technical Strategist, TrendInvestorPro.com
-SPY shows resilience
-QQQQ forms falling flag
-IWM and the January effect
-Key sectors with short-term downtrends
-Stocks with bullish setups:
CAKE, CHK, CSCO, DELL, INTC, NVDA and OMC
-Click here for the video page...
READ MORE
MEMBERS ONLY
Stocks with bullish setups
by Arthur Hill,
Chief Technical Strategist, TrendInvestorPro.com
A number of stocks, ETFs and indices gapped down on Friday and then firmed on Monday. Friday's gap and decline endorsed the bearish case, but firmness on Monday shows indecision. The ability to fill Friday's gap would be considered bullish. Keep this in mind when reviewing...
READ MORE
MEMBERS ONLY
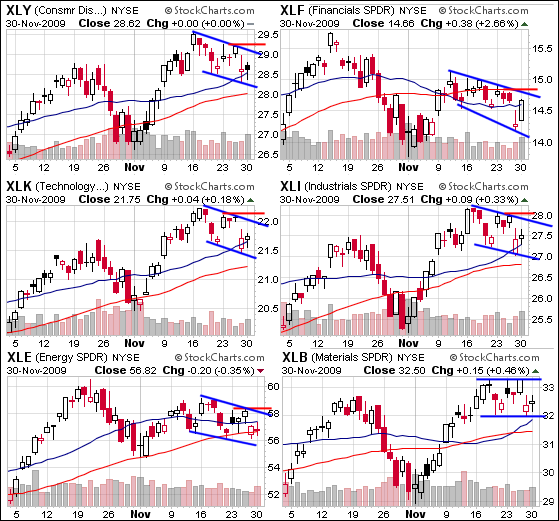
ST downtrends in the sector SPDRs
by Arthur Hill,
Chief Technical Strategist, TrendInvestorPro.com
On the CandleGlance charts, the four offensive sectors sport falling consolidations over the last 2-3 weeks. After recording higher highs in mid November, the Consumer Discretionary SPDR (XLY), Technology SPDR (XLK) and Industrials SPDR (XLI) pulled back with falling flags over the last two weeks. Technically, we could call...
READ MORE
MEMBERS ONLY
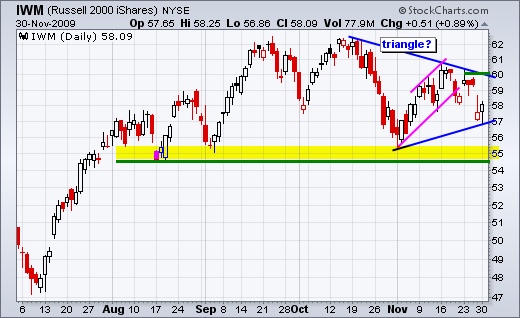
IWM and the January effect
by Arthur Hill,
Chief Technical Strategist, TrendInvestorPro.com
While the rising flag (pink) and support break at 58 were bearish for IWM, we must always be prepared for the unexpected when dealing with the stock market. What would be the precursor if IWM were to move above 62 by yearend? First, we must not forget the January effect,...
READ MORE
MEMBERS ONLY

A bull flag for QQQQ
by Arthur Hill,
Chief Technical Strategist, TrendInvestorPro.com
There is no denying the uptrend in QQQQ over the last few months. Even with the pullback over the last two weeks, QQQQ is within spitting distance of its 2009 high. Moreover, this pullback looks like a falling flag, which is a bullish consolidation. A break above flag resistance would...
READ MORE
MEMBERS ONLY
SPY: bulls show resilience
by Arthur Hill,
Chief Technical Strategist, TrendInvestorPro.com
Despite negative ramblings with Dubai and black Friday, the S&P 500 ETF (SPY) is showing resilience on the daily chart. SPY gapped down on Friday, but closed well above its open to form a white candlestick. Even though Monday's candlestick shows an intraday dip to 108....
READ MORE
MEMBERS ONLY

Silver and Gold Perfchart
by Arthur Hill,
Chief Technical Strategist, TrendInvestorPro.com
It has been a big year for gold, but an even bigger year for silver. As the Perfchart shows, $SILVER underperforms $GOLD on the way down and outperforms on the way up. Silver was down more than gold in April and July, but up more than gold in June and...
READ MORE
MEMBERS ONLY

SPY: Short-term trend reversal
by Arthur Hill,
Chief Technical Strategist, TrendInvestorPro.com
Friday's decline reversed the short-term uptrend, but the medium-term trend remains up. On the daily chart, SPY has been zigzagging higher the last 3-4 months. After moving above its October high in mid November, SPY stalled around 110 with choppy trading for two weeks. Friday&...
READ MORE
MEMBERS ONLY
Intermarket chart page updated
by Arthur Hill,
Chief Technical Strategist, TrendInvestorPro.com
-Bonds show relative strength with a 5-month closing high
-Another new low in short-term rates weighs on the Dollar
-Gold remains overextended, but still strong
-The 5-week downtrend in oil looks like a falling flag
-Bonds surge with biggest 2-week surge since November 2008
- Click here...
READ MORE
MEMBERS ONLY

GLOBAL MARKETS DROP ON DUBAI CONCERNS -- STOCKS AND COMMODITIES DROP WHILE THE DOLLAR AND BONDS RALLY -- SO FAR, NO SERIOUS CHART DAMAGE HAS BEEN DONE -- BUT A MORE CAUTIOUS TONE IS WARRANTED
by John Murphy,
Chief Technical Analyst, StockCharts.com
ATTEMPT TO DELAY DEBT PAYMENTS RATTLES MARKETS... An attempt by Dubai to delay debt payments for six months has rattled world markets. Most global stock markets fell on Thursday while the U.S. market was closed for the Thanksgiving holiday. That's why U.S. stock markets are dropping...
READ MORE
MEMBERS ONLY
Friday video includes...
by Arthur Hill,
Chief Technical Strategist, TrendInvestorPro.com
-SPY stalls near resistance
-IWM traces out a symmetrical triangle
-Medium-term Evidence Remains Bullish
-Defensive sectors perking up
-Interest rates and the Dow
-Bond ETF holds resistance breakout
-Click here for the video page...
READ MORE
MEMBERS ONLY
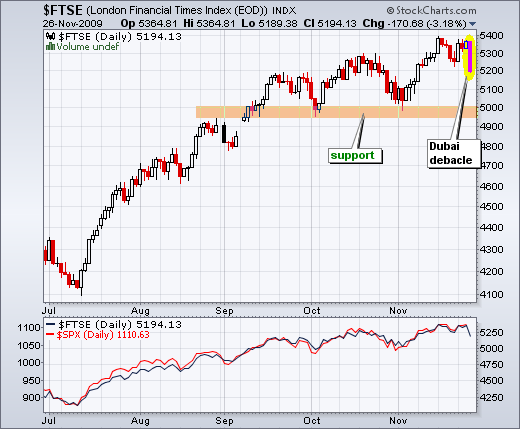
FTSE plunges on Dubai concerns
by Arthur Hill,
Chief Technical Strategist, TrendInvestorPro.com
The London FTSE ($FTSE) dropped over 3% on the prospects of a sovereign default from Dubai. Even with this sharp decline, the medium-term trend is up as the index recorded a new reaction high just two weeks ago. Major support is set in the 4950-5000 area. A break...
READ MORE
