MEMBERS ONLY
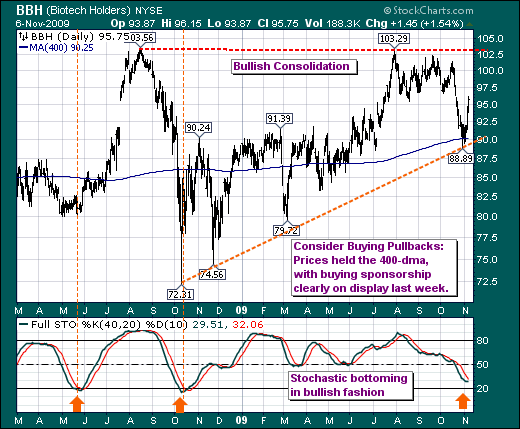
BIOTECHNOLOGY ETF FINDING SPONSORSHIP

by Richard Rhodes,
Founder and President, Rhodes Capital Management and Rhodes Trading Group
We find it rather interesting that the laggard Biotechnology group and the Biotechnology ETF (BBH) in particular have begun to find sponsorship; and it is our opinion that BBH is set to embark upon a period of both absolute and relative out-performance. Quite simply, BBH is forming a rather...
READ MORE
MEMBERS ONLY
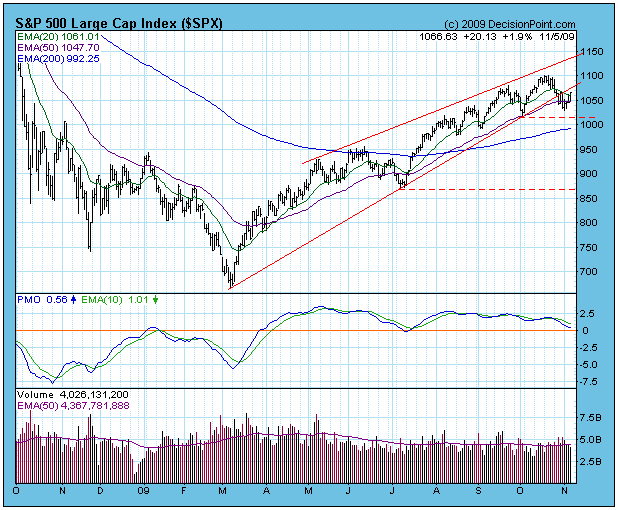
MARKET IS STRONG, BUT CORRECTION SHOULD CONTINUE

by Carl Swenlin,
President and Founder, DecisionPoint.com
Looking at the S&P 500 chart below, the breakdown from the ascending wedge pattern is clear enough, and expectation of the breakdown has been fulfilled. The rising trend line violation brings with it the expectation of a continued decline, but I do not have a price target at...
READ MORE
MEMBERS ONLY
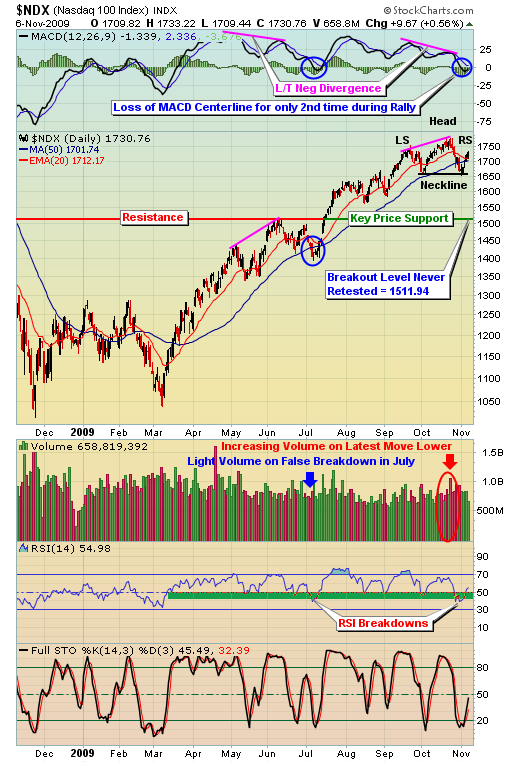
VOLUME TRENDS REVERSE; H&S PATTERNS EMERGE

by Tom Bowley,
Chief Market Strategist, EarningsBeats.com
In my latest article on October 18, I provided a very cautious tone but noted that volume trends remained strong - good news for the bulls! Well, short-term volume trends now have turned negative, though the really key long-term price support levels remain intact. A couple damaging technical developments...
READ MORE
MEMBERS ONLY
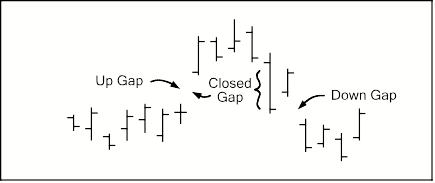
TECHNICAL ANALYSIS 101 - PART 15
This is the next part of a series of articles about Technical Analysis from a new course we're developing. If you are new to charting, these articles will give you the "big picture" behind the charts on our site. if you are an "old hand&...
READ MORE
MEMBERS ONLY

Bulk of Evidence Remains Bullish

by Arthur Hill,
Chief Technical Strategist, TrendInvestorPro.com
It's the bulls by a nose. After the October decline, the bulk of the medium-term evidence was teetering on the edge of turning bearish. However, a sizable bounce this week brought the bulls back from the brink. As a result, the bulk of the evidence remains bullish....
READ MORE
MEMBERS ONLY
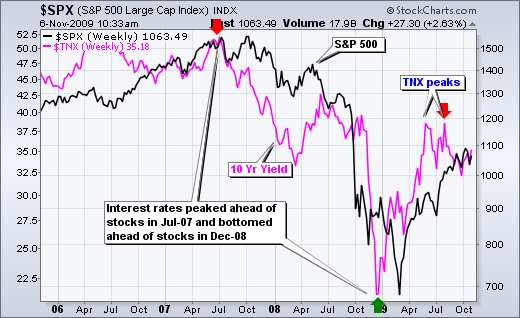
LONG-TERM RATES MOVING BEFORE STOCKS
by Arthur Hill,
Chief Technical Strategist, TrendInvestorPro.com
The 10-Year Treasury Yield ($TNX) is largely positively correlated with the S&P 500 - and also shows a propensity to lead the stock market. The chart below shows the 10-Year Treasury Yield peaking in July 2007 and stocks peaking in October 2007, three months later. Similarly, the...
READ MORE
MEMBERS ONLY

BARRICK GOLD AND NEWMONT MINING HIT 52-WEEK HIGHS -- GOLD IS SOARING VERSUS THE CHINESE YUAN WHICH MAY PROMPT CHINESE BUYING -- GOLD AND GOLD STOCKS ARE STILL CHEAP RELATIVE TO S&P 500 -- GOLD IS OVERBOUGHT BUT STILL THE STRONGEST MARKET IN THE WORLD

by John Murphy,
Chief Technical Analyst, StockCharts.com
BARRICK AND NEWMONT MINING TURN UP ... With gold hitting new record highs each day, gold stocks are starting to play catch-up. Two of the biggest are at or very close to hitting new 52-week highs. Chart 1 shows Barrick Gold closing at a new 52-week high today....
READ MORE
MEMBERS ONLY

Nvidia Bounces off Broken Resistance
by Arthur Hill,
Chief Technical Strategist, TrendInvestorPro.com
Broken resistance turns into support. This is a classis tenet of technical analysis. Nvidia (NVDA) broke resistance around 12-12.5 in July and returned to this breakout area in late October. Notice that I drew a zone. Support and resistance levels are rarely exact. With a gap and surge...
READ MORE
MEMBERS ONLY
Video Update Posted
by Arthur Hill,
Chief Technical Strategist, TrendInvestorPro.com
Today's video includes:
-A short-term uptrend for SPY
-SPY holds medium-term support
-Elliott wave for the S&P 500 and Nasdaq
-Offensive sectors remain bullish
-Long-term rates peak
-Short-term rates trending lower
-Market Summary Update on Saturday
-Click here for the video page....
READ MORE
MEMBERS ONLY
And Now for the Employment Report
by Arthur Hill,
Chief Technical Strategist, TrendInvestorPro.com
Wall Street is waiting for sparks from the employment report, but we may have already seen the sparks with yesterday's rally. Nevertheless, there is still a chance for a sizable move today (1-2%). Therefore, I am going to wait for today's close (data) before updating...
READ MORE
MEMBERS ONLY
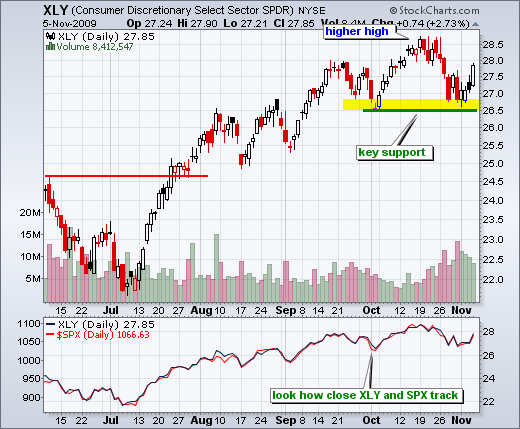
Offensive Sectors Still Holding Up
by Arthur Hill,
Chief Technical Strategist, TrendInvestorPro.com
On the market summary table, I watch offensive sectors closely for clues on the overall market. Offensive sectors should keep pace with the market (S&P 500) during a bull run. Relative weakness or a bearish divergence would show underlying weakness. Offensive sectors include consumer discretionary, technology, finance and...
READ MORE
MEMBERS ONLY
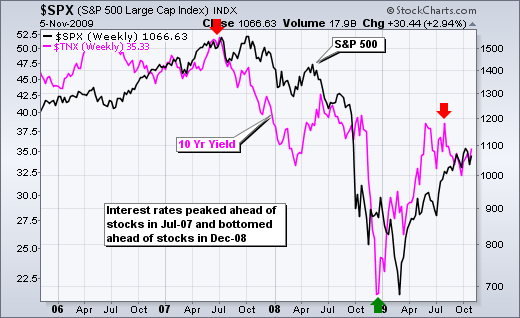
Rates, Stocks and the Dollar
by Arthur Hill,
Chief Technical Strategist, TrendInvestorPro.com
The 10-Year Treasury Yield ($TNX) is largely positively correlated with the S&P 500 - and also shows a propensity to lead the stock market. Notice how the 10-Year Treasury Yield peaked in July 2007 and stocks peaked in October 2007 (3 months later). Similarly, the 10-Year...
READ MORE
MEMBERS ONLY
Breadth Charts Updated
by Arthur Hill,
Chief Technical Strategist, TrendInvestorPro.com
-Six of the eight indicators are bearish
-Nasdaq breadth is bearish
-NYSE breadth is mixed
-Click here for the breadth charts page...
READ MORE
MEMBERS ONLY
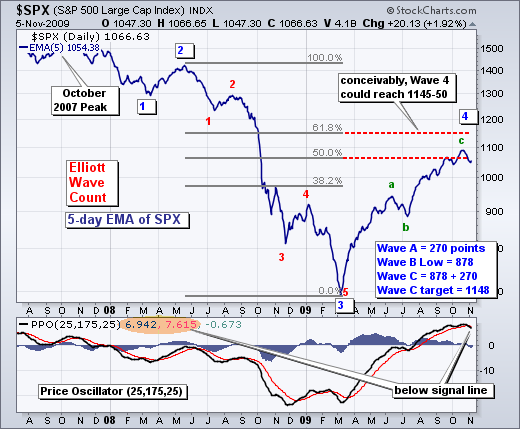
Elliott Counts for SPX and COMPQ
by Arthur Hill,
Chief Technical Strategist, TrendInvestorPro.com
The S&P 500 remains in a Wave 4 advance of a 5 Wave decline. I expect (think) Wave 4 will end in the 50-62% retracement zone and there are already signs of a reversal. Momentum is turning as the Percentage Price Oscillator (PPO) moved below its signal...
READ MORE
MEMBERS ONLY
Short-term Breakout Holds for SPY
by Arthur Hill,
Chief Technical Strategist, TrendInvestorPro.com
With a bounce over the last four days, MACD (5,35,5) crossed above its signal line on Thursday's close. Red dotted lines mark prior signals when MACD formed a bearish divergence AND crossed below its signal line. The last such signal occurred on October 21st. Green dotted...
READ MORE
MEMBERS ONLY

TECHNOLOGY AND CONSUMER DISCRETIONARY LEAD REBOUND - SEMICONDUCTOR ETF GETS OVERSOLD BOUNCE - NETWORKING ETF RECOVERS AFTER SUPPORT BREAK - QUALCOM AND CISCO LEAD NETWORKERS - SHANGHAI COMPOSITE RISING WITHIN WEDGE - KOSPI SHOWS RELATIVE WEAKNESS
by John Murphy,
Chief Technical Analyst, StockCharts.com
ECONOMIC REPORTS STOKE THE BULLS... Video Link (click here)
Selling pressure hit after the Feds policy statement yesterday, but the bulls were back in business on Thursday. It appears that a drop in initial jobless claims and a sharp increase in productivity sparked the bulls. Jobless claims decreased by 20,...
READ MORE
MEMBERS ONLY

CCI Signals for Jones Apparel
by Arthur Hill,
Chief Technical Strategist, TrendInvestorPro.com
On the Stockcharts.com scan page for Wednesday evening, there were 20 CCI sell signals among NYSE stocks. A CCI sell signal occurs with a plunge below -100. Conversely, a CCI buy signal triggers with a surge above +100. CCI for Jones Apparel (JNY) surged above +100 on July 23rd...
READ MORE
MEMBERS ONLY
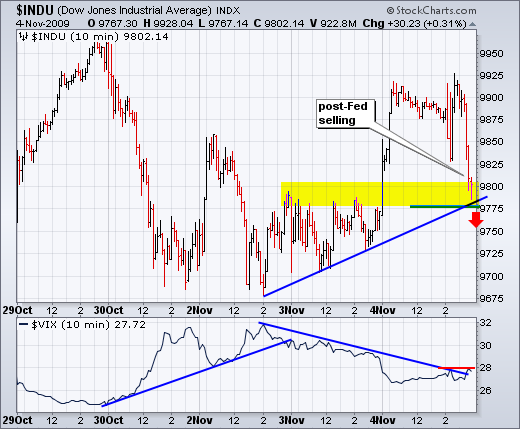
Another Post-Fed Sell Off
by Arthur Hill,
Chief Technical Strategist, TrendInvestorPro.com
While I don't like holding myself hostage to fundamental events, we need to be prepared for volatility when market-moving events hit the fan. Sometimes we can predict the news, such as the Fed policy statement remaining unchanged. Most of the time we cannot predict the news, such...
READ MORE
MEMBERS ONLY

STOCKS FAIL TO HOLD EARLY GAINS - THE BATTLE FOR SUPPORT - FINANCE SPDR CLOSES WEAK - UTILITIES SPDR TESTS SUPPORT - DOLLAR MOMENTUM REMAINS BEARISH - EURO ETF HOLDS 50-DAY LINE - INFLATION PROTECTED BONDS SHOW STRENGTH
by John Murphy,
Chief Technical Analyst, StockCharts.com
STOCKS ERASE EARLY GAINS... Video Link (click here) The Fed left rates and its policy statement unchanged. Stocks were up heading into the announcement and just after the announcement, but selling pressure drove the major indices lower in the final hour. Chart 1 shows the Major Indices Market Carpet without...
READ MORE
MEMBERS ONLY

Merck Propels XLV Higher
by Arthur Hill,
Chief Technical Strategist, TrendInvestorPro.com
With help from component Merck, the Healthcare SPDR (XLV) bounced off support around 28. The ETF established support here with reaction lows in early September, early October and now early November. It is safe to say that the trend is clearly up as long as this support level holds.
Click...
READ MORE
MEMBERS ONLY

Waiting on the Fed
by Arthur Hill,
Chief Technical Strategist, TrendInvestorPro.com
Objectively speaking, the medium-term uptrend in SPY remains in place. The ETF forged a higher high in October and has yet to break the early October low. After a sharp decline from 110 to 104, SPY firmed with a spinning top on Monday and a small white candlestick on...
READ MORE
MEMBERS ONLY

INDIAN CENTRAL BANK BUYS GOLD -- MORE MAY FOLLOW -- GOLD IS RISING FASTER THAN ALL GLOBAL CURRENCIES -- CENTRAL BANKERS MAY START TREATING GOLD LIKE NEW RESERVE CURRENCY
by John Murphy,
Chief Technical Analyst, StockCharts.com
GOLD SURGES TO NEW RECORD IN HEAVY TRADING... Gold prices surged today to the highest level in its long history. Chart 1 shows the streetTrack Gold ETF (GLD) surging the equivalent of $25 dollars to a new record high. The volume bars show that recent trading activity (including today'...
READ MORE
MEMBERS ONLY

QQQQ Turns Indecisive at Support
by Arthur Hill,
Chief Technical Strategist, TrendInvestorPro.com
After a sharp decline the prior two weeks, the Nasdaq 100 ETF (QQQQ) turned indecisive with a spinning top on Monday. This candlestick reflects a wide high-low range during the day, but little change from open to close. QQQQ surged above 41.5 in early trading, plunged below 40....
READ MORE
MEMBERS ONLY

MARKET INDEXES STILL TESTING OCTOBER LOW -- SO ARE FOREIGN ETFS -- CHIP DOWNGRADE WEIGHS ON MARKET AND OFFSETS BNI BOUNCE -- GOLD HITS RECORD HIGH AS DOLLAR TESTS 50-DAY AVERAGE
by John Murphy,
Chief Technical Analyst, StockCharts.com
GOLD HITS NEW RECORD HIGH... Gold prices have erupted to new record highs today. Chart 1 shows the streetTracks Gold ETF (GLD) breaking through its October highs today on rising volume. Chart 2 shows Silver iShares (SLV) bouncing off chart support at their late-September low and 50-day average....
READ MORE
MEMBERS ONLY
Today's video features...
by Arthur Hill,
Chief Technical Strategist, TrendInvestorPro.com
-A volatile week ahead
-Spinning tops and indecision
-QQQQ stalls at support
-DIA and SPY stall above support
-SPY remains in short-term downtrend
-KRE breaks support and XLF tests support
-XLB and XLI hit double top support
-BBY forms bullish falling wedge
-Bear flags/pennants for JWM, LTD, RL...
READ MORE
MEMBERS ONLY
Bear Flags and Support Tests
by Arthur Hill,
Chief Technical Strategist, TrendInvestorPro.com
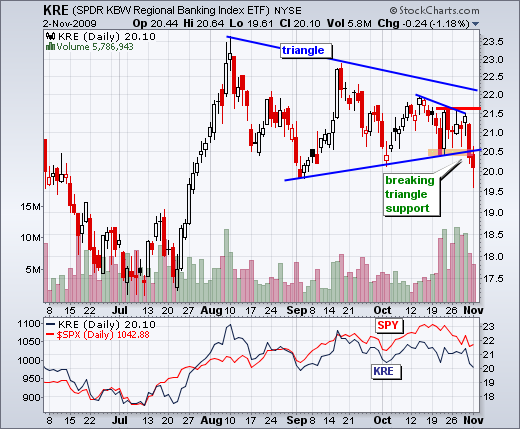
-KRE breaks support and XLF tests support
-XLB and XLI hit double top support
-BBY forms bullish falling wedge
-Bear flags/pennants for JWM, LTD, RL and SBUX
****************************************************************
Regional Bank ETF Breakdown
The Regional Bank SPDR (KRE) was showing some relative strength by holding above support last week. No more....
READ MORE
MEMBERS ONLY

SPY Unable to Bounce
by Arthur Hill,
Chief Technical Strategist, TrendInvestorPro.com
SPY formed a spinning top to signal indecision on Monday. Perhaps more importantly, the ETF surged above 105 in early trading and failed to hold these gains. The inability to hold early gains shows weakness. Buyers were not strong enough to hold gains. Sellers were strong enough to push prices...
READ MORE
MEMBERS ONLY
Preparing for a volatile week
by Arthur Hill,
Chief Technical Strategist, TrendInvestorPro.com
We can expect above average volatility this week. First, earnings season remains in full swing. Second, the Fed issues its policy statement on Wednesday at 2:15 PM ET. Third, the employment report will be released on Friday at 8:30 AM ET. In addition to these biggies, we have...
READ MORE
MEMBERS ONLY
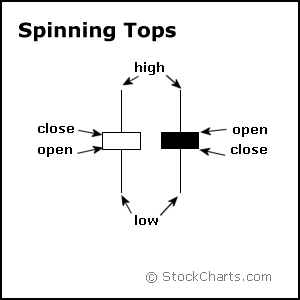
Spinning Tops for QQQQ-IWM-DIA
by Arthur Hill,
Chief Technical Strategist, TrendInvestorPro.com
-DIA forms spinning top and bull flag.
-QQQQ forms spinning top at support.
-IWM forms spinning top below support break.
On the daily charts, the major index ETFs finished with spinning top candlesticks on Monday. These show indecision that could foreshadow a short-term bounce. Spinning tops form when the...
READ MORE
MEMBERS ONLY
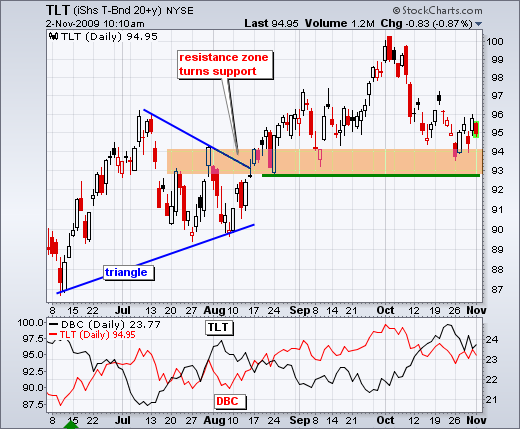
Bonds Fall As ISM Rises
by Arthur Hill,
Chief Technical Strategist, TrendInvestorPro.com
The 20+ Year Treasury ETF (TLT) bounced off support last week, but fell today as the ISM Manufacturing Survey surged to 55.7. Readings above 50 favor economic expansion. Bonds fell and the 10-Year Treasury Yield ($TNX) rose with this positive economic news. Signs of strength in the economy...
READ MORE
MEMBERS ONLY
Intermarket Charts Updated
by Arthur Hill,
Chief Technical Strategist, TrendInvestorPro.com
Highlights Include:
-Bonds and the Dollar surge as stocks fall
-Dollar forms small flag as RSI hits resistance
-Triangle support break for gold holds
-Bonds bounce off key support
-Click here for intermarket chart page...
READ MORE
MEMBERS ONLY

Palm Becomes Way Oversold
by Arthur Hill,
Chief Technical Strategist, TrendInvestorPro.com
With talk and release of the Pre, Palm was the talk of the town earlier this year. The stock tripled from its March low to its September high. October has been a rough month as PALM fell below 12 on Friday. While the chart shows a support break and close...
READ MORE
MEMBERS ONLY

Ford Tests Key Support
by Arthur Hill,
Chief Technical Strategist, TrendInvestorPro.com
Ford (F) beat earnings estimates this morning as the stock tests an important support area around 6.5-7. After breaking resistance with a big surge in July, the stock returned to broken resistance in September-October. Broken resistance turned into support with three bounces in the 6.5-7...
READ MORE
MEMBERS ONLY

SPY Becomes Oversold Again
by Arthur Hill,
Chief Technical Strategist, TrendInvestorPro.com
After a pretty good bounce on Thursday, stocks gave it all back with an even bigger decline on Friday. This kind of price action is not normal for a bull market or medium-term uptrend. First, Thursday's bounce only lasted one day. Second, the next day's...
READ MORE
MEMBERS ONLY

DOLLAR RISE HURTS STOCKS AND COMMODITIES -- STOCK VOLUME PATTERN TURNS NEGATIVE -- NASDAQ AND S&P 500 NEAR POINT & FIGURE SELL SIGNALS -- BEAR FUND TURNS UP
by John Murphy,
Chief Technical Analyst, StockCharts.com
DOLLAR BOUNCE HURTS COMMODITIES ... I wrote a week ago about the U.S. Dollar Index starting to bounce from major support formed in the spring of 2008 near 22 and an oversold condition. I warned that a dollar rally could unsettle stocks and commodities. Chart 1 shows this week'...
READ MORE
MEMBERS ONLY

FRIDAY'S STOCK PLUNGE WIPES OUT THURSDAY BOUNCE -- SEVERAL GROUPS HAVE COMPLETED DOUBLE TOPS -- AN IMPORTANT BREADTH INDICATOR WEAKENS -- WEEKLY CHART SHOWS S&P 500 UP STALLING NEAR MAJOR RESIS TANCE -- S&P 500 ENDS WEEK BELOW 50-DAY AVERAGE
by John Murphy,
Chief Technical Analyst, StockCharts.com
NO FRIDAY FOLLOW-THROUGH... Heading into Thursday, we had been warning about a downside correction in stocks and commodities (partially owing to a rebound in the oversold dollar). Thursday's stock rally muddied the water a bit. Friday's sharp price drop, however, erased all of the Thursday&...
READ MORE
MEMBERS ONLY

Broken Resistance Turns Support for GDX
by Arthur Hill,
Chief Technical Strategist, TrendInvestorPro.com
The Gold Miners ETF (GDX) is in for a big test as broken resistance turns into support. GDX broke resistance around 41-42 with a big surge in September. This level turned into support, and held, in early October. After a sharp decline the last two weeks, GDX is once...
READ MORE
MEMBERS ONLY

Breadth Starting to Break Down
by Arthur Hill,
Chief Technical Strategist, TrendInvestorPro.com
-Breadth chart page updated
-Short-Term SPY analysis in separate post below
-Medium-term evidence remains bullish, but....
-Wave 4 stalls for the S&P 500
-Nasdaq hits wave 4 resistance
-IWM breaks October low
-SPY holds above October low
-OBV shows increase in downside volume
-Nasdaq AD Line...
READ MORE
MEMBERS ONLY
Breadth Charts Updated
by Arthur Hill,
Chief Technical Strategist, TrendInvestorPro.com
The breadth chart page has been updated. There have been some changes with the sharp decline over the last two weeks. Highlights include:
-The Nasdaq AD Line broke below its early October low.
-Daily Net New Highs for the Nasdaq turned negative.
-The Nasdaq McClellan Oscillator plunged to its lowest...
READ MORE
MEMBERS ONLY

Dead-cat Bounce or More?
by Arthur Hill,
Chief Technical Strategist, TrendInvestorPro.com
After a 5% decline from the October high, the S&P 500 ETF (SPY) surged back above 106 on Thursday. Is this just a dead-cat bounce or should we expect more strength? Technically, the medium-term trend is still up. As such, a number of mean-reversion strategies...
READ MORE
