MEMBERS ONLY
Breadth Charts Updated

by Arthur Hill,
Chief Technical Strategist, TrendInvestorPro.com
The breadth chart page has been updated. There have been some changes with the sharp decline over the last two weeks. Highlights include:
-The Nasdaq AD Line broke below its early October low.
-Daily Net New Highs for the Nasdaq turned negative.
-The Nasdaq McClellan Oscillator plunged to its lowest...
READ MORE
MEMBERS ONLY

Dead-cat Bounce or More?
by Arthur Hill,
Chief Technical Strategist, TrendInvestorPro.com
After a 5% decline from the October high, the S&P 500 ETF (SPY) surged back above 106 on Thursday. Is this just a dead-cat bounce or should we expect more strength? Technically, the medium-term trend is still up. As such, a number of mean-reversion strategies...
READ MORE
MEMBERS ONLY

NY COMPOSITE AND NASDAQ REBOUND - FINANCE SECTOR LEADS - DOW THEORY REMAINS BULLISH - USING PRICE AND TIME FILTERS - PERCENT OF STOCKS ABOVE 50-DAY AVERAGE PLUNGES - BONDS TEST KEY SUPPORT

by John Murphy,
Chief Technical Analyst, StockCharts.com
NYSE LEADS REBOUND... Video Link (click here) The harder the fall, the bigger the rebound. After plunging below the 50-day moving average on Wednesday, the NY Composite managed to hold above its early October low with a sharp rebound on Thursday. As chart 1 shows, the string of higher...
READ MORE
MEMBERS ONLY

Bond Funds Outperform
by Arthur Hill,
Chief Technical Strategist, TrendInvestorPro.com
Even if you do not trade Fidelity Funds, the Fidelity Funds Carpet can be useful for providing an overview of market action. All stock index funds, domestic equity funds and international funds are down over the last 10 days (lots of red). The only green (gains) can be found in...
READ MORE
MEMBERS ONLY

KRE Shows Relative Strength
by Arthur Hill,
Chief Technical Strategist, TrendInvestorPro.com
I was quite impressed with the ability of the Regional Bank SPDR (KRE) to firm over the last few days. The S&P 500 is down around 4.5% in four days and KRE is down only 2.3%. The first chart shows KRE and the S&P...
READ MORE
MEMBERS ONLY
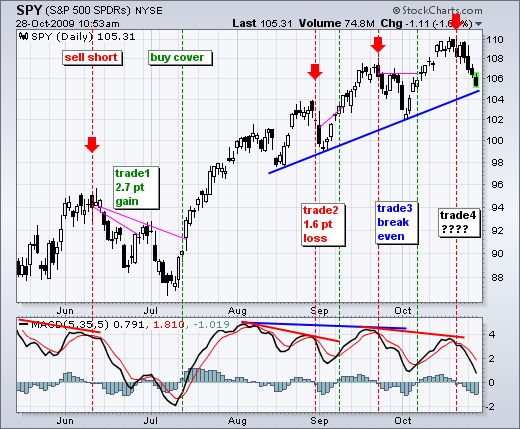
SPY Becomes Oversold and Nears Support
by Arthur Hill,
Chief Technical Strategist, TrendInvestorPro.com
The S&P 500 ETF (SPY) is now down over 5% in the last seven days. With the medium-term trend still technically up and the ETF oversold, traders should be on guard for a bounce or consolidation. Bouncing usually begin with indecision.
The orange highlights show indecisive candlesticks...
READ MORE
MEMBERS ONLY

BROAD DECLINE ROCKS WALL STREET - SPY TESTS 50-DAY - SMALL-CAPS LEAD LOWER - RUSSELL 2000 ETF FORMS DOUBLE TOP - XLB, XLI AND IYT ALSO FORM DOUBLE TOPS - EURO AND STOCKS FALL TOGETHER - DOLLAR ETF SURGES
by John Murphy,
Chief Technical Analyst, StockCharts.com
STOCKS DECLINE ON INCREASED VOLUME... Video Link (click here) Selling pressure picked up significantly on Wednesday. All of the major indices were down over 1% with the Russell 2000 leading the way lower (-3.51%). All sectors were lower with energy, finance and materials down over 3%. Declining stocks outnumbered...
READ MORE
MEMBERS ONLY
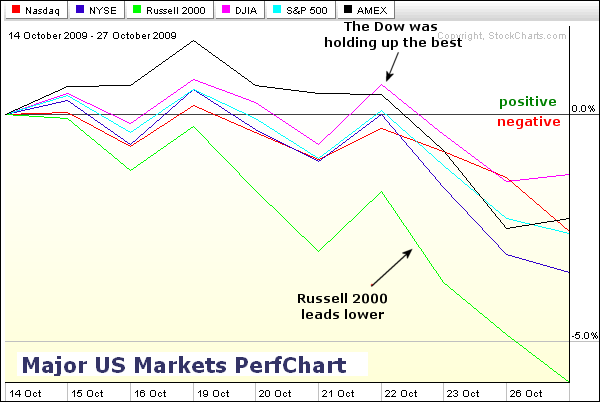
Small-caps Lead Decline
by Arthur Hill,
Chief Technical Strategist, TrendInvestorPro.com
The Major US Markets Perfchart shows the Russell 2000 ($RUT) leading the way lower over the last two weeks. Notice that the Russell 2000 has not even been positive (above 0%) over the last 10 days. In contrast, the other major indices were in positive territory at some point over...
READ MORE
MEMBERS ONLY
SPY Accellerates Lower
by Arthur Hill,
Chief Technical Strategist, TrendInvestorPro.com
Should the S&P 500 ETF (SPY) continue weak and close lower again today, it would mark the sixth lower close in the last eight days. Late September-early October was the last such occasion. With the ETF down around 4% from its highs, it is already getting short-...
READ MORE
MEMBERS ONLY
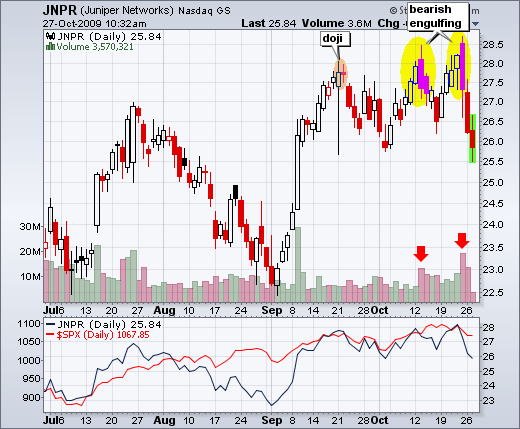
Bearish Engulfings Mark Resistance for JNPR
by Arthur Hill,
Chief Technical Strategist, TrendInvestorPro.com
Two big bearish engulfing patterns solidify resistance around 28-28.5 for Juniper Networks (JNPR). JNPR first established resistance at 28 with a doji. A few weeks later, the stock opened strong and closed weak to form its first high-volume bearish engulfing. After a pullback and second attempt at...
READ MORE
MEMBERS ONLY

IWM Lags-SMH retraces-KRE Holds Support
by Arthur Hill,
Chief Technical Strategist, TrendInvestorPro.com
-Intermarket chart page updated (here)
-Short-Term SPY analysis in separate post below
-Small-caps show relative weakness
-Regional Banks hold support
-Healthcare Providers ETF breaks support
-Cigna shows relative weakness
-Semiconductors HOLDRS pullback after higher high
-Intel turns indecisive at key retracement
-Texas Instruments forms triangle consolidation
-Click here...
READ MORE
MEMBERS ONLY
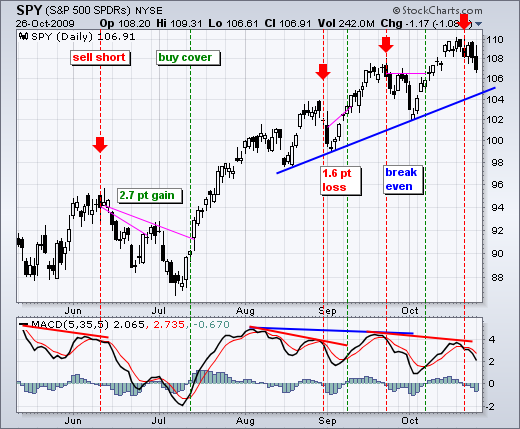
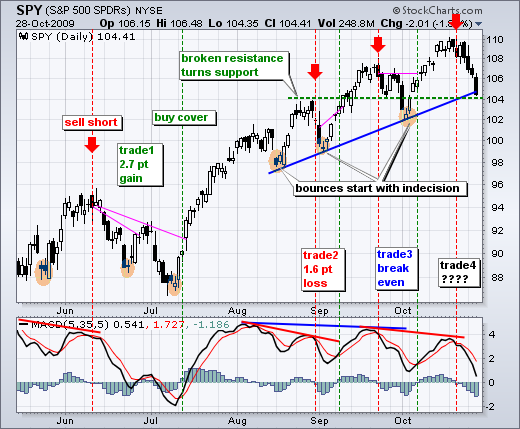
Setting Short-Term Resistance for SPY
by Arthur Hill,
Chief Technical Strategist, TrendInvestorPro.com
After a big surge in July, the S&P 500 ETF (SPY) has been zigzagging higher since early August. Consider the zigs as advances and the zags as declines. Each advance (zag) forges a higher high, while each decline (zig) reverses above its prior low. This series of higher...
READ MORE
MEMBERS ONLY
Intermarket Chart Page Updated
by Arthur Hill,
Chief Technical Strategist, TrendInvestorPro.com
Intermarket chart highlights include:
-Bonds plunge as Dollar bounces
-Dollar breaks short-term resistance as RSI approaches 50
-Gold breaks pennant/triangle support
-Oil declines as Dollar bounces
-Bonds test important support zone
Click here for the intermarket chart page....
READ MORE
MEMBERS ONLY

Email Alerts for Art's Charts
by Arthur Hill,
Chief Technical Strategist, TrendInvestorPro.com
The image below shows the email alert for, Tuesday, October 27th. Each email contains the titles and the opening sentences for the day's blog entries. Alerts are sent out once per day around 12PM ET. You can sign up for alerts with the "SUBSCRIBE BY EMAIL"...
READ MORE
MEMBERS ONLY

BANKS AND MATERIALS LEAD STOCKS LOWER -- BANK OF AMERICA IS ONE OF THE BIGGEST LOSERS -- OVERSOLD DOLLAR BOUNCES FROM 2008 LOWS -- THAT'S CAUSING NERVOUS PROFIT-TAKING IN STOCKS AND COMMODITIES
by John Murphy,
Chief Technical Analyst, StockCharts.com
BANK INDEX DROPS 3% ... A big drop in bank shares is pulling the financial sector lower today and the rest of the market with it. Chart 1 shows the PHLX Bank Index dropping well below its 50-day moving average. If those losses hold through the balance of the day,...
READ MORE
MEMBERS ONLY
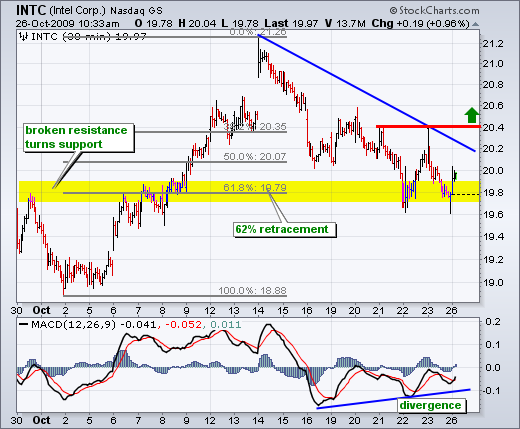
Intel Hits Support Zone
by Arthur Hill,
Chief Technical Strategist, TrendInvestorPro.com
After a decline the last eight days, Intel (INTC) is showing signs of firmness near a support zone. First, notice that the decline retraced 62% of the prior advance. Second, notice that broken resistance turns into support. Third, notice that MACD has a bullish divergence working. A break above 20....
READ MORE
MEMBERS ONLY

SPY Forms Lower Low (Short-Term)
by Arthur Hill,
Chief Technical Strategist, TrendInvestorPro.com
This is just a quick update on the short-term trend for SPY and last week's MACD signal. On the daily chart, MACD(5,35,5) formed a bearish divergence and moved below its signal line last Wednesday for a bearish signal. MACD remains below its signal line,...
READ MORE
MEMBERS ONLY

PLUNGE IN RAILROADS THREATENS DOW THEORY UPTREND -- FALLING CHIP STOCKS FORM ANOTHER NEGATIVE DIVERGENCE AS SOX WEAKENS -- NASDAQ COMPOSITE IS UP AGAINST MAJOR RESISTANCE NEAR 2200
by John Murphy,
Chief Technical Analyst, StockCharts.com
TRANSPORTS FAIL TEST OF SEPEMBER PEAK ... On Monday, I wrote a brief update on the Dow Theory which holds that the Dow Industrials and Transports need to both hit new highs to keep the current uptrend intact. Although the Industrials had already done so, I showed the Dow Transports still...
READ MORE
MEMBERS ONLY
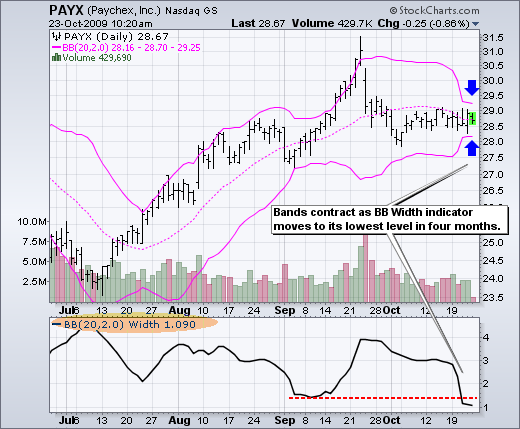
Bollinger Band Contraction for PAYX
by Arthur Hill,
Chief Technical Strategist, TrendInvestorPro.com
The Bollinger Bands are contracting as Paychex (PAYX) trades within a narrow range this month. First, you can see the bands narrowing significantly this week (blue arrows). Second, the Bollinger Band Width indicator is trading at its lowest level in over four months. A volatility expansion often follows a volatility...
READ MORE
MEMBERS ONLY
Cracks Starting to Appear
by Arthur Hill,
Chief Technical Strategist, TrendInvestorPro.com
-Bulk of the evidence remains bullish
-Weak upside breadth on Monday and Thursday
-SPY and IWM reverse short-term uptrends
-A MACD(5,35,5) signal for SPY
-SPY remains in Wave 4 target zone
-NYSE AD Volume Line does not confirm
-Nasdaq AD Line fails to exceed September high...
READ MORE
MEMBERS ONLY

SETTING A SHORT-TERM BEAR TRAP - REGIONAL BANK ETF RECOVERS BIG TIME - XLF LEADS SECTORS HIGHER - THE PANIC PHASE OF A BEAR MARKET - SPY NEARS 62% RETRACEMENT MARK - MAJOR INDEX ETFS REMAIN IN MEDIUM-TERM UPTRENDS
by John Murphy,
Chief Technical Analyst, StockCharts.com
SPRINGING THE BEAR TRAP... Video Link (click here) Fighting the bigger trend is a dangerous game. With a sharp sell-off in the final hour on Wednesday, the S&P 500 ETF (SPY) broke below its prior low to reverse the short-term uptrend. This support break did not...
READ MORE
MEMBERS ONLY
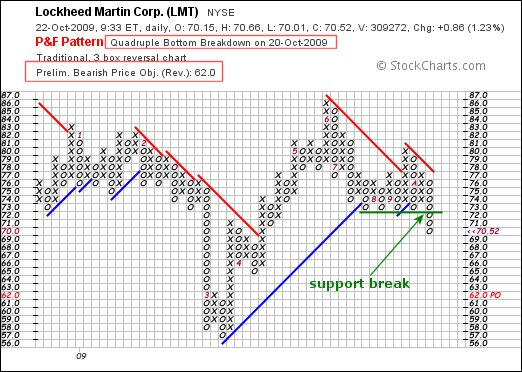
LMT Breaks Support on P&F Chart
by Arthur Hill,
Chief Technical Strategist, TrendInvestorPro.com
Looking across the P&F scan page on Thursday, I came across Lockheed Martin (LMT) with a quadruple bottom breakdown. Actually, this is a quintuple bottom break down. After four bounces off support, LMT broke through on the fifth try. Based on traditional P&F targeting, the downside...
READ MORE
MEMBERS ONLY

SMALL-CAPS LEAD LATE SELL-OFF - SPY BREAKS SHORT-TERM SUPPORT - FINANCE LEADS SECTORS LOWER - REGIONAL BANKS SHOW RELATIVE WEAKNESS - OCTOBER HAS BEEN GOOD FOR COMMODITIES - AGRICULTURE AND BASE METALS ETFS BREAK RESISTANCE - DOLLAR HITS ANOTHER NEW LOW
by John Murphy,
Chief Technical Analyst, StockCharts.com
STOCKS FAIL HOLD GAINS... Video Link (click here) Stocks opened strong with positive reactions to earnings from Morgan Stanley, US Bancorp and Yahoo!. However, these gains proved fleeting as selling pressure hit hard in the final hour of trading. Small-caps led the way lower with the Russell 2000 ETF...
READ MORE
MEMBERS ONLY
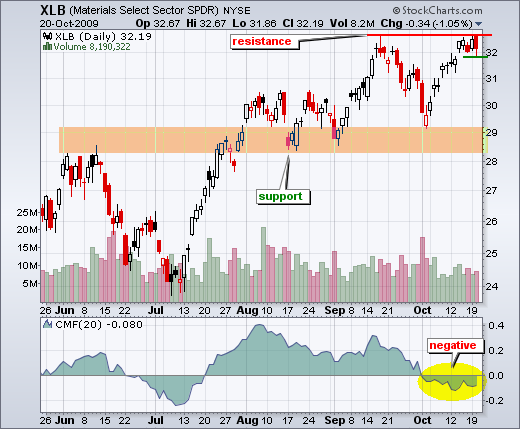
Negative Money Flow for XLB
by Arthur Hill,
Chief Technical Strategist, TrendInvestorPro.com
Even though the Materials SPDR (XLB) is challenging resistance from the September highs, Chaikin Money Flow remains in negative territory. In fact, CMF has been negative throughout October. This shows underlying weakness in the current advance. With XLB stalling near its September highs the last five days, a break below...
READ MORE
MEMBERS ONLY
Intermarket Chart Page Updated
by Arthur Hill,
Chief Technical Strategist, TrendInvestorPro.com
-Stocks and the Dollar remain inversely correlated.
-Short-term interest rates are edging higher and this could lift the Dollar.
-Gold remains at high levels as the breakouts hold.
-Broken resistance turns into support for oil.
-Bonds bounced off a key support zone.
-Click here to view the charts....
READ MORE
MEMBERS ONLY

APPLE TESTS OLD HIGH -- MARKET IS LOSING HOUSING AND REIT SUPPORT -- CONSUMER DISCRETIONARY/STAPLES RATIO IS STARTING TO WEAKEN WHICH SHOWS MORE CAUTION -- HERSHEY FOODS RISES WHILE SHERWIN WILLIAMS TUMBLES
by John Murphy,
Chief Technical Analyst, StockCharts.com
APPLE GAINS 5% BUT REACHES RESISTANCE... Apple shares have gapped 5% higher today. Upside volume over the last two days has been exceptional. That's given a boost to the technology sector. There is one caveat, however, that you should at least be are of. Apple is testing its...
READ MORE
MEMBERS ONLY

A big Support Test for KB Home
by Arthur Hill,
Chief Technical Strategist, TrendInvestorPro.com
A number of chart features are coming together to mark support around 15 for KB Home (KBH). First, the decline retraced 62% of the prior advance. Second, broken resistance turns into support. Third, the stock firmed the last three weeks. The only remaining wild card is the direction of the...
READ MORE
MEMBERS ONLY

MT Bullish, But ST Overbought
by Arthur Hill,
Chief Technical Strategist, TrendInvestorPro.com
-Bulk of the evidence remains bullish
-IWM leads the pack
-SPY extends short-term uptrend
-Past MACD divergences in SPY
-MACD diverges for QQQQ
-Autozone (AZO) firms at support
-Oracle (ORCL) recovers after sharp decline
-Qualcom (QCOM) bounces after hammer
-Comcast (CMCSA) firms after sharp decline
-Nvdia (NVDA) retraces 50%...
READ MORE
MEMBERS ONLY

STOCKS AND COMMODITIES CONTINUE RALLY AS DOLLAR DROPS -- COPPER JUMPS 4% AS CHINESE ETFS HIT NEW HIGHS -- DOW NEARS 50% RETRACEMENT POINT NEAR 10,500
by John Murphy,
Chief Technical Analyst, StockCharts.com
COMMODITIES CONTINUE BULL RUN ... The dollar is dropping again and commodities are rising. Chart 1 shows the DB Commodities Tracking Index (DBC) exceeding its early August high after completing a bullish symmetrical triangle. Most commodities are joining the rally. Chart 2 shows the United States Oil Fund (USO) having also...
READ MORE
MEMBERS ONLY

DOW THEORY UPDATE -- DOW TRANSPORTS ARE TESTING SEPTEMBER HIGHS -- UPSIDE LEADERS ARE RYDER AND OVERSEAS SHIPBUILDING -- UTILITIES ARE ALSO CLOSE TO BREAKING OUT -- UTILITY LEADERS ARE PG&E AND SOUTHERN COMPANY -- ELY LILLY BREAKS RESISTANCE LINE
by John Murphy,
Chief Technical Analyst, StockCharts.com
DOW THEORY UPDATE ... One of our readers asked for an update on Dow Theory. Just to refresh your memory, Dow Theory holds that the Dow Industrials and Transports must both hit new highs to confirm an ongoing uptrend. Chart 1 shows the Dow Industrials having already done so. Chart 2...
READ MORE
MEMBERS ONLY

Volume By Price Resistance for the Dow
by Arthur Hill,
Chief Technical Strategist, TrendInvestorPro.com
Much has been make about Dow 10,000 this week, but technicians may want to focus about 500 points higher instead. The chart below shows Volume-by-Price for the Dow Industrials. Notice that the longest bar is around 10500-11000. This represents a potential resistance zone in the coming...
READ MORE
MEMBERS ONLY
SAFETY FIRST

by Tom Bowley,
Chief Market Strategist, EarningsBeats.com
It's very easy to get caught up in the euphoria of this market run. I'd be careful to do that. Invested Central turned from aggressively optimistic to cautiously bullish in early May and we've maintained that more cautious stance since. Call us conservative if...
READ MORE
MEMBERS ONLY

OIL ETF BACK ON BUY SIGNAL

by Carl Swenlin,
President and Founder, DecisionPoint.com
In my September 25 article I headlined the fact that the Oil ETF (USO) had generated convincing sell signal, so I think it is appropriate to report that the signal has recently turned to a buy. Below is the chart from the 9/25 article showing the breakdown from the...
READ MORE
MEMBERS ONLY
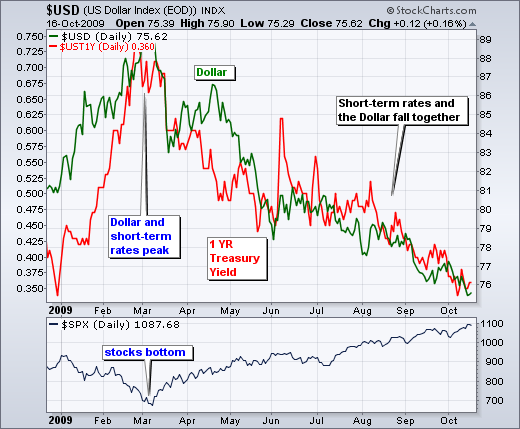
SHORT-TERM RATES AND THE DOLLAR
by Arthur Hill,
Chief Technical Strategist, TrendInvestorPro.com
While there has been a negative correlation between the Dollar and stocks this year, there has been a positive correlation between the Dollar and short-term interest rates. The chart below shows the US Dollar Index ($USD) with the 1-Year Treasury Yield ($UST1Y). Both rose in January-February and...
READ MORE
MEMBERS ONLY
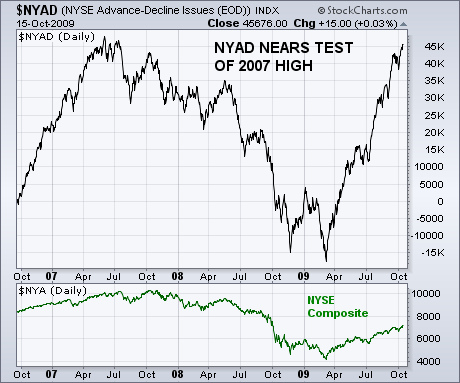
NYSE AD LINE NEARS 2007 HIGH
by John Murphy,
Chief Technical Analyst, StockCharts.com
NYSE ADVANCE-DECLINE LINE NEARS OLD HIGH ... One of our readers asked for a look at the NYSE Advance-Decline line, and this may be a good time to start keeping an eye on it. Chart 7 shows the NYAD nearing a test of its 2007 peak. What's...
READ MORE
MEMBERS ONLY
INTERNET CONNECTION AND DATAFEED UPGRADE REPORTS
Internet Connectivity Upgrade Progress Report:
On Monday night we moved our site traffic off of our old 180 megabit T3 connections and back onto the gigabit Fiber connection. Later we ran a test of our new automatic failover configuration by physically disconnecting the fiber cable from its router and we...
READ MORE
MEMBERS ONLY

TECHNICAL ANALYSIS 101 - PART 14
This is the next part of a series of articles about Technical Analysis from a new course we're developing. If you are new to charting, these articles will give you the "big picture" behind the charts on our site. if you are an "old hand&...
READ MORE
MEMBERS ONLY

CONSUMER STAPLES START TO ATTRACT NEW MONEY -- THAT SUGGESTS INVESTORS ARE LOOKING FOR DEFENSE OR VALUE -- WEEKLY LEADERS INCLUDE SUPERVALU, KROGER, SAFEWAY, AND SYSCO -- NYSE AD LINE NEARS 2007 HIGH
by John Murphy,
Chief Technical Analyst, StockCharts.com
CONSUMER STAPLES SHOW SOME STRENGTH ... For the first time since March, consumer staples are starting to show some market leadership. They were the strongest group on Friday, the third strongest on the week, and second strongest of the last month (behind energy). Chart 1 shows the Consumer Staples SPDR (XLP)...
READ MORE
MEMBERS ONLY

Best Buy Hits a Ceiling
by Arthur Hill,
Chief Technical Strategist, TrendInvestorPro.com
Point&Figure charts are great for showing support and resistance. Best Buy (BBY) hit a ceiling at 42 over the last five months. A breakout above resistance (another "X") would trigger a bullish signal and target further strength towards the next resistance level at 48.
Click this...
READ MORE
MEMBERS ONLY

New Highs Affirm Uptrend for Stocks
by Arthur Hill,
Chief Technical Strategist, TrendInvestorPro.com
-Bulk of the evidence remains bullish
-SPY surges to new highs in October
-S&P 500 enters retracement zone on weekly chart
-NYSE AD Line hits new high
-VIX moves to new low
-MACD stays bullish despite divergences
-Russell 2000 and S&P 100 exceed September highs
-Bullish...
READ MORE
