MEMBERS ONLY

OIL ETF BREAKS TRIANGLE - GASOLINE SURGES TO RESISTANCE - AGRICULTURE ETF BREAKS OUT - INDUSTRIAL METALS ETF CHALLENGES RESISTANCE - COMPARING ETFS AND THE UNDERLYING - HEALTHCARE SPDR AFFIRMS UPTREND - STOCKS TO WATCH (LLY, PFE, AMGN, MDT)

by John Murphy,
Chief Technical Analyst, StockCharts.com
OIL ETF BREAKS TRIANGLE... Video Link (click here) John Murphy showed a symmetrical triangle pattern in the US Oil Fund ETF (USO) on Monday. John also said, an eventual upside breakout is likely. Chart 1 shows USO breaking above triangle resistance with a big move today. A report showing a...
READ MORE
MEMBERS ONLY

Inter-market Leaders for 2009

by Arthur Hill,
Chief Technical Strategist, TrendInvestorPro.com
With the Dow hitting 10,000 on Wednesday, it is a good time to check the intermarket PerfChart for 2009. West Texas Intermediate ($WTIC) is by far the biggest winner this year with a gain around 55%. Gold-Continuous Futures ($GOLD) is up around 24% and the Dow is up...
READ MORE
MEMBERS ONLY

SMALL-CAPS LEAD BROAD RALLY - JP MORGAN POWERS THE FINANCE SECTOR - XLF BREAKS SEPTEMBER HIGH - JPM-BAC-WFC-USB LEAD FINANCE SECTOR - INTEL LIFTS THE SEMIS - SMH BREAKS RESISTANCE - RISK-ON TRADE REMAINS AS DOW HITS 10K AND DOLLAR HITS NEW LOW
by John Murphy,
Chief Technical Analyst, StockCharts.com
SMALL-CAPS LEAD BROAD RALLY... Video Link (click here) The Russell 2000 and the NY Composite led the major indices on Wednesday. All of the major indices were up on the day, but the Russell 2000 and NY Composite were the only two to gain 2%. Chalk it up to...
READ MORE
MEMBERS ONLY
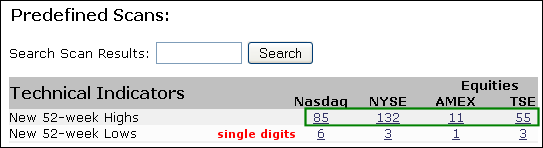
Net Highs Outpacing New Lows
by Arthur Hill,
Chief Technical Strategist, TrendInvestorPro.com
The top of the predefined scan page says it all. New 52-week highs are outpacing new 52-week lows, by a wide margin. In fact, new 52-week lows are in the single digits for all four exchanges shown on the table. No sign of weakness here.
Click this...
READ MORE
MEMBERS ONLY
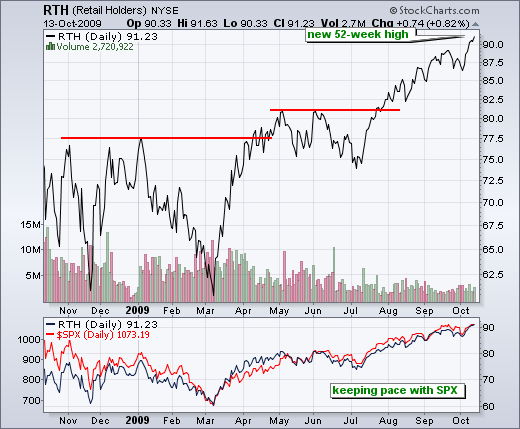
Retail HOLDRS Forge New High
by Arthur Hill,
Chief Technical Strategist, TrendInvestorPro.com
The Retail HOLDRS (RTH) continues its up trend with another 52-week high on Tuesday. The chart below shows prices over the last 12 months and Tuesday's close in the highest. In the indicator window, notice that RTH is keeping pace with the S&P 500 (red...
READ MORE
MEMBERS ONLY

ANSWERS TO P&F QUESTIONS -- THE FIRST SIGNAL IS ALWAYS THE BEST ONE -- TRY PERCENTAGE SCALES WHEN THERE ARE DISCREPANCIES -- THE DOLLAR HAS NO LONG-TERM LINK TO STOCKS -- CORPORATE BONDS DO
by John Murphy,
Chief Technical Analyst, StockCharts.com
THE FIRST SIGNAL IS ALWAYS THE BEST ONE... Chart 1 is the point & figure chart of the S&P 500 that I posted on Friday to show that its trend is still upward, and made mention of the buy signal given at 935 during July. One of our...
READ MORE
MEMBERS ONLY

Semis Lead as SPY Hits Sept Highs
by Arthur Hill,
Chief Technical Strategist, TrendInvestorPro.com
-SPY forms doji near September highs
-Short-term uptrend remains in place for SPY
-Treasury yields surge over the last two days
-Dollar ETF forms doji near September lows
-Homebuilders SPDR bounces off support
-Regional Bank SPDR breaks channel resistance
-Transport iShares hits retracement zone
-REIT iShares edges above channel...
READ MORE
MEMBERS ONLY

Bonds Drop Sharply
by Arthur Hill,
Chief Technical Strategist, TrendInvestorPro.com
The intermarket chart below shows bonds (blue line) taking a hit last week. The 30-year Treasury Bond ($USB) fell back toward support from its September lows. Weakness in bonds is understandable with West Texas Intermediate ($WTIC) challenging its summer highs. Click here for John Murphy's Intermarket Perfchart....
READ MORE
MEMBERS ONLY

OIL SERVICE STOCKS LEAD STRONG ENERGY COMPLEX TO 52-WEEK HIGHS -- CHEVRON BREAKS OUT -- CRUDE OIL AND NATURAL GAS ARE TESTING IMPORTANT RESISTANCE LINES AND APPEAR TO BE HEADED HIGHER
by John Murphy,
Chief Technical Analyst, StockCharts.com
OIL SERVICE BREAKOUTS ... With energy prices on the rise, stocks in the energy patch have become market leaders. That's certainly the case today. While energy is the day's top sector, oil service is the top energy industry group. Chart 1 shows Oil Service Holders rising to...
READ MORE
MEMBERS ONLY

A POINT & FIGURE VIEW OF CURRENT MARKETS SHOW UPTREND STILL INTACT -- GOLD STOCKS ARE RISING FASTER THAN BULLION -- DOLLAR AND VIX STILL IN DOWNTRENDS -- RISING TIPS MATCH JUMP IN COMMODITIES -- CORPORATE BONDS SELLOFF
by John Murphy,
Chief Technical Analyst, StockCharts.com
STOCK TREND IS STILL UPWARD ... A rebound in global stock markets this week has kept the seven-month uptrend intact. On Monday, I showed major stock indexes bouncing off their 50-day moving averages. The only potential negative is that trading activity on the way up was less than it...
READ MORE
MEMBERS ONLY
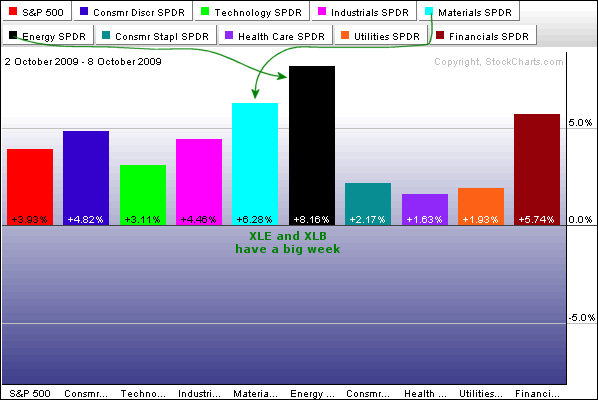
Materials and Energy Score Big
by Arthur Hill,
Chief Technical Strategist, TrendInvestorPro.com
The Energy SPDR (XLE) and the Materials SPDR (XLB) started October with a bang. Over the last five days, XLE is up over 8% and XLB is up over 6%. The Financials SPDR (XLF) comes in a close second with a 5.74% gain. All three easily outperformed the S&...
READ MORE
MEMBERS ONLY
Stocks Stall as Dollar Tests Prior Low
by Arthur Hill,
Chief Technical Strategist, TrendInvestorPro.com
-Medium-term evidence remains bullishfor stocks
-SPY turns indecisive after sharp advance
-Using CCI for short-term signals in SPY
-Another bottom picking opp in the Dollar
-Oil advances to channel resistance
-Gold becomes overbought as GLD assets surge
-Bonds feel the heat of rising commodity prices
-Click here for...
READ MORE
MEMBERS ONLY

ENERGY SECTOR LEADS HIGHER - ALCOA POWER MATERIALS SECTOR - FILLED VERSUS HOLLOW CANDLESTICKS - PRECIOUS METALS LEAD COMMODITY GROUPS - INDUSTRIAL METALS AND ENERGY INDICES REMAIN RANGE BOUND
by John Murphy,
Chief Technical Analyst, StockCharts.com
ENERGY STOCKS SURGE... Video Link (click here) With oil moving back above $70, energy stocks advanced sharply and led all sectors on Thursday. Chart 1 shows the Energy SPDR (XLE) challenging its September high. After a pullback in late September, XLE found support near the early September gap and surged...
READ MORE
MEMBERS ONLY
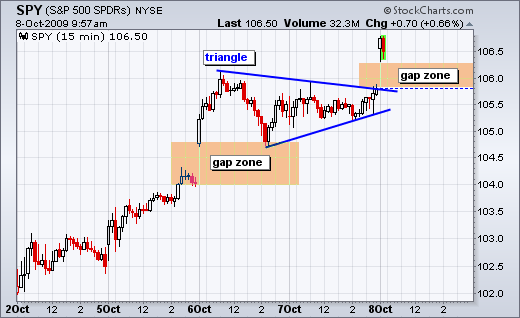
SPY Gaps Higher
by Arthur Hill,
Chief Technical Strategist, TrendInvestorPro.com
SPY is at it again with its second gap this week. The ETF gapped higher on Tuesday and held the gap zone. After a triangle consolidation, SPY gapped above 106 this morning to create another gap zone that marks first support.
Click this image for more details....
READ MORE
MEMBERS ONLY

STOCKS STALL WITH MIXED TRADING - FINANCE SECTOR LEADS - REGIONAL BANKS LAG - HOMEBUILDERS CONTINUE TO SHOW RELATIVE WEAKNESS - REIT ISHARES RETURN TO BREAKOUT - SHORT-TERM RATES POSITIVELY CORRELATED TO THE DOLLAR
by John Murphy,
Chief Technical Analyst, StockCharts.com
STOCKS STALL IN MIXED ACTION... Video Link (click here) Trading was mixed on Wednesday as the major indices meandered on either side of unchanged. Chart 1 shows the Dow finishing virtually unchanged with an indecisive candlestick. After two sharp gains on Monday and Tuesday, a little indecision is understandable. Overall,...
READ MORE
MEMBERS ONLY

XLE Zigzags Higher
by Arthur Hill,
Chief Technical Strategist, TrendInvestorPro.com
The chart below shows the Energy SPDR (XLE) with a 5% Zigzag. This indicator filters out smaller fluctuations by only identifying moves of at least 5%. XLE is currently zigzagging up with higher highs and higher lows. A break below the October low would reverse this uptrend.
Click this image...
READ MORE
MEMBERS ONLY

HIKE IN AUSSIE RATES GIVES BIG BOOST TO GLOBAL STOCKS AND COMMODITIES -- GOLD HITS RECORD HIGH -- COAL STOCKS HELP LEAD ENERGY RALLY
by John Murphy,
Chief Technical Analyst, StockCharts.com
AUSSIE DOLLAR HITS 52-WEEK HIGH ... The Australian central bank lifted its short-term interest rate 25 basis points to 3.25% from the lowest level in nearly half a century. It was the first G-20 country to do so. Global stocks and commodities rallied sharply on the view...
READ MORE
MEMBERS ONLY

Yield Curve Remains Positive
by Arthur Hill,
Chief Technical Strategist, TrendInvestorPro.com
With short-term rates near zero and long-term rates around 4%, the yield curve is clearly positive. This sharply positive slope reflects loose monetary policy at the Fed that is designed to stimulate the economy. For reference, the yield curve was flat in October 2007 as short-term rates...
READ MORE
MEMBERS ONLY

Setting Up for a Short-term Low
by Arthur Hill,
Chief Technical Strategist, TrendInvestorPro.com
-Attempting a short-term low
-Setting short-term support for SPY
-Low Volume the last two Mondays
-Finance Sector Leads
-Regional Banks Lag
-Gold Miners ETF bounces off support
-AMAT forms hammer at support
-BG firms near key retracement
-CPWR forms bullish engulfing at support
-INTU maintains bullish bias
-NEM...
READ MORE
MEMBERS ONLY

Financials Light up Market Carpet
by Arthur Hill,
Chief Technical Strategist, TrendInvestorPro.com
The Financial sector lit up the Market Carpet on Monday with the most green. Three of the top five gainers came from the Financial sector. The consumer discretionary sector was second with two of the top five gainers on Monday.
Click this chart for more details....
READ MORE
MEMBERS ONLY

PRECIOUS METAL AND ENERGY STOCKS LEAD MONDAY RALLY -- SO DO NATURAL GAS STOCKS -- STOCK INDEXES BOUNCE OFF 50-DAY LINES BUT ON LIGHTER VOLUME
by John Murphy,
Chief Technical Analyst, StockCharts.com
FALLING DOLLAR HELPS... A falling dollar is giving boost to stocks and commodities on Monday. Gold stocks are the one of the day's top groups. The reason is a jump in gold and silver prices. Chart 1 shows the streetTrack Gold Trust ETF (GLD) climbing the equivalent of...
READ MORE
MEMBERS ONLY
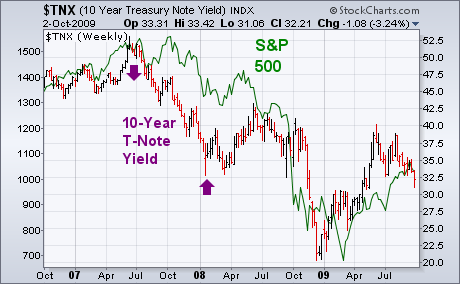
BREAKDOWN IN BOND YIELD MAY BE BAD FOR STOCKS
by John Murphy,
Chief Technical Analyst, StockCharts.com
One of the catalysts behind Thursdays heavy stock selling was the breakdown in Treasury bond yields. The 10-Year T-note yield fell below its July low to the lowest level in more than four months. Bond yields are an indicator of confidence in the economy. When investors are optimistic,...
READ MORE
MEMBERS ONLY
Major Indices Hit Major Resistance and Fail

by Tom Bowley,
Chief Market Strategist, EarningsBeats.com
I've cautioned recently about the risks of being long in the market. There were too many warning signs. Yes, the market could have kept its head down and pushed to higher levels. But that wouldn't have been the healthy way to extend the recent uptrend. Many...
READ MORE
MEMBERS ONLY
COMPLACENCY IN THE MARKETS

by Richard Rhodes,
Founder and President, Rhodes Capital Management and Rhodes Trading Group
Complacency, complacency and more complacency. While the media worries about a correction in the strong cyclical bull market, they should quite simply be considering whether or not the cyclical bull has indeed topped out and a cyclical bear market has begun. This is the nature of higher prices; market participants...
READ MORE
MEMBERS ONLY
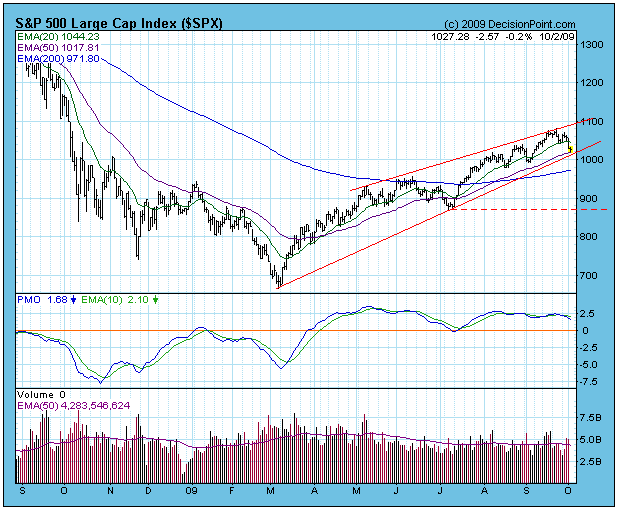
SUPPORT STILL HOLDS CORRECTING PRICES

by Carl Swenlin,
President and Founder, DecisionPoint.com
The market has begun another correction, but so far no serious technical damage has been done. The S&P 500 remains within the grasp of an ascending wedge formation, the dominant feature on the daily chart. On Friday prices hit their lowest level of the correction, but they remained...
READ MORE
MEMBERS ONLY
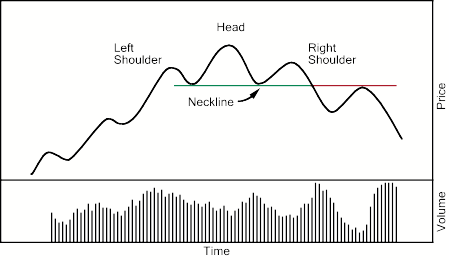
TECHNICAL ANALYSIS 101 - PART 13
This is the next part of a series of articles about Technical Analysis from a new course we're developing. If you are new to charting, these articles will give you the "big picture" behind the charts on our site. if you are an "old hand&...
READ MORE
MEMBERS ONLY

BREAKDOWN IN BOND YIELD MAY BE BAD FOR STOCKS
by John Murphy,
Chief Technical Analyst, StockCharts.com
One of the catalysts behind Thursdays heavy stock selling was the breakdown in Treasury bond yields. The 10-Year T-note yield fell below its July low to the lowest level in more than four months. Bond yields are an indicator of confidence in the economy. When investors are optimistic,...
READ MORE
MEMBERS ONLY
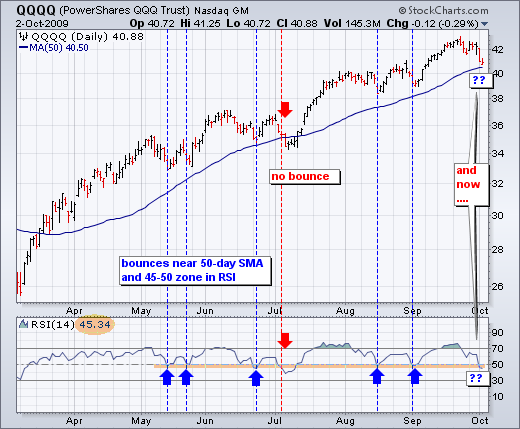
QQQQ Tests the 50-day
by Arthur Hill,
Chief Technical Strategist, TrendInvestorPro.com
With a sharp decline over the last eight days, the Nasdaq 100 ETF (QQQQ) is testing support from the rising 50-day moving average and RSI is testing support around 45-50. QQQQ broke the 50-day moving average briefly in July, but held the 50-day during the May,...
READ MORE
MEMBERS ONLY

TREASURY BONDS SIGNAL MORE CAUTION ON THE ECONOMY -- INVESTORS MAY START FAVORING SAFER TREASURIES OVER RISKIER JUNK BONDS -- MORE ON MACD LINES -- % NYSE STOCKS OVER 50-DAY AVG WEAKENS -- ABBOTT LABS TOP HEALTH CARE GAINER
by John Murphy,
Chief Technical Analyst, StockCharts.com
BREAKDOWN IN BOND YIELD MAY BE BAD FOR STOCKS ... One of the catalysts behind Thursdays heavy stock selling was the breakdown in Treasury bond yields. The 10-Year T-note yield fell below its July low to the lowest level in more than four months. Bond yields are an indicator...
READ MORE
MEMBERS ONLY

Dow Tests 50-day Moving Average
by Arthur Hill,
Chief Technical Strategist, TrendInvestorPro.com
With a sharp decline the last seven days, the Dow Industrials is testing is 50-day moving average, which is currently at 9457. This is the first test of the moving average since the Dow surged in mid July.
Click this chart for details....
READ MORE
MEMBERS ONLY

Make-or-Break Time for Key Indicators
by Arthur Hill,
Chief Technical Strategist, TrendInvestorPro.com
-Medium-term evidence remains bullish
-Wave 4 Hits the 50% Retracement
-Key Supports for SPY, QQQQ and IWM
-SPY is Already Short-term Oversold
-Volatility Indices Surge to Resistance
-Momentum Indicators Remain Bullish Overall
-McClellan Oscillators Turn Bearish
-Stocks and Bonds Disconnect
-China and Japan Lag
-Stocks: ADSK, AMZN, ANF,...
READ MORE
MEMBERS ONLY

STOCKS FALL SHARPLY ON INCREASING VOLUME - FINANCIALS LEAD LOWER - RETRACEMENT CLUSTERS MARK RESISTANCE FOR KEY SECTORS - DOLLAR SURGES AS STOCKS DECLINE - GOLD FOLLOWS EURO LOWER - BONDS BENEFIT FROM WEAKNESS IN STOCKS
by John Murphy,
Chief Technical Analyst, StockCharts.com
SELLING PRESSURE INTENSIFIES... Video Link (click here) Wall Street was hit with heavy selling pressure ahead of Fridays employment report. All major indices were down over 2%. Small-caps led the way with the Russell 2000 lost over 3%. All nine sectors were down with the Materials SPDR losing almost...
READ MORE
MEMBERS ONLY
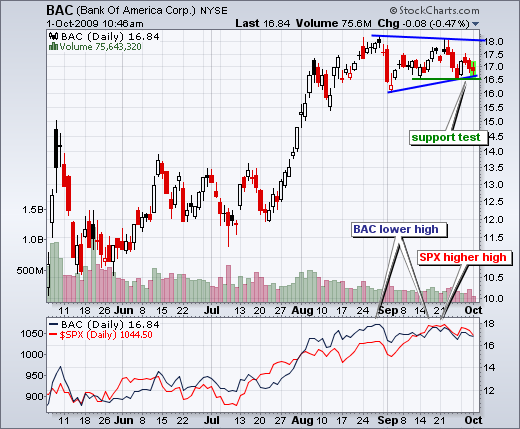
BAC Tests Support
by Arthur Hill,
Chief Technical Strategist, TrendInvestorPro.com
Bank of America (BAC) is testing support around 16.5 as the stock starts showing relative weakness. Support around 16.5 stems from the mid September lows and triangle trendline. BAC shows relative weakness because the stock failed to exceed its August high, but the S&P 500 formed...
READ MORE
MEMBERS ONLY

DOW CHOPS LOWER - VIX SURGES AND STAYS ELEVATED - VOLATILITY AND STOCK MARKET REMAIN INVERSELY CORRELATED - DEFENSIVE SECTORS PERKING UP - OIL SURGES AS GAS INVENTORIES CONTRACT - GOLD AND METALS ALSO BOUNCE
by John Murphy,
Chief Technical Analyst, StockCharts.com
VOLATILITY REIGNS SUPREME... Video Link (click here) For the second time in six days, the stock market plunged and recovered - though todays plunge-recovery was much quicker than the previous. Chart 1 shows the Dow Industrials plunging after the FOMC policy statement last Wednesday afternoon. The Dow stalled for a...
READ MORE
MEMBERS ONLY
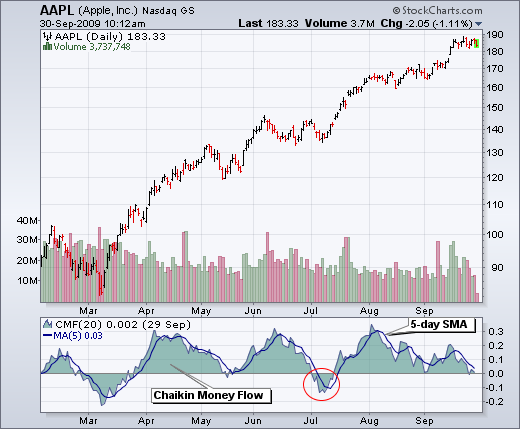
Money Flows Near Zero for Apple
by Arthur Hill,
Chief Technical Strategist, TrendInvestorPro.com
Chaikin Money Flow for Apple (AAPL) has been positive from mid July to late September. There was a brief dip into negative territory last week, but Chaikin Money Flow recovered on Monday. Nevertheless, the 5-day SMA of the indicator is perilously close to turning negative for the time since...
READ MORE
MEMBERS ONLY

Getting out of the "Zone"
by Tom Bowley,
Chief Market Strategist, EarningsBeats.com
Autozone (AZO) is setting up rather bearishly in a bear flag formation. Divergences on the MACD within the retail space are weak at best and AZO has been a relative underperformer with its MACD unable to climb above the centerline, one of the few stocks having that difficulty. Watch the...
READ MORE
MEMBERS ONLY

PHARM HOLDERS REACH 52-WEEK HIGH -- ABBOTT LABS GAPS HIGHER ON ACQUISITION NEWS -- WYETH HITS THREE-YEAR HIGH -- BRISTOL MYERS SQUIBB NEARS BULLISH BREAKOUT -- WATSON PHARMACEUTICALS HITS FIVE-YEAR HIGH
by John Murphy,
Chief Technical Analyst, StockCharts.com
DRUG STOCKS SHOWING SOME LEADERSHIP... At the start of last week, I wrote an article about some money starting to flow into the healthcare sector. My main focus in that earlier article was on biotech stocks that were starting to attract some money. Today's healthcare focus is on...
READ MORE
MEMBERS ONLY

A Bullish PnF Chart for Activision
by Arthur Hill,
Chief Technical Strategist, TrendInvestorPro.com
This long-term PnF chart for Activision extends back to 2003 when the stock was trading in the low single digits. After rising above 19, the stock went into corrective mode in 2008 and broke out in 2009. With the May-June (5-6 on the chart) breakout, ATVI has...
READ MORE
MEMBERS ONLY

SPY Bounces, But Hits Key Retracement
by Arthur Hill,
Chief Technical Strategist, TrendInvestorPro.com
-SPY Bounces After Indecision
-SPY Hits Key retracement on Intraday Chart
-China and Japan Lag
-Net Advancing Volume Not that Strong
-Transport ETF Tests Broken Resistance
-Bollinger Bands Tighten for SMH
-Autonation (AN) Hits Support
-Ford (F) Breaks Wedge Resistance
-Gilead (GILD) Maintains Uptrend
-Intuit (INTU) Bounces off Support
-Lowe&...
READ MORE
MEMBERS ONLY

China and Japan Lag
by Arthur Hill,
Chief Technical Strategist, TrendInvestorPro.com
Since early July, the Shanghai Composite ($SSEC) and the Nikkei 225 ($NIKK) have been lagging western European stock markets and the US. The PerfChart below shows the Shanghai Composite is actually down since July and the Nikkei is barely positive. In contrast, the US and western European indices are up...
READ MORE
