MEMBERS ONLY

August-September Lows Mark Key Support

by Arthur Hill,
Chief Technical Strategist, TrendInvestorPro.com
-Market Overview
-RSI Holds for QQQQ
-August Lows Mark Key Support
-Defensive Sectors and Technology Lagging
-XLB and XLY Hold Breakouts
-OIH forms Falling Flag
-KRE Hits Key Retracement
-IYT and IYR Bounce off August Lows
-Stocks: AA, DRI, DRYS, EXPD, RIG, SLE, XTO
-Link to today's video....
READ MORE
MEMBERS ONLY
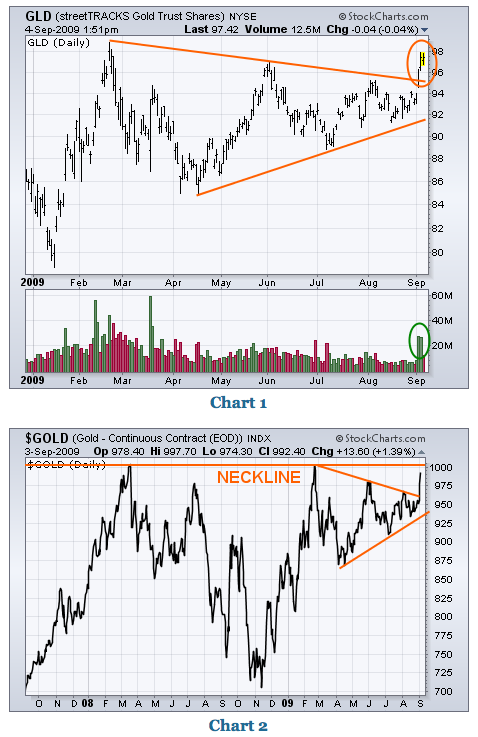
GOLD AND SILVER HAVE BIG WEEK

by John Murphy,
Chief Technical Analyst, StockCharts.com
GOLD TESTING ALL-TIME HIGH... Last Friday I wrote about the bullish potential in gold and gold shares. That optimism was based on two bullish chart patterns which are shown below. The first is the bullish symmetrical triangle shown in Chart 1 for the Gold Trust ETF (GLD). This week&...
READ MORE
MEMBERS ONLY

TECHNICAL ANALYSIS 101 - PART 12
This is the next part of a series of articles about Technical Analysis from a new course we're developing. If you are new to charting, these articles will give you the "big picture" behind the charts on our site. if you are an "old hand&...
READ MORE
MEMBERS ONLY
ON HIATUS THIS WEEK

by Richard Rhodes,
Founder and President, Rhodes Capital Management and Rhodes Trading Group
Richard will return for our next issue....
READ MORE
MEMBERS ONLY
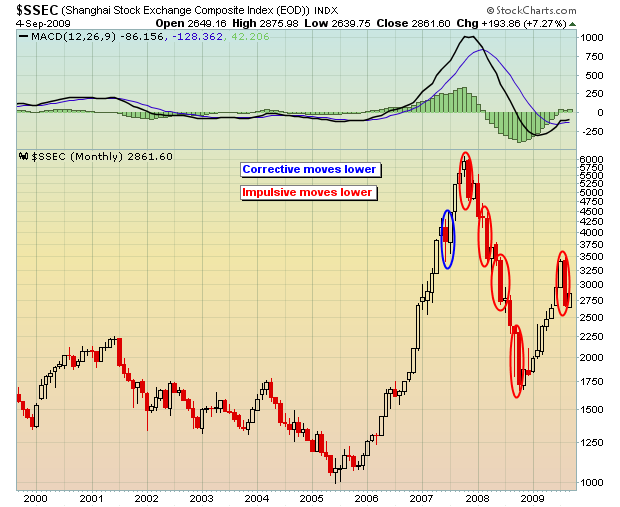
CHINA MAY HOLD SOME CLUES

by Tom Bowley,
Chief Market Strategist, EarningsBeats.com
China's Shanghai Composite index is swinging wildly in both directions, reminiscent of the 1999-2002 moves by the NASDAQ. From a long-term perspective, you can clearly see that trends in both directions have been exaggerated. Any time that we've seen impulsive moves in one direction...
READ MORE
MEMBERS ONLY
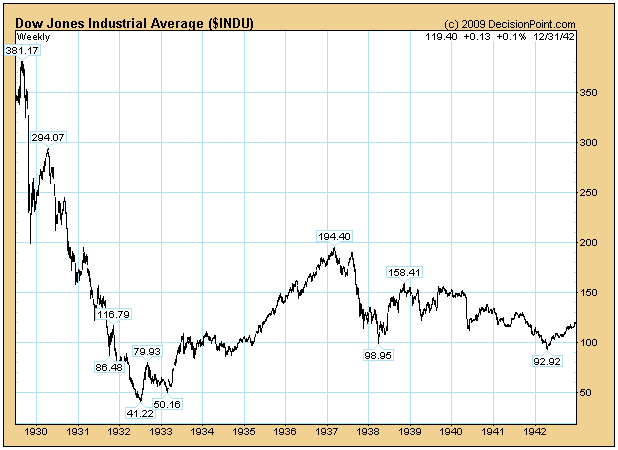
LOOKING BACK

by Carl Swenlin,
President and Founder, DecisionPoint.com
I continue to get mail from people who question how it is possible to be bullish in the face of the worst fundamentals since the Great Depression, so I thought it would be useful to look at a chart of the 1929 Crash and the decade that followed it.
Squeezed...
READ MORE
MEMBERS ONLY

GOLD AND SILVER HAVE BIG WEEK -- SO DO GOLD STOCKS -- GOLD LEADERS INCLUDE ABX, GG, KGC, AEM, AND IAG -- PRECIOUS METAL ASSETS ARE BACK IN FAVOR
by John Murphy,
Chief Technical Analyst, StockCharts.com
GOLD TESTING ALL-TIME HIGH... Last Friday I wrote about the bullish potential in gold and gold shares. That optimism was based on two bullish chart patterns which are shown below. The first is the bullish symmetrical triangle shown in Chart 1 for the Gold Trust ETF (GLD). This week&...
READ MORE
MEMBERS ONLY
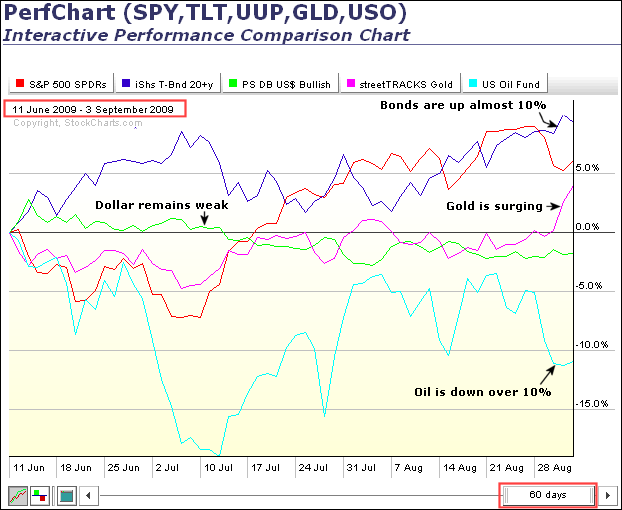
BONDS AND GOLD LEAD THE WAY HIGHER
by Arthur Hill,
Chief Technical Strategist, TrendInvestorPro.com
Intermarket analysis shows strength in bonds and gold, but weakness in the Dollar and oil. Strange days indeed. The Intermarket Perfchart below shows performance over the last sixty days, from June 11th to September 3rd. Relative strength in bonds is the first thing that jumps out. Performance for the 20+...
READ MORE
MEMBERS ONLY
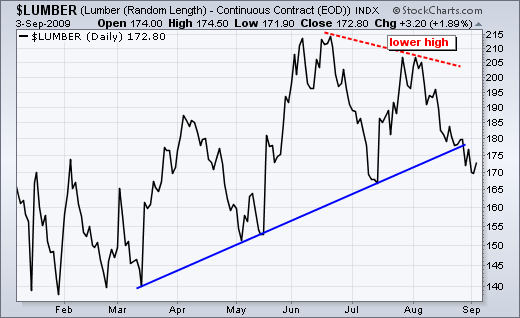
Lumber Forms Lower High
by Arthur Hill,
Chief Technical Strategist, TrendInvestorPro.com
Lumber Continuous Futures ($LUMBER) did not have a good August. Lumber formed a lower high in early August and moved lower throughout the month. As a key component in housing, lumber should be watched for clues on the homebuilders and the economy. Other futures contracts available at Stockcharts.com include...
READ MORE
MEMBERS ONLY
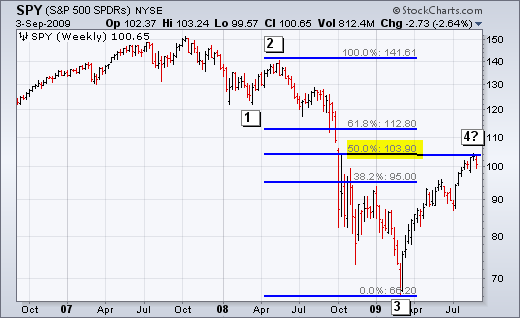
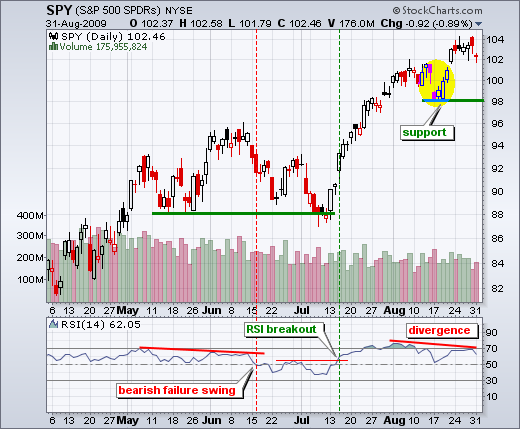
Wave 4 Continues Up for SPY
by Arthur Hill,
Chief Technical Strategist, TrendInvestorPro.com
-SPY Nears Long-term Retracement
-Current Advance Looks Like Wave 4
-Momentum Wanes on Daily SPY Chart
-Net New Highs Form Negative Divergence
-AD Lines and AD Volume Lines Remain Bullish
-McClellan Oscillator Turn Bearish
-Volatility Indices Break Resistance
-Link to today's video
-Next update: September 8th (Tuesday)...
READ MORE
MEMBERS ONLY

DOW STALLS AFTER SHARP DECLINE - BONDS LEAD INTERMARKET PLAYERS - WEAK DOLLAR NOT MUCH HELP FOR OIL - ENERGY SECTOR SHOWS RELATIVE WEAKNESS - MACD TURNS NEGATIVE FOR USO
by John Murphy,
Chief Technical Analyst, StockCharts.com
STOCKS EDGE HIGHER... Link for todays video. Stocks edged higher ahead of Fridays employment report and three day weekend. Chart 1 shows the Dow Industrials gaining around 64 points, which is a relatively small move (+.69%). After a long red candlestick and sharp decline on Tuesday, the Dow stalled with...
READ MORE
MEMBERS ONLY

XLB Tests Support
by Arthur Hill,
Chief Technical Strategist, TrendInvestorPro.com
After breaking above resistance in July, the Materials SPDR (XLB) moved into a holding pattern as broken resistance turned into support. Notice how the ETF bounced off 28.5 in mid August and is testing this level again in early September. A move below support would show weakness.
Click this...
READ MORE
MEMBERS ONLY

UPSIDE MOMENTUM WANES FOR SPY - SIGNS OF SELLING PRESSURE ON INTRADAY CHARTS - MCCLELLAN OSCILLATORS SHOW BREADTH DETERIORATION - GOLD SURGES ABOVE TRIANGLE RESISTANCE - GOLD STOCKS OUTPACE GOLD - DOLLAR REMAINS IN DOWNTREND
by John Murphy,
Chief Technical Analyst, StockCharts.com
STOCKS STALL AFTER SHARP DECLINES... Link for todays video. After sharp declines on Monday and Tuesday, the S&P 500 ETF (SPY)* stalled just below 100 on Wednesday. Chart 1 shows the ETF closing in the red for its fourth consecutive losing day. SPY has not seen four down...
READ MORE
MEMBERS ONLY
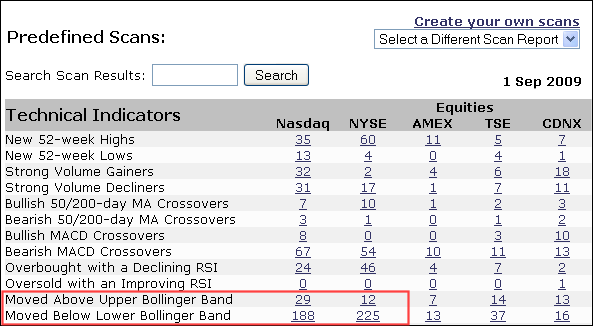
Info from the Bollinger Band Scan
by Arthur Hill,
Chief Technical Strategist, TrendInvestorPro.com
Stockcharts.com provides a number of pre-defined scans using classic indicators. In particular, I always keep an eye on the Bollinger Band scan that shows stocks moving above their upper band and stocks moving below their lower band. Selling pressure is picking up as many more stocks moved below...
READ MORE
MEMBERS ONLY

US DOLLAR HAS COMPLETED FIVE-WAVE DECLINE AND IS DUE FOR A BOUNCE WHILE THE EURO LOOKS TOPPY -- THAT FITS INTO A DOWNSIDE CORRECTION IN STOCKS AND COMMODITIES -- SO DOES THE RALLY IN THE YEN
by John Murphy,
Chief Technical Analyst, StockCharts.com
DOLLAR DUE FOR A RALLY ... On August 17, I wrote a message showing that the CRB Index had completed a five-wave advance and was due a correction (which appears to have started). The following day I did a similar analysis showing that the U.S. Dollar had completed a...
READ MORE
MEMBERS ONLY

Financials Back in Spotlight
by Arthur Hill,
Chief Technical Strategist, TrendInvestorPro.com
A look at the Market Carpet on Tuesday (11AM ET) shows the finance sector with the most red. In addition, four of the top five losers in the S&P 500 come from the finance sector. Notice the numbered red squares (2-5). Technology is holding up the best...
READ MORE
MEMBERS ONLY

OVERBOUGHT FINANCIALS LEAD MARKET LOWER --AIG, CITIGROUP, AND BANK OF AMERICA ARE BIG LOSERS -- VIX BREAKS OUT TO UPSIDE AS STOCKS FALL -- TREASURIES, THE YEN, AND THE DOLLAR ARE ATTRACTING SAFE HAVEN MONEY
by John Murphy,
Chief Technical Analyst, StockCharts.com
FINANCIALS DROP 4%... I recently wrote about the negative warning from the market's loss of leadership in the technology sector. Today, the negative warning is coming from financials. And it's coming at a bad time for the financials the rest of the market. The Financials Sector...
READ MORE
MEMBERS ONLY
Negative Divergences and Weakness in China
by Arthur Hill,
Chief Technical Strategist, TrendInvestorPro.com
-Back in the Saddle
-RSI Negative Divergence for SPY
-China Could Foreshadow Market Top
-Nasdaq Lagging NY Composite
-Interest Rates Continue to Fall
-Dollar Remains in Quiet Downtrend
-Gold Stalls Around 950
-Video Includes some Stock Setups
-Link to today's video
The next update will be September 4th...
READ MORE
MEMBERS ONLY

BIG DROP IN CHINESE SHARES CAUSES SELLING IN GLOBAL STOCKS AND COMMODITIES -- COPPER AND OIL (AND THEIR RELATED STOCKS) ARE HIT THE HARDEST -- SAFE HAVEN MONEY IS MOVING INTO THE YEN AND TREASURIES -- OVERBOUGHT STOCKS ARE STARTING TO SLIP
by John Murphy,
Chief Technical Analyst, StockCharts.com
SHANGHAI INDEX HAS LOST 23% DURING AUGUST ... I had been surprised at how little attention was being paid to the big drop in Chinese shares since the start of August. That's why I warned on Friday that the big drop in Shanghai could cause profit-taking in global...
READ MORE
MEMBERS ONLY

Hang Seng Lagging S&P 500
by Arthur Hill,
Chief Technical Strategist, TrendInvestorPro.com
While the S&P 500 sports a small gain for the month of August, the Hong Kong Hang Seng Index ($HSI) is actually down and lagging. The S&P 500 (black) moved above its early August high last week, but the Hang Seng Index (red) formed a lower...
READ MORE
MEMBERS ONLY

Intel's Raised Guidance Lifts Semiconductors to Key Resistance
by Tom Bowley,
Chief Market Strategist, EarningsBeats.com
Once the SOX broke below the March and July lows of 2008, a new low close of 312 was established in mid-Sept 2008. After a move higher to quickly retest the earlier breakdown area, the SOX fell precipitously into late 2008. After months of trending higher, the SOX had...
READ MORE
MEMBERS ONLY

TREASURY RALLY HINTS AT STOCK PULLBACK -- SO DOES 20% AUGUST DROP IN SHANGHAI INDEX -- GOLD IS CONSOLIDATING IN BULLISH SYMMETRICAL PATTERN -- GOLD SHARES ALSO LOOK PROMISING
by John Murphy,
Chief Technical Analyst, StockCharts.com
STOCKS AND BOND YIELDS MOVE TOGETHER... Last week (August 18) I wrote about one of the side-effects of a deflationary environment being the positive correlation between stock prices and Treasury bond yields. In other words, Treasury yields and stock prices trend in the same direction. Chart 1, for example,...
READ MORE
MEMBERS ONLY

When to Ignore Gaps
by Arthur Hill,
Chief Technical Strategist, TrendInvestorPro.com
Nokia is a $49 billion company that trades on the NYSE - as an ADS (American Depository Shares). Nokia also happens to trade on the Nasdaq OMX Helsinki. Yes, Nasdaq bought the Helsinki exchange. Anyhow, this means Nokia starts trading long before the NYSE opens. Because prices have already moved in...
READ MORE
MEMBERS ONLY

POINT & FIGURE CHARTS ARE HELPFUL IN GIVING PRECISE BUY AND SELL SIGNALS -- USING BAR CHARTS TO SPOT SHORT-TERM SUPPORT AND RESISTANCE LEVELS
by John Murphy,
Chief Technical Analyst, StockCharts.com
P&F SIGNALS ARE MORE PRECISE ... Once in a while, I like to review the merits of point & figure charting which can be used as an adjunct to other charting methods. As I've pointed out before, one of the most compelling virtues of p&f...
READ MORE
MEMBERS ONLY

Combining Factors
by Arthur Hill,
Chief Technical Strategist, TrendInvestorPro.com
Candlesticks are more powerful when combined with other aspects of technical analysis. Noble Energy (NE) gapped down and formed a hammer in early July. Over the next two days, a piercing pattern formed to further affirm support around 28. The catalyst came when the stock surged above 29 with good...
READ MORE
MEMBERS ONLY

Bullish Engulfing Reinforces Support
by Arthur Hill,
Chief Technical Strategist, TrendInvestorPro.com
There are bullish engulfing patterns and then there are BULLISH ENGULFING patterns. Kohls (KSS) successfully tested support from its May lows with a bullish engulfing on high volume. Three items came together for this bullish signal: support, a bullish candlestick reversal and high upside volume. The more, the merrier. Note:...
READ MORE
MEMBERS ONLY

HOUSING BREAKOUT CONTINUES TO BUILD ON IMPROVING FUNDAMENTALS -- LENNAR AND NVR ARE GROUP LEADERS -- OTHER PROMISING HOMEBUILDING CHARTS BELONG TO DHI, MDC, PHM AND TOLL BROTHERS -- MARKET EXTENDS SUMMER RALLY BUT IS ON SHAKY TECHNICAL GROUND
by John Murphy,
Chief Technical Analyst, StockCharts.com
MORE GOOD HOUSING NEWS BOOSTS HOMEBUILDERS... Each passing week brings more encouraging news on housing. Today's second quarter news shows home prices in the U.S. jumping for the first time in three years. As is usually the case, that good news has been anticipated by stocks tied...
READ MORE
MEMBERS ONLY

Bearish Engulfing Marks Resistance
by Arthur Hill,
Chief Technical Strategist, TrendInvestorPro.com
The bearish engulfing pattern is a short-term candlestick reversal, but it can also mark future resistance. Jabil Circuit (JBL) formed a bearish engulfing in early May and this area marked resistance a month later. The stock formed a rising wedge that peaked just below the early May high and...
READ MORE
MEMBERS ONLY
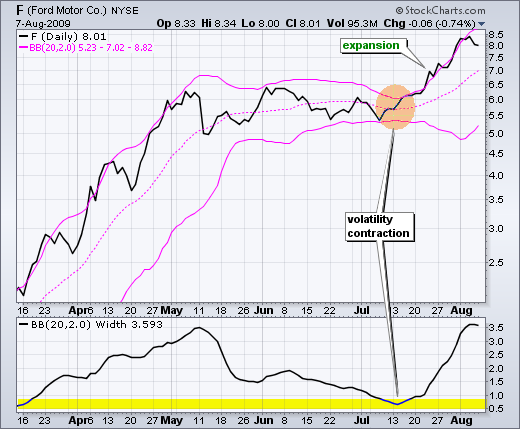
Looking for Volatility Contractions
by Arthur Hill,
Chief Technical Strategist, TrendInvestorPro.com
Volatility contractions often precede volatility expansions. This is the rational behind Bollinger Bands. After surging above 5.5, Ford (F) formed a long consolidation and Bollinger Bands contracted as the range narrowed. The subsequent move above resistance and the upper Bollinger Band triggered the volatility expansion (breakout). Note: This is...
READ MORE
MEMBERS ONLY

STRONG HOUSING NUMBERS BOOST HOMEBUILDERS AND REITS WHICH ARE IN NEW UPTRENDS -- THAT HELPS EXTEND MARKET RALLY -- SUPPORT LEVELS TO WATCH
by John Murphy,
Chief Technical Analyst, StockCharts.com
HOMEBUILDERS AND REITS ARE IN NEW UPTRENDS ... During the last week of July, I wrote a couple of bullish stories on housing related stocks. I also pointed out that their strong price action was a leading indication of better fundamentals to come in housing. Today's report that July...
READ MORE
MEMBERS ONLY
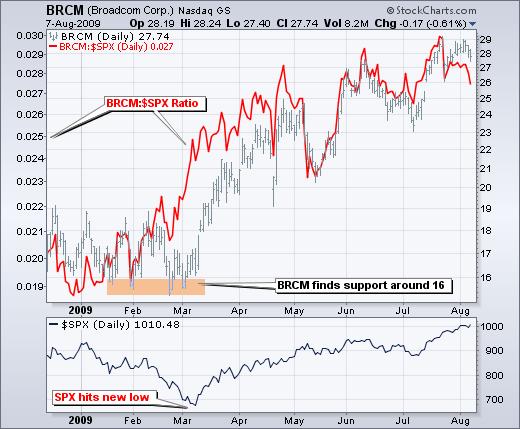
Using the Price Relative
by Arthur Hill,
Chief Technical Strategist, TrendInvestorPro.com
The price relative can be used to show relative strength or relative weakness. While the S&P 500 moved to new lows in March, Broadcom (BRCM) held support around 16 from mid January to early March. As a result of relative strength, the price relative (BRCM:$SPX ratio) surged...
READ MORE
MEMBERS ONLY

BULLISH PERCENT NUMBERS ARE OVERBOUGHT BUT STILL IN P&F UPTRENDS -- ONLY THE NASDAQ 100 AND MATERIAL SECTOR ARE SHOWING SIGNS OF WEAKNESS -- BULLISH PERCENT FOR GOLD GROUP IS NEUTRAL
by John Murphy,
Chief Technical Analyst, StockCharts.com
NYSE BULLISH PERCENT INDEX STILL IN UPTREND... Earlier in the week, I wrote about overbought readings in the Bullish Percent Indexes for the S&P 500 and the Nasdaq market. Today I'm showing the point & figure version of those two indexes. That's fitting since...
READ MORE
MEMBERS ONLY
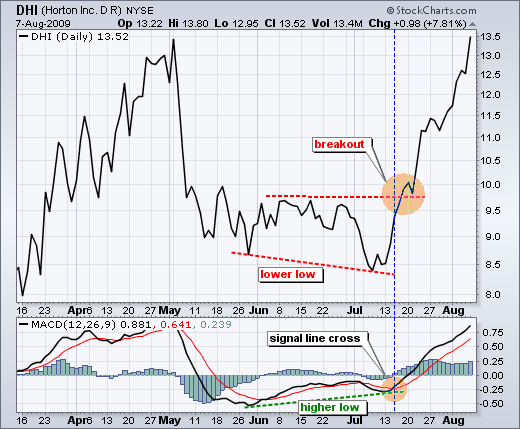
Detecting a Fade in Downside Momentum
by Arthur Hill,
Chief Technical Strategist, TrendInvestorPro.com
Positive divergences in MACD show waning downside momentum that can lead to a breakout. DR Horton (DHI) forged a lower low in early July, but MACD held above its June low for a positive divergence. Despite a lower low in the stock, downside momentum was fading. MACD's subsequent...
READ MORE
MEMBERS ONLY

Volume By Price Confirms Support
by Arthur Hill,
Chief Technical Strategist, TrendInvestorPro.com
The volume-by-price bars for Bank of America were the longest between 11 and 13. Even though the red and green portions were relatively equal, it is clear that many positions were established in this range. Remember, there is a buyer for every seller. With so much volume, the...
READ MORE
MEMBERS ONLY
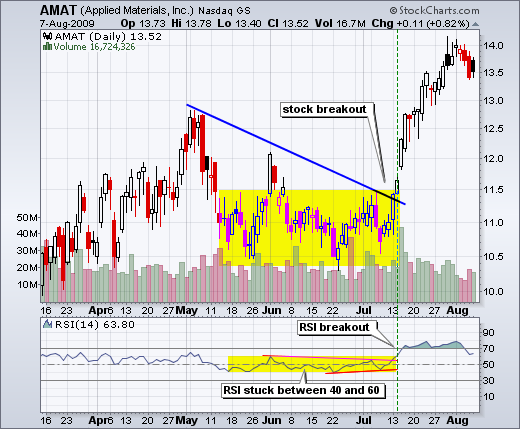
RSI Breakouts
by Arthur Hill,
Chief Technical Strategist, TrendInvestorPro.com
Momentum indicators like RSI can be used to define periods when there isn't much momentum, such as a consolidation. Applied Materials (AMAT) was largely range bound from mid May to mid July (yellow area). So was RSI. The breakout in the stock corresponded with a range breakout in...
READ MORE
MEMBERS ONLY

COMMODITIES APPEAR TO HAVE COMPLETED A FIFTH WAVE ADVANCE WHICH MAKES A CORRECTION LIKELY -- CHINA AND COPPER HAVE RALLIED TOO FAR -- OIL LOSES UPSIDE MOMENTUM -- GOLD MAY BENEFIT FROM A CORRECTION IN STOCKS AND COMMODITIES
by John Murphy,
Chief Technical Analyst, StockCharts.com
CRB TRACKS THE EURO... Yesterday's message expressed the view that stocks and commodities appeared ripe for a downside correction. Both of those markets have been rising together since March. At the same time, the dollar has been dropping. I also showed that the Dollar Index appeared to have...
READ MORE
MEMBERS ONLY
Volume By Price Confirms Support
by Arthur Hill,
Chief Technical Strategist, TrendInvestorPro.com
The volume-by-price bars for Bank of America were the longest between 11 and 13. Even though the red and green portions were relatively equal, it is clear that many positions were established in this range. Remember, there is a buyer for every seller. With so much volume, the...
READ MORE
MEMBERS ONLY

S&P 500 AND NASDAQ 100 STALL AT MAJOR RESISTANCE LEVELS -- SEVERAL MARKET MEASURES SHOW VERY OVERBOUGHT MARKET -- DEFENSIVE MONEY MOVES INTO HEALTHCARE -- USING AN ETN TO BUY VOLATILITY
by John Murphy,
Chief Technical Analyst, StockCharts.com
OVERBOUGHT S&P 500 BACKS DOWN FROM 1000 BARRIER ... The week before leaving on vacation (July 28 to be exact) I wrote a market message warning that both the S&P 500 and the Nasdaq 100 had reached important overhead resistance barriers and were in overbought territory. I...
READ MORE
MEMBERS ONLY

GLOBAL STOCK AND COMMODITY CORRECTION MAY BE STARTING AS DEFENSIVE MONEY FLOWS BACK INTO THE DOLLAR AND TREASURY BONDS
by John Murphy,
Chief Technical Analyst, StockCharts.com
STOCK DROP STARTS IN ASIA... A 5% drop in China's Shanghai Stock Index started a global selling spree that has spread to the U.S. Chart 1 shows China iShares (FXI) gapping down 4.4% and undercutting its 50-day average. Chart 2 shows EAFE iShares (EFA) falling...
READ MORE
MEMBERS ONLY

Envelope Surges Show Strength
by Arthur Hill,
Chief Technical Strategist, TrendInvestorPro.com
The chart below shows DIA with a 20-day SMA and an envelope set 4% above/below the 20-day SMA. Notice how the January plunge below the lower envelope triggered an extended decline. Conversely, the March surge above the upper envelope kicked off the current rally. Not all signals...
READ MORE
