MEMBERS ONLY
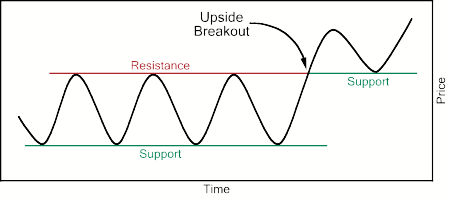
TECHNICAL ANALYSIS 101 - PART 11
This is the next part of a series of articles about Technical Analysis from a new course we're developing. If you are new to charting, these articles will give you the "big picture" behind the charts on our site. if you are an "old hand&...
READ MORE
MEMBERS ONLY
ON HIATUS THIS WEEK

by John Murphy,
Chief Technical Analyst, StockCharts.com
John will return for our next issue.......
READ MORE
MEMBERS ONLY
"IF THEY A YELL'IN; THEN YOU SHOULD BE SELL'IN"

by Richard Rhodes,
Founder and President, Rhodes Capital Management and Rhodes Trading Group
The July-August stock market rally has caught many surprised given its strength and duration; however, we are of the opinion that this "freight train" is running of out of fuel, and shall falter from roughly current levels in what may be quite a "quick and nasty&...
READ MORE
MEMBERS ONLY
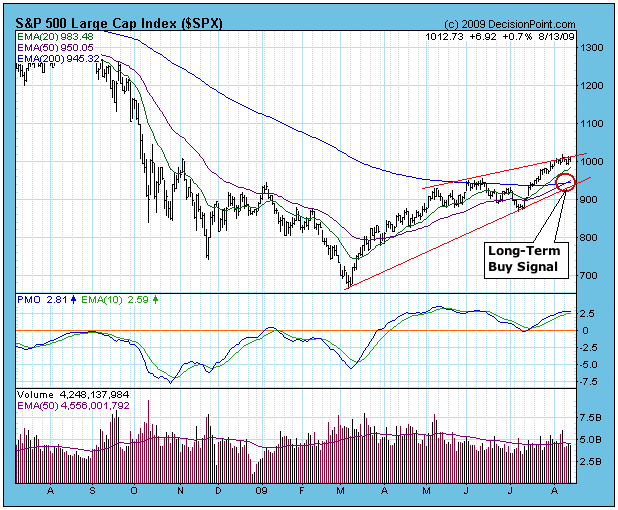
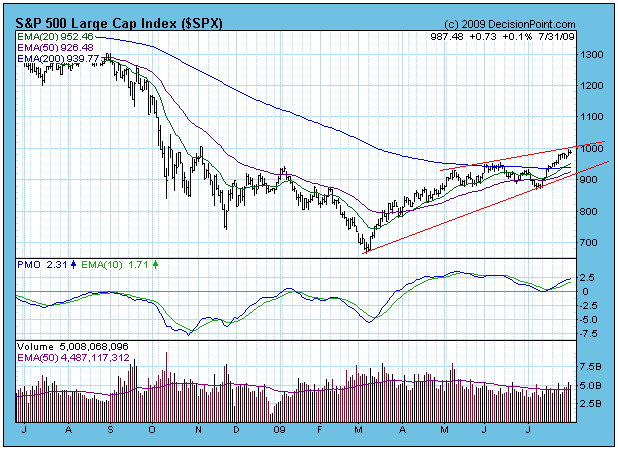
LONG-TERM BUY SIGNAL

by Carl Swenlin,
President and Founder, DecisionPoint.com
On Tuesday of this week our long-term model for the S&P 500 switched from a sell to a buy signal. While it is a simple model -- the signals are generated by the 50-EMA crossing over the 200-EMA -- it can also be very effective, capturing a...
READ MORE
MEMBERS ONLY
CAUTION IS ADVISED NEAR-TERM

by Tom Bowley,
Chief Market Strategist, EarningsBeats.com
Two weeks ago, I pointed out what appeared to be the early stages of a new trend of outperformance by the financials and suggested they might be primed for a move higher to rescue the stumbling stock market. Right on cue, money rotated back into financials and we saw the...
READ MORE
MEMBERS ONLY
Keeping an Eye on Bullish Percent

by Arthur Hill,
Chief Technical Strategist, TrendInvestorPro.com
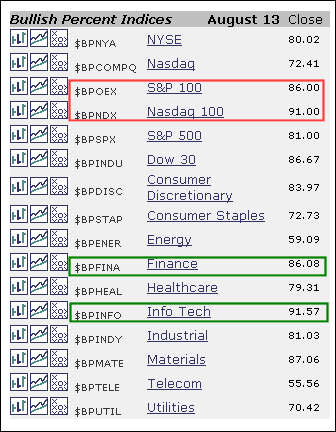
The Bullish Percent Indices measure the percentage of stocks on a Point&Figure buy signal for a given index. In general, an index has a bullish bias when its Bullish Percent is above 50% and a bearish bias when below 50%. Stockcharts.com users can easily keep an eye...
READ MORE
MEMBERS ONLY

Gamestop Moves above Upper Band
by Arthur Hill,
Chief Technical Strategist, TrendInvestorPro.com
Gamestop (GME) came across the Bollinger Band screen with a move above the upper band on Thursday. Such moves show underlying strength. Notice how GME plunged below the lower band in early May and then worked its way lower until July with the 20-day SMA acting as a short-...
READ MORE
MEMBERS ONLY
Dollar Hits Resistance as Gold Hits Support
by Arthur Hill,
Chief Technical Strategist, TrendInvestorPro.com
-Bulls Still Dominate
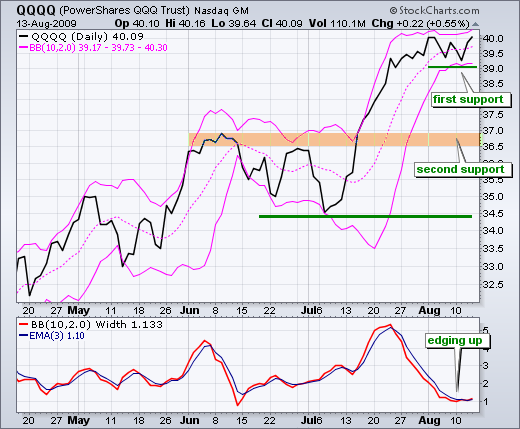
-A Close-Only View of QQQQ
-SPY Stalls around 100
-Short-term Momentum Deteriorates
-Breadth Remains Bullish Overall
-VIX Shows Short-term Abnormality
-Dollar Reinforces Resistance
-Gold Holds Support and Dollar Falls
-Bonds Bounce off Support After Fed
-Stocks: LMT, PFCB, RIMM
-Click here for today'...
READ MORE
MEMBERS ONLY
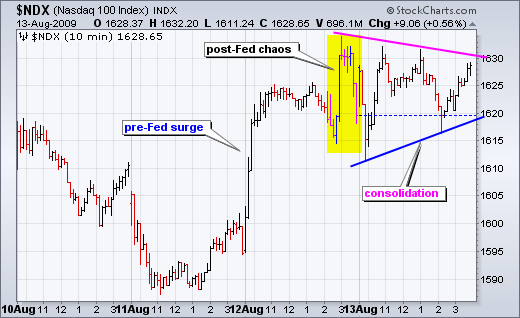
NDX Consolidates After the Fed
by Arthur Hill,
Chief Technical Strategist, TrendInvestorPro.com
There are three distinct periods over the last two days. First, stocks surged as the Nasdaq 100 advanced above 1620 before the Fed meeting. Second, stocks gyrated rather wildly as NDX moved above and below 1620 after the announcement. Third, stocks consolidated as the market digested the Fed statement. Watch...
READ MORE
MEMBERS ONLY

FINANCE SECTOR BACK TO PROMINENCE - XLF HOLDS ITS BREAKOUTS - BULLISH% FOR XLK STAYS STRONG - MARKING SUPPORTS FOR XLY - XLK STALLS FOR 3 WEEKS - BULLISH% FOR XLK IS OVERBOUGHT - RANKING BULLISH% INDICES - REVISITING ELLIOTT WAVE
by John Murphy,
Chief Technical Analyst, StockCharts.com
FINANCIALS GAIN SOME WEIGHT... Link for todays video. After more than doubling since March, the Financials SPDR (XLF) is now the second biggest sector in the S&P 500. This was surely not the case in March when XLF was trading around 6. The finance was already an important...
READ MORE
MEMBERS ONLY

FED TO END BOND PURCHASE PROGRAM - BONDS REMAIN RANGE BOUND - TECHS AND SMALL-CAPS LEAD STOCKS HIGHER - SETTING SHORT-TERM SUPPORT - ALL SECTORS PARTAKING IN BULL RUN - PROGRAMMING NOTE
by John Murphy,
Chief Technical Analyst, StockCharts.com
FED LEAVES RATES UNCHANGED... Link for todays video.
With signs the economy is stabilizing, the FOMC voted to keep interest rates unchanged. This means the Fed Funds target rate remains 0-.25%. Moreover, the Fed suggested that rates could stay low for an extended period of time. The Fed also...
READ MORE
MEMBERS ONLY
Oil and Base Metals Keep Pace With Stocks
by Arthur Hill,
Chief Technical Strategist, TrendInvestorPro.com
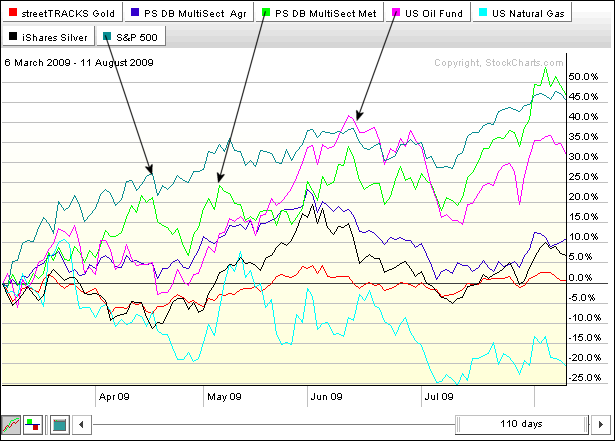
The PerfChart below shows the key commodity related ETFs and the S&P 500 since early March. As the stock market surged, the US Oil Fund ETF (USO) and the Base Metals ETF (DBB) were the only two commodity ETFs able to keep pace. The Natural Gas ETF (UNG)...
READ MORE
MEMBERS ONLY

Steel ETF Hits Resistance
by Arthur Hill,
Chief Technical Strategist, TrendInvestorPro.com
After surging to the June high, the Steel Vectors (SLX) met resistance and pulled back over the last two days. Notice that the August 3rd gap did not hold and the price relative formed a lower high. SLX is starting to show relative weakness.
Users can click on this chart...
READ MORE
MEMBERS ONLY

S&P 500 STALLS AT 1000 - ELLIOTT WAVE COUNTS - S&P 500 RETURNS TO FALLING CHANNEL - US DOLLAR INDEX RECOVERS AFTER SUPPORT BREAK - GOLD REACTS TO SURGING DOLLAR
by John Murphy,
Chief Technical Analyst, StockCharts.com
STOCKS CONTINUE AUGUST STALL... Link for todays video.
Stocks moved lower as the Fed began its two day meeting on Tuesday. The FOMC is expected to make its policy statement on Wednesday at 2:15PM, which means we may see some fireworks the next two days. The S&P...
READ MORE
MEMBERS ONLY
A Trend in Motion Stays in Motion
by Arthur Hill,
Chief Technical Strategist, TrendInvestorPro.com
-A Trend in Motion Stays in Motion
-High/Low Range Narrows for SPY
-QQQQ Volatility Contracts Further
-Short-term Uptrends Remain In Place
-XLY Forms Inside Day
-OIH Forges Island Reversal
-IGN Stalls at Resistance
-SMH Declines Five Days Straight
-Stocks Covered: AAPL, ARO, AVY, CHRW, DYN
-Click here for...
READ MORE
MEMBERS ONLY

Bullish Percent Index Shows Strength
by Arthur Hill,
Chief Technical Strategist, TrendInvestorPro.com
The S&P 500 Bullish Percent Index stands at 80%, its highest level since February 2007. Above 70% is generally regarded as overbought because this indicator spends most of its time fluctuating between 30% and 70%. However, 80% testifies to underlying strength within the index and this indicator favors...
READ MORE
MEMBERS ONLY
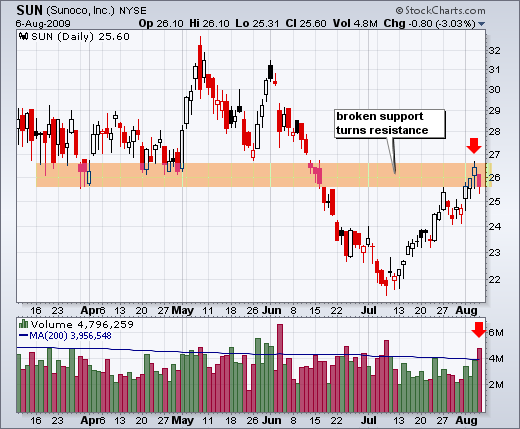
Sunoco Surges to Broken Support
by Arthur Hill,
Chief Technical Strategist, TrendInvestorPro.com
Sunoco (SUN) broke support around 26 with a sharp decline in June. After reversing course in early July, the stock surged back to broken support, which now turns into resistance. Notice how the stock pulled back with high volume on Thursday. This is a big resistance test.
Users can click...
READ MORE
MEMBERS ONLY
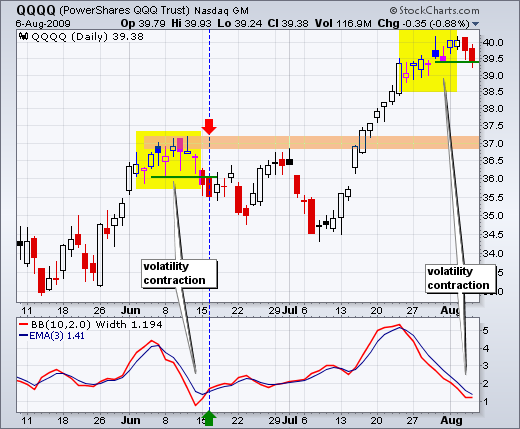
A Volatility Contraction for QQQQ
by Arthur Hill,
Chief Technical Strategist, TrendInvestorPro.com
-QQQQ Extends Volatility Contraction
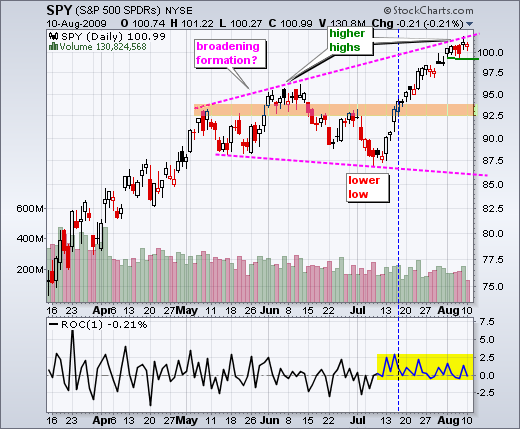
-SPY Hits Broadening Resistance
-Short-term Momentum Turns Bearish
-AAII Bulls Hit 50%
-Breadth Remains Bullish Overall
-Nasdaq Lags NY Composite
-Finance Sector Pushes Small-caps Higher
-VIX and VXN Diverge
-Intermarket Correlations
-Link to today's video
-Next update will be Tuesday (August 11)...
READ MORE
MEMBERS ONLY

S&P 500 13-WEEK EMA CROSSES ABOVE 34-WEEK EMA - REVIEWING 13-34 CROSSOVER - ADDING MOMENTUM WITH THE PERCENTAGE PRICE OSCILLATOR - INCREASING SIGNALS WITH DAILY CHARTS - GOLD FORMS LARGE TRIANGLE - DOLLAR REMAINS OVERSOLD
by John Murphy,
Chief Technical Analyst, StockCharts.com
13-34 CROSSOVER FOR SPX... Link for todays video. A few readers inquired about the recent crossover in 13-week and 34-week exponential moving averages. John Murphy is the 13-34 specialist, but I can provide some insights until he returns. As the S&P 500 now stands...
READ MORE
MEMBERS ONLY
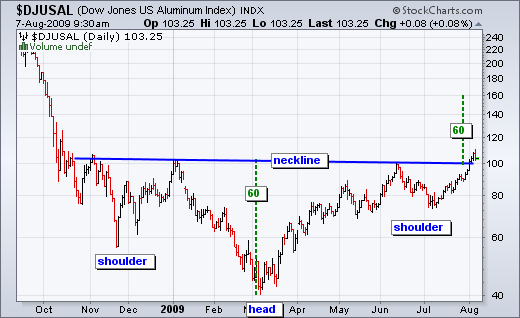
An Inverse HS for the Aluminum Index
by Arthur Hill,
Chief Technical Strategist, TrendInvestorPro.com
The DJ US Aluminum Index ($DJUSAL) traced out a massive inverse head-and-shoulders over the last nine months and broke above neckline resistance this week. With this pattern representing a large base, the breakout is bullish and targets further strength towards 140. Careful though, the index is already up...
READ MORE
MEMBERS ONLY

VOLATILITY CONTRACTS FOR QQQQ - RIG AND BHI LEAD OIL SERVICE HOLDRS LOWER - OIL FIRMS AS DOLLAR SOFTENS - POUND ETF BREAKS RESISTANCE - YEN ETF FIRMS AT SUPPORT - BONDS WILT AS SUPPLY ISSUES HIT HOME
by John Murphy,
Chief Technical Analyst, StockCharts.com
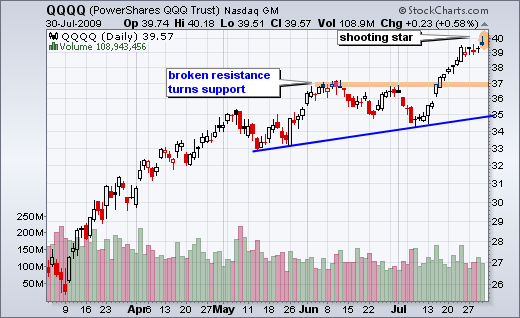
VOLATILITY CONTRACTS FOR QQQQ... Link for todays video. After a surge in mid July, the advance has slowed over the last two weeks and volatility has contracted. Chart 1 shows the Nasdaq 100 ETF (QQQQ) surging above 39 on July 23th and working its way towards 40 the last two...
READ MORE
MEMBERS ONLY

Financials Dominate Most Active List
by Arthur Hill,
Chief Technical Strategist, TrendInvestorPro.com
From the NYSE most active list on the stockcharts.com home page, we can see that banks take up half the list (5 of 10). Although not a bank, GE has a large financial services arm and was third on the list. Also notice that all six of these finance...
READ MORE
MEMBERS ONLY

STOCKS TURN MIXED - SMALL-CAPS AND MID-CAPS LEAD MARKET - TECHS START TO LAG - FINANCIALS SPDR BREAKS MAY HIGH - REGIONAL BANK SPDR MAKES IT 10 STRAIGHT - REIT ETF POWER PAST JUNE HIGH
by John Murphy,
Chief Technical Analyst, StockCharts.com
MARKET TURNS MIXED... Link for todays video. Stocks turned mixed on Tuesday. The Russell 2000 ETF (IWM) and S&P 400 MidCap Index (MDY) spent most of the day in positive territory, but the Nasdaq 100 ETF (QQQQ) spent most of the day in negative territory. In the middle,...
READ MORE
MEMBERS ONLY

Nasdaq Lags, But Gaps Prevail
by Arthur Hill,
Chief Technical Strategist, TrendInvestorPro.com
-Market Overview
-Stock Setups: AMZN, AZO, BA, DRI, ERTS, HAS, POT, RIMM
-Link to today's video.
-Next update will be Friday (August 7) by 7AM ET.
*****************************************************************
Market Overview
Stocks rallied on Monday with a fairly broad-based move. The major indices gained 1.5% on average and all...
READ MORE
MEMBERS ONLY

Transports Near January High
by Arthur Hill,
Chief Technical Strategist, TrendInvestorPro.com
Despite rising oil prices, the Dow Transports surged on Monday with a move above 3600. This key average is now within spitting distance of its January high. Also of note, the Dow Industrials broke above its January high last month....
READ MORE
MEMBERS ONLY
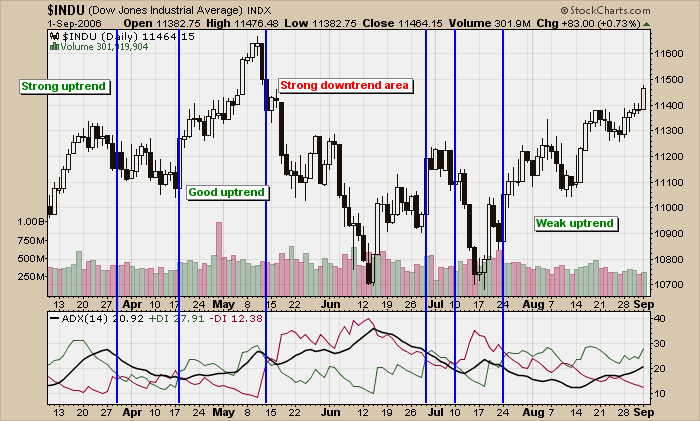
TRENDING UP, DOWN OR SIDEWAYS?
Hello Fellow ChartWatchers,
Here's an article that first appeared in 2006 about using the ADX indicator. With lots of stocks starting to trend upwards now, I thought it was a good time to revisit this topic. Enjoy! - Chip
Trend analysis is one of the most important technical analysis...
READ MORE
MEMBERS ONLY
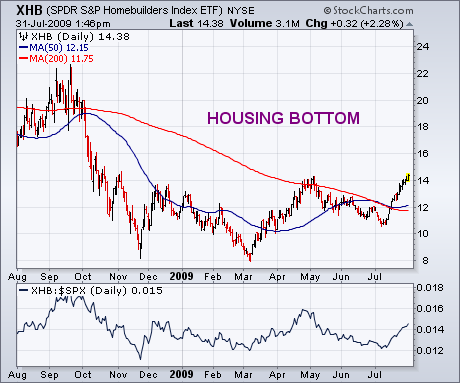
ITB VERSUS XHB
by John Murphy,
Chief Technical Analyst, StockCharts.com
On Monday, I wrote a bullish message on the homebuilding group and suggested using the SPDR S&P Homebuilding ETF (XHB) as one way to participate in the housing recovery. I pointed out, however, that the XHB has a relatively heavy weighting in a lot of housing-related stocks...
READ MORE
MEMBERS ONLY
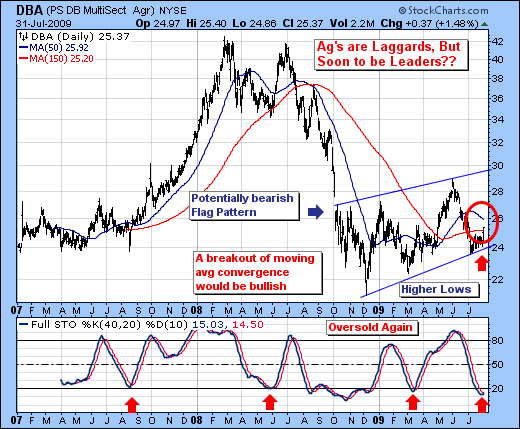
COMMODITY SECTOR PICKING UP
by Richard Rhodes,
Founder and President, Rhodes Capital Management and Rhodes Trading Group
On Thursday and Friday of last week, we saw the US dollar resume its downtrend, and the commodity sector begin to pick up participation as a result. This is likely to continue into the future as the US dollar is destined for lower lows; thus we are quite interested in...
READ MORE
MEMBERS ONLY
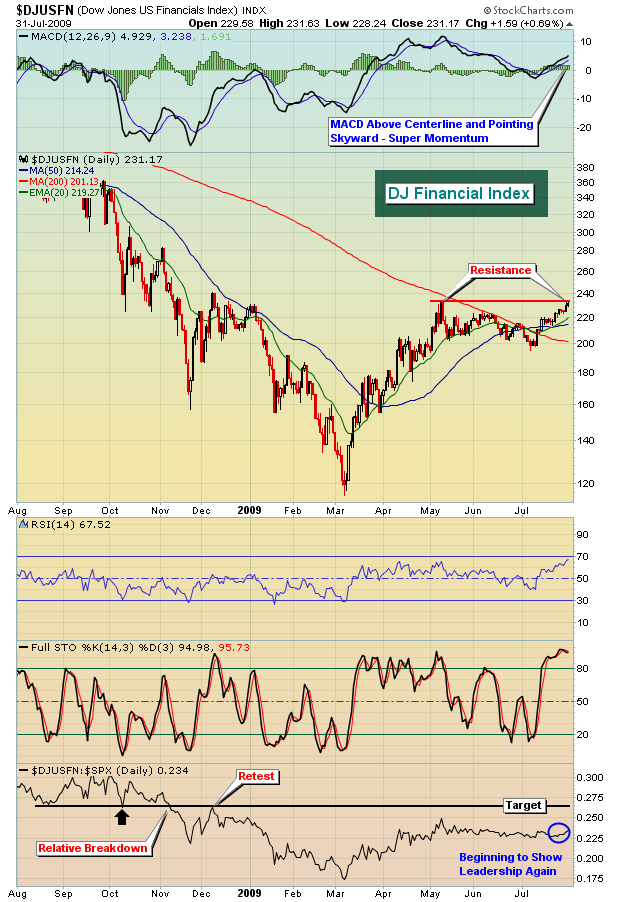
FINANCIALS TO THE RESCUE?
by Tom Bowley,
Chief Market Strategist, EarningsBeats.com
During the initial phase of the market recovery, from the March lows to the early May highs, financials were a primary driver of the move. Since that time, financials have lagged badly as sector rotation has caused money to flee to other, better-performing sectors over the last 8 weeks...
READ MORE
MEMBERS ONLY
HOPING FOR A PULLBACK
by Carl Swenlin,
President and Founder, DecisionPoint.com
Since the price lows of early-July, the market has moved relentlessly higher, penetrating the important resistance posed by the 200-EMA. When this rally began, a narrow window of fairly low-risk opportunity was presented. Those who missed it are now hoping that prices will pull back far enough...
READ MORE
MEMBERS ONLY
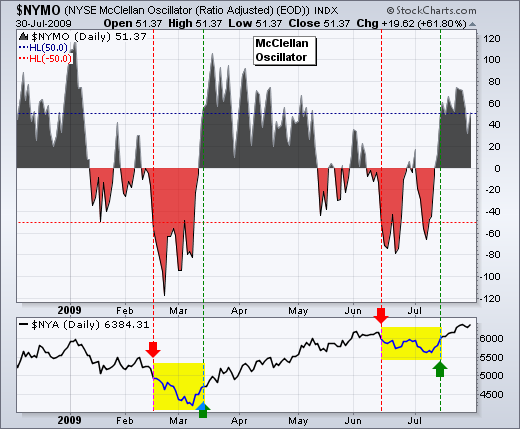
McClellan Oscillators Remain Bullish
by Arthur Hill,
Chief Technical Strategist, TrendInvestorPro.com
The McClellan Oscillators moved from bearish to bullish with the July surge in stocks. Basically, the McClellan Oscillator is the 19-day EMA of Net Advances less the 39-day EMA of Net Advances (advances less declines). As the difference of two moving averages, this indicator oscillates above/below the...
READ MORE
MEMBERS ONLY

ITB GIVES PURER HOMEBUILDING PLAY THAN XHB -- HOUSING STOCKS TELL US SOMETHING ABOUT THE HOUSING INDUSTRY -- SECOND EDITION OF THE VISUAL INVESTOR MAKES FOR GOOD SUMMER READING -- TWO WEEK HIATUS
by John Murphy,
Chief Technical Analyst, StockCharts.com
ITB VERSUS XHB... On Monday, I wrote a bullish message on the homebuilding group and suggested using the SPDR S&P Homebuilding ETF (XHB) as one way to participate in the housing recovery. I pointed out, however, that the XHB has a relatively heavy weighting in a lot of...
READ MORE
MEMBERS ONLY
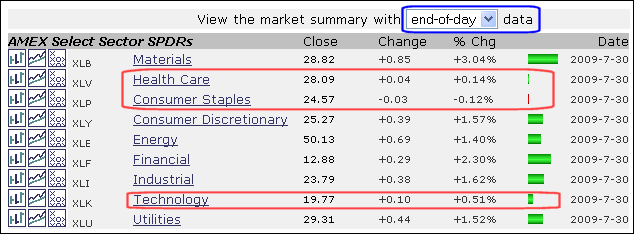
Techs Lag for a Day
by Arthur Hill,
Chief Technical Strategist, TrendInvestorPro.com
The market summary page provides an excellent overview of market performance, both end-of-day and intraday. You can change the setting at the top. Notice that materials led the market on Thursday, while healthcare, consumer staples and technology lagged. It is only one day, but relative weakness in technology...
READ MORE
MEMBERS ONLY
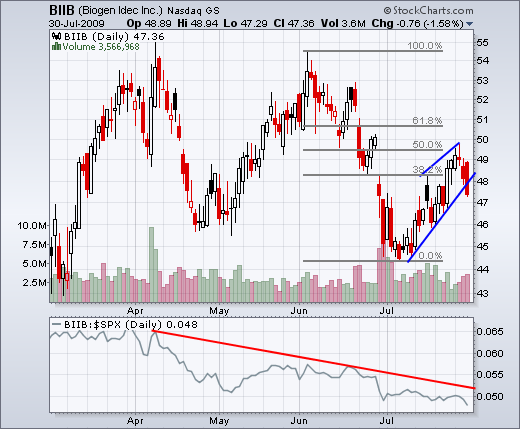
A Breakout for KEY and Weakness for ERTS
by Arthur Hill,
Chief Technical Strategist, TrendInvestorPro.com
- Charts Worth Watching: BIIB, DHR, ERTS, GPS, HAS, JBHT, KEY, LMT, LUB, MDT
- Link to today's video.
- Next update will be Tuesday (August 4) by 7AM ET.
*****************************************************************
After retracing 50% of its prior decline, Biogen Idec (BIIB) broke wedge support with a sharp decline over the last two...
READ MORE
MEMBERS ONLY
Minding Gaps and Short-Term Momentum
by Arthur Hill,
Chief Technical Strategist, TrendInvestorPro.com
- Medium-term Outlook Remains Bullish
- Short-term Situation is Overbought
- Late Selling Pressure
- Mind the Gap
- 60-minute Momentum
- Breadth Overview
- AAII Survey Flips
- A look at Bonds and the Dollar
-Link to today's video.
- Next update will be Tuesday (August 4) by 7AM ET.
*****************************************************************
Stock Market Overview...
READ MORE
MEMBERS ONLY

SPY TRACES OUT POSSIBLE BROADENING FORMATION - BONDS CLOSE STRONG - CONSUMER DISCRETIONARY SPDR CONTINUES TO LEAD - FINANCE SECTOR SPDR HOLDS BREAKOUT - SCHWAB AND MORGAN STANLEY SURGE - REGIONAL BANK ETF BREAKS RESISTANCE
by John Murphy,
Chief Technical Analyst, StockCharts.com
OVERBOUGHT CONDITIONS REMAIN... Link for todays video. The major index ETFs have remained overbought for two weeks now. Charts 1, 2 and 3 show the S&P 500 ETF (SPY), Nasdaq 100 ETF (QQQQ) and Russell 2000 ETF (IWM) with the Commodity Channel Index (CCI). John Murphy and I...
READ MORE
MEMBERS ONLY
Pound ETF Forms Ascending Triangle
by Arthur Hill,
Chief Technical Strategist, TrendInvestorPro.com
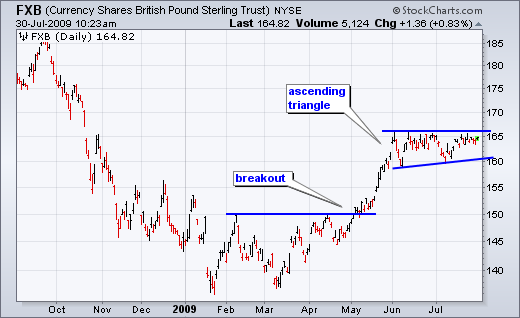
After a breakout and surge from March to May, the British Pound ETF (FXB) consolidated with an ascending triangle over the last two months. Notice how FXB hit resistance at 165 a number of times since early June. Also notice that the early July reaction low is higher than the...
READ MORE
MEMBERS ONLY

INTERMARKET TURMOIL COULD AFFECT STOCKS - DOLLAR FINDS SUPPORT - STRONG DOLLAR HITS GOLD - OIL DECLINES FROM KEY RETRACEMENT - BONDS BOUNCE OFF KEY RETRACEMENT
by John Murphy,
Chief Technical Analyst, StockCharts.com
INTERMARKET CHANGES COULD BE BEARISH FOR STOCKS ... Link for todays video. There has been a noticeable shift in the intermarket arena over the last few days. First, lets back up and look at intermarket relationships during the July rally. The S&P 500 bottomed the second week of July...
READ MORE
MEMBERS ONLY

Nasdaq is 10% Above 200-day EMA
by Arthur Hill,
Chief Technical Strategist, TrendInvestorPro.com
In less than 9 months, the Nasdaq has gone from being 40% below its 200-day EMA to being 10% above its 200-day EMA. Talk about a huge swing. The percentage difference was determined using the Percentage Price Oscillator (1,200,1). This setting reflects the percentage difference between...
READ MORE
MEMBERS ONLY
Freeport McMoran Hits the June High
by Arthur Hill,
Chief Technical Strategist, TrendInvestorPro.com
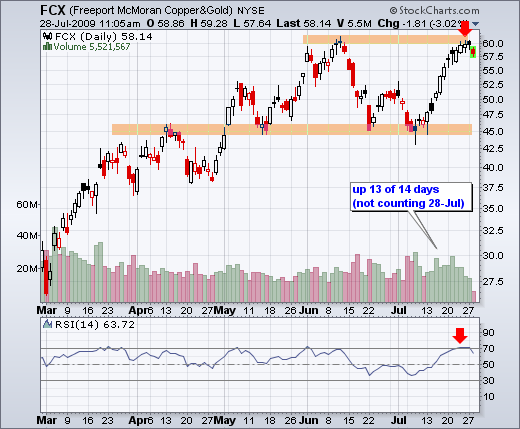
Freeport McMoran Copper & Gold (FCX) kept pace with the Nasdaq by advancing 13 of the last 14 days. In the process, the stock surged to its June high, which may offer resistance. Also notice that RSI moved above 70 to become overbought.
Click this chart to see more details....
READ MORE
