MEMBERS ONLY

SPY BATTLES SUPPORT - RETAIL HOLDRS BREAK SUPPORT - REGIONAL BANKS REMAIN WEAK - REVIEWING THE 2002-2003 BASING PROCESS - PROJECTING PULLBACK TARGETS FOR SPY

by John Murphy,
Chief Technical Analyst, StockCharts.com
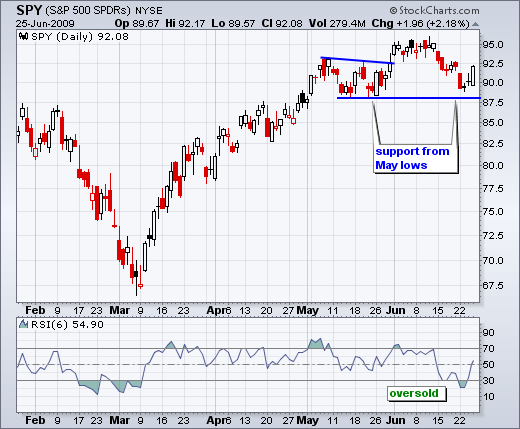
SPY AND DIA BATTLE SUPPORT... Link for todays video. After sharp declines in mid June and early July, the S&P 500 ETF (SPY) and Dow Diamonds (DIA) are testing support from the May lows. Chart 1 shows SPY with a head-and-shoulders pattern extending back to May....
READ MORE
MEMBERS ONLY
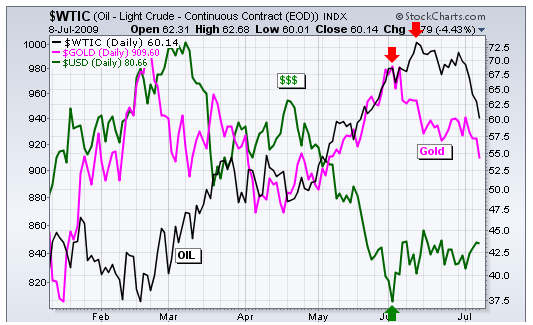
Dollar Firms as Oil and Gold Slip

by Arthur Hill,
Chief Technical Strategist, TrendInvestorPro.com
June witnessed a change in inter-market dynamics. The US Dollar Index ($USD) bounced at the beginning of June while the Gold-Continuous Futures ($GOLD) and West Texas Intermediate ($WTIC) declined in June. Gold started down first with a move lower in early June. Oil followed by moving lower the...
READ MORE
MEMBERS ONLY

YEN SURGES - EURO FAILS TO HOLD BREAKOUT - DOLLAR REMAINS IN DOWNTREND - GOLD PLUNGES ALONG WITH OIL - SPY STALLS NEAR NECKLINE BREAK - SECTOR ROTATIONS REFLECT DEFENSIVE POSTURING
by John Murphy,
Chief Technical Analyst, StockCharts.com
YEN GETS A BIG MOVE... Link for todays video. The Yen ETF (FXY) surged over 2% as money moved into relative safety. According to Bloomberg, the Yen advanced against its 16 biggest trading partners (other currencies). The biggest gains came against the South African Rand and the Australian Dollar, two...
READ MORE
MEMBERS ONLY
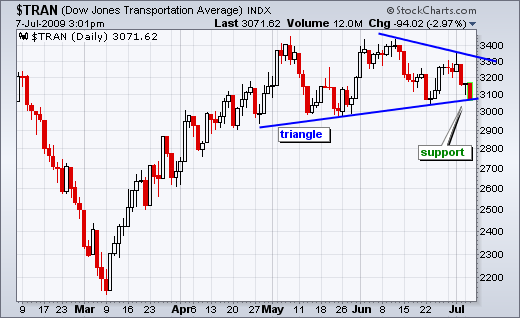
Transports Test Triangle Support
by Arthur Hill,
Chief Technical Strategist, TrendInvestorPro.com
After forming a lower high last week, the Dow Transports declined to triangle support with a sharp move lower the last three days. As of 3PM ET on Tuesday, the Average was down over 8% from last week's high. A triangle break would be bearish and call for...
READ MORE
MEMBERS ONLY

MARKET INDEXES BREAK MORE SUPPORT LEVELS AS VOLATILITY RISES -- SO DOES THE PUT/CALL RATIO -- RISING YEN SIGNALS MOVE TO LOWER RISK -- CRUDE OIL IS FALLING ALONG WITH STOCKS
by John Murphy,
Chief Technical Analyst, StockCharts.com
NASDAS 100 VIOLATES 50-DAY AVERAGE AS VOLATILITY RISES... I wrote yesterday that rising volatility measures for the Nasdaq (VXN) and the S&P 500 (VIX) were starting to rally which would be bearish for stocks. I also showed the Nasdaq 100 threatening to break its 50-day moving...
READ MORE
MEMBERS ONLY

Charts Worth Watching
by Arthur Hill,
Chief Technical Strategist, TrendInvestorPro.com
- Charts Worth Watching: AMAT, APH, ARO, BWA, DIA, HCN, IWM, JWN, KSS, MCD, OLN, PSA, QQQQ, SPY
- Link to today's video.
- Next update will be Friday (July 10) by 9AM ET.
*****************************************************************
Short-term Gaps and Support Breaks
Last Tuesday I led off with the 60-minute charts showing...
READ MORE
MEMBERS ONLY

RTH Breaks May Low
by Arthur Hill,
Chief Technical Strategist, TrendInvestorPro.com
The Retail HOLDRS (RTH) broke below the May low with a sharp decline last week. Overall, it appears that a double top formed in May-June. The support break confirms the pattern and this ETF could retrace around 50% of its prior advance.
Sharpcharts users can click this chart to...
READ MORE
MEMBERS ONLY

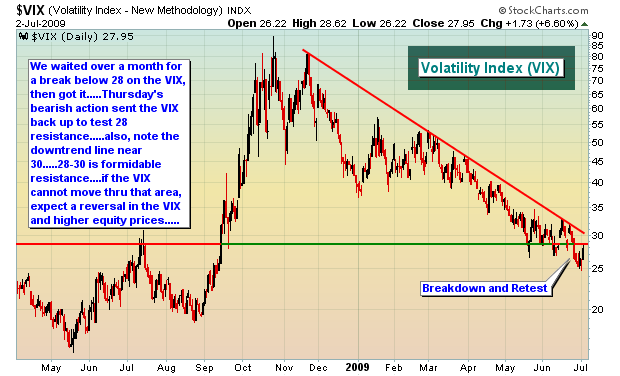
VOLATILITY INDEXES ARE BOUNCING OFF MAJOR SUPPORT LINES -- THE VIX ALSO HAS A SEASONAL TENDENCY TO BOTTOM IN JULY -- RISING VOLATILITY IS USUALLY ASSOCIATED WITH A WEAKER STOCK MARKET
by John Murphy,
Chief Technical Analyst, StockCharts.com
BOUNCING VIX TESTS 50-DAY MA... The CBOE Volatility (VIX) Index has been falling since March (as stocks have risen). The VIX peak in March near 53 coincided with the stock market bottom. A falling VIX is good for stocks since they trend in opposite directions. Correspondingly, a rising VIX...
READ MORE
MEMBERS ONLY
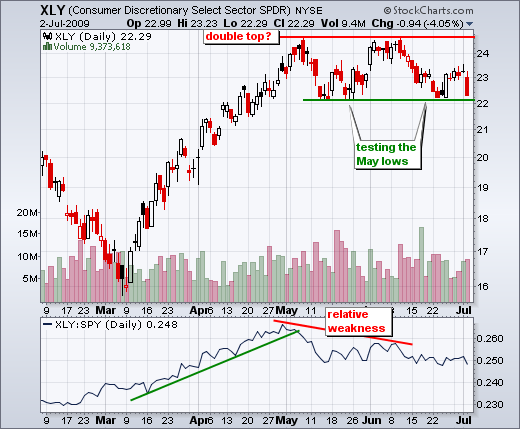
Consumer Discretionary Stocks Get Rocked
by Arthur Hill,
Chief Technical Strategist, TrendInvestorPro.com
Non-farm payrolls declined 467,000 for June, which was worse than expected. Stocks took the news hard with a broad based decline on Thursday. The major indices were down 2-4% on the day, while all sector ETFs were down over 2% with the Consumer Discretionary SPDR (XLY) leading...
READ MORE
MEMBERS ONLY
CORRECTIVE MOVE OR SIGNIFICANT DOWNTREND?

by Tom Bowley,
Chief Market Strategist, EarningsBeats.com
I believe it's the former. Thursday's selloff after the June Employment report was a bit scary, particularly if you're only looking at the magnitude of the point losses. But, in my opinion, no key support levels have been violated. That means the beginning of...
READ MORE
MEMBERS ONLY
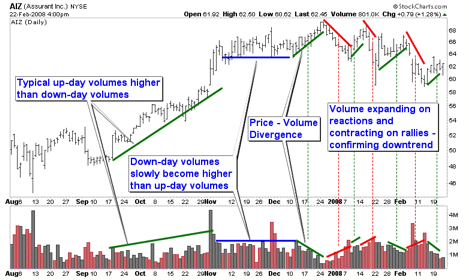
TECHNICAL ANALYSIS 101 - PART 10
This is the tenth part of a series of articles about Technical Analysis from a new course we're developing. If you are new to charting, these articles will give you the "big picture" behind the charts on our site. if you are an "old hand&...
READ MORE
MEMBERS ONLY
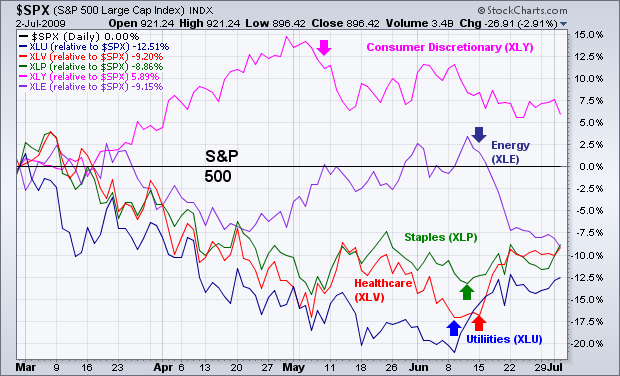
DEFENSIVE ROTATIONS DURING JUNE
by John Murphy,
Chief Technical Analyst, StockCharts.com
A sign that investors have turned more negative over the last month is the rotation out of economically-sensitive groups (like consumer discretionary and energy stocks) and into defensive groups (like utilities, consumer staples, and healthcare). Chart 3 shows relative strength lines for those five groups (versus a flat S&...
READ MORE
MEMBERS ONLY
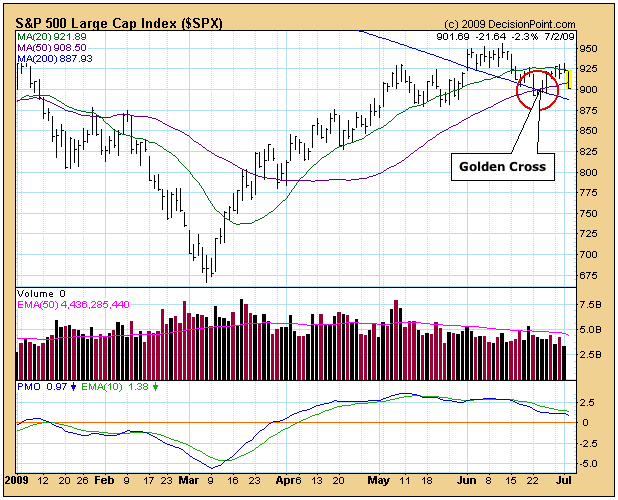
GOLDEN CROSS

by Carl Swenlin,
President and Founder, DecisionPoint.com
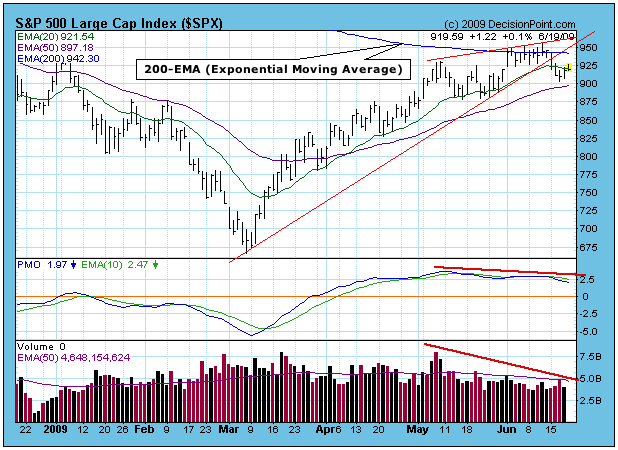
About a week ago the S&P 500 50-SMA (simple moving average) crossed up through the 200-SMA. (See chart below.) This is known as a "Golden Cross" because it is interpreted by many as a sign that the market is turning long-term bullish. Of...
READ MORE
MEMBERS ONLY

TSE Hits Resistance
by Arthur Hill,
Chief Technical Strategist, TrendInvestorPro.com
With a 3000 point surge the last few months, the S&P TSX Composite ($TSE) broke through resistance and CCI moved above +100. Both events are bullish, but the index looks vulnerable to a pullback. First, CCI moved back below +100. Second, the index is up 3000 points without...
READ MORE
MEMBERS ONLY

SPRING RALLY ENDS AS S&P 500 FULFILLS INITIAL UPSIDE OBJECTIVES -- A SHORT-TERM HEAD AND SHOULDERS TOP COULD HELP COMPLETE A MAJOR HEAD AND SHOULDERS BOTTOM -- SECTOR ROTATION TURNS MORE DEFENSIVE
by John Murphy,
Chief Technical Analyst, StockCharts.com
S&P 500 HAS FULFILLED UPSIDE OBJECTIVES FOR NOW ... If you've been reading our market messages over the past couple of weeks, you know that we've called for an end to the spring rally and the start of a normal corrective process. There are several...
READ MORE
MEMBERS ONLY

STOCKS DECLINE AFTER JOBS REPORT- CLUES FROM THE 1998 SURGE - WATCHING THE MAY LOWS - MONTHLY TREND REMAINS DOWN - VOLATILITY CONTINUES TO FALL - CUMULATIVE NET NEW HIGHS CONTINUES TO RISE
by John Murphy,
Chief Technical Analyst, StockCharts.com
EMPLOYMENT REPORT ROCKS STOCKS... Non-farm payrolls declined 467,000 for June, which was worse than expected. Stocks took the news hard with a broad based decline in early trading. The major indices were down over 2% around noon. All sector ETFs were lower with the Consumer Discretionary SPDR (XLY)...
READ MORE
MEMBERS ONLY
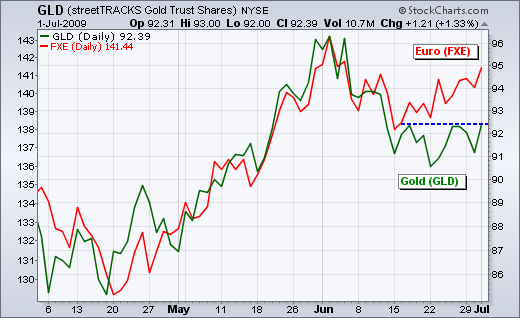
Gold Lags the Euro
by Arthur Hill,
Chief Technical Strategist, TrendInvestorPro.com
Gold normally moves with the Euro, but the yellow metal has not been keeping up the last few weeks. Notice how the Euro ETF (FXE) bottomed on 15-June and moved higher the last 2-3 weeks. However, the Gold ETF (GLD) did not bottom until 22-June and has...
READ MORE
MEMBERS ONLY

STOCKS GIVE UP EARLY GAINS - BEARISH FAILURE SWING FOR RSI - INTEL AND TEXAS INSTRUMENTS LEAD SEMIS - DOLLAR DIPS AS RISK APPETITE INCREASES - GOLD BOUNCES OFF SUPPORT - OIL FAILS TO HOLD EARLY GAINS
by John Murphy,
Chief Technical Analyst, StockCharts.com
STOCKS GIVE UP EARLY GAINS... Link for todays video.
Stocks surged in early trading with the major index ETFs sporting nice gains after the first hour of trading. However, there was no follow through as stocks drifted lower the rest of the day. Charts 1, 2 and 3 show 60-...
READ MORE
MEMBERS ONLY
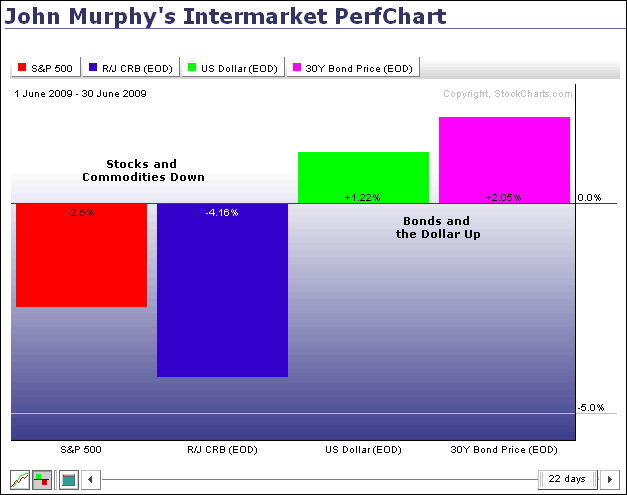
Stocks and Commodities Down in June
by Arthur Hill,
Chief Technical Strategist, TrendInvestorPro.com
From John Murphy's intermarket perfchart, we can see that stocks (S&P 500) and commodities ($CRB) were down for the month of June. In contrast, Bonds ($USB) and the Dollar ($USD) were up. Strength in the greenback weighed on commodities. In addition, it appears that strength in...
READ MORE
MEMBERS ONLY
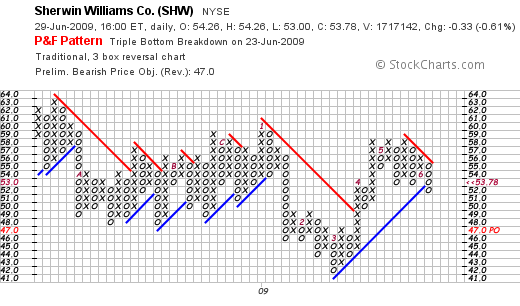
A Triple Bottom Breakdown for Sherwin Williams
by Arthur Hill,
Chief Technical Strategist, TrendInvestorPro.com
From the PnF scans comes Sherwin Williams (SHW) with a clear break below the May lows. On the PnF chart, you can see the number 5 to denote the start of May and then two reaction lows. After the number 6 (June), SHW formed another column of O's...
READ MORE
MEMBERS ONLY

DROP IN CONSUMER CONFIDENCE WEIGHS ON STOCKS AS MARKET ENDS FIRST HALF OF YEAR -- A SHORT-TERM TOP MAY BE FORMING -- COMMODITIES ALSO SELL OFF AS DOLLAR BOUNCES -- TIPS REMAIN A SECOND QUARTER FAVORITE
by John Murphy,
Chief Technical Analyst, StockCharts.com
S&P 500 MAY END QUARTER ON FLAT NOTE... A drop in June consumer confidence to 49.3 from May's revised reading of 54.8 has caused some nervous selling in stocks as the market ends the month, quarter, and first half of the year. It remains...
READ MORE
MEMBERS ONLY
Charts Worth Watching
by Arthur Hill,
Chief Technical Strategist, TrendInvestorPro.com
- Charts featured: DHI, DIA, IBB, IWM, JAH, JPM, LUV, MMC, PENN, PNRA, QQQQ, SPY, USB, WFC, XHB, XLF, XLY
- Link to today's video.
- Next update will be Tuesday (July 7) by 9AM ET.
*****************************************************************
As noted last week, the current trading environment remains tricky for a number of technical...
READ MORE
MEMBERS ONLY

FedEx Hits Channel Resistance
by Arthur Hill,
Chief Technical Strategist, TrendInvestorPro.com
After surging on good volume, FedEx (FDX) hit channel resistance around 57. Notice that FDX peaked in early May and then worked its way lower the last eight weeks. This series of lower lows and lower highs defines the channel, which is also an 8-week downtrend. Look for a...
READ MORE
MEMBERS ONLY

DOW AND S&P 500 BOUNCE OFF MAY LOW -- A SHORT-TERM TOP, HOWEVER, COULD LEAD TO A 38%-50% CORRECTION OF THE SPRING RALLY -- 200-DAY AVERAGES PROVIDE SUPPORT BUT ARE STILL DROPPING
by John Murphy,
Chief Technical Analyst, StockCharts.com
RUSSELL RE-BALANCING CAUSES LATE VOLUME SPIKE... In yesterday's message, I showed the Dow and S&P 500 bouncing off chart support near their May lows. The ability to bounce off initial support prevented a more serious breakdown. I also suggested, however, that the late-week bounce...
READ MORE
MEMBERS ONLY

Dow Bullish Percent Gets Frothy
by Arthur Hill,
Chief Technical Strategist, TrendInvestorPro.com
The DJIA Bullish Percent Index ($BPINDU) moved above 70% in June and remains at lofty levels. Mid December and early January were the last two occasions above 70%. Currently, 73% of the Dow stocks (30) are on Point & Figure buy signals. Even though this is technically bullish, an advance...
READ MORE
MEMBERS ONLY

DOW BOUNCES OFF MAY LOW WHILE NASDAQ HOLDS MAY HIGH -- STOCK INDEXES, HOWEVER, ARE STILL TRADING BELOW LAST WEEK'S HIGH -- MOVING AVERAGE LINES HAVE PROVIDED SUPPORT DURING RECENT PULLBACK
by John Murphy,
Chief Technical Analyst, StockCharts.com
DOW AND S&P BOUNCE OFF MAY LOWS... During any market pullback, the first layer of support is usually a previous reaction low. That's why we chose the May low as our initial downside target for the Dow and S&P 500 indexes. Arthur Hill showed...
READ MORE
MEMBERS ONLY
Charts Worth Watching
by Arthur Hill,
Chief Technical Strategist, TrendInvestorPro.com
Charts featured: SPY, DIA, GRMN, HOG, PFCB, FITB, HCBK, JPM, LAZ, MMC, USB, WFC, AMAT, NVDA, TIBX.
- Click here for today's video.
- Next update will be Tuesday (June 30) by 9AM ET.
*****************************************************************
Trading remains tricky as we approach the end of the second quarter. There is evidence that...
READ MORE
MEMBERS ONLY

DIA BOUNCES OFF SUPPORT - QQQQ SHOWS RELATIVE STRENGTH - MICROSOFT PACES PC STOCKS - THE MAY LOWS ARE HOLDING - XLV LEADS THE MARKET - LLY AND BMY BREAK OUT - FINANCE SECTOR STILL LAGGING - JPM AND WFC EDGE LOWER
by John Murphy,
Chief Technical Analyst, StockCharts.com
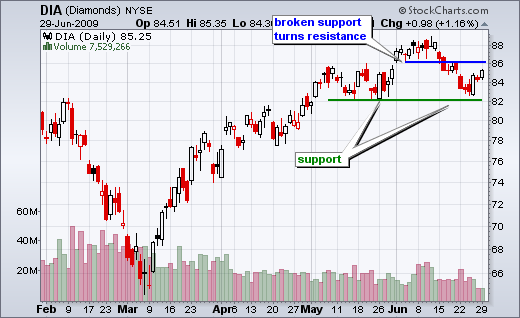
DIA BOUNCES OFF SUPPORT... Chart 1 shows the Dow Diamonds (DIA) bouncing off support from the May lows with a bullish engulfing on Thursday. As DIA tested support, notice that the Commodity Channel Index (CCI) became oversold with the decline below 84. The combination of oversold conditions and support set...
READ MORE
MEMBERS ONLY

HP Holds the Breakout
by Arthur Hill,
Chief Technical Strategist, TrendInvestorPro.com
While the S&P 500 took a hit in June, Hewlett-Packard (HPQ) managed to hold its breakout and stay relatively strong. HP broke triangle resistance in early June. Broken resistance then turned into support the last three weeks. Also notice that the price relative moved higher throughout June....
READ MORE
MEMBERS ONLY

DOW TESTS MAY LOWS - TRANSPORTS FORM DOUBLE TOP - RETAIL HOLDRS SHOWS RELATIVE WEAKNESS - WAL-MART WEIGHS ON RETAIL - SMH BREAKS PITCHFORK TRENDLINE - EURO GIVES BACK GAINS - GOLD FIRMS AT SUPPORT
by John Murphy,
Chief Technical Analyst, StockCharts.com
INDUSTRIALS AND TRANSPORTS TEST MAY LOWS... After a sharp decline in June, a number of key indices, ETFs and stocks are testing support from their May lows. First up, chart 1 shows the Dow Industrials with support from broken resistance around 8200. This support area was confirmed with a couple...
READ MORE
MEMBERS ONLY
Yield Curve Remains Steep
by Arthur Hill,
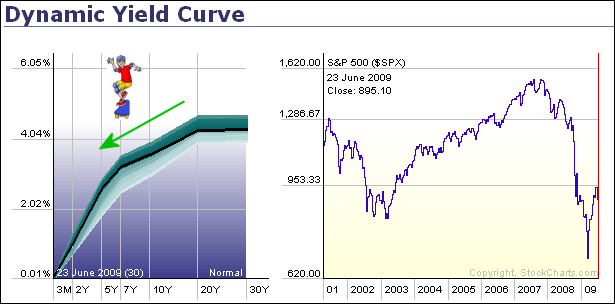
Chief Technical Strategist, TrendInvestorPro.com
A static shot of the dynamic yield curve reveals a curve steep enough to temp a skateboarder. As this curve shows, interest rates start low at the short end and rise as the maturities lengthen. Typically, a steep yield curve reflects loose monetary policy designed to stimulate the economy and...
READ MORE
MEMBERS ONLY
Dow Tests Support
by Arthur Hill,
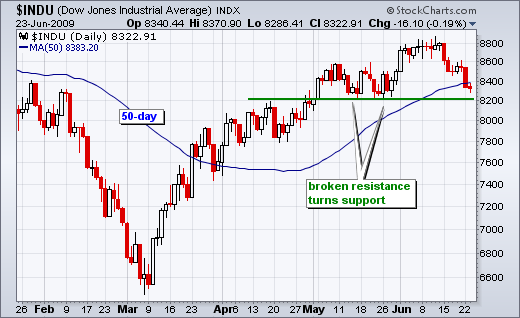
Chief Technical Strategist, TrendInvestorPro.com
The Dow Industrials is testing support around 8200. A key tenet of technical analysis is that broken resistance turns into support. After breaking 8200 in early May and this level turned into support twice in May. With a sharp decline in June, the Dow is once again poised for a...
READ MORE
MEMBERS ONLY

Charts Worth Watching
by Arthur Hill,
Chief Technical Strategist, TrendInvestorPro.com
- Index ETF Charts: SPY, $RUT, $OEX, $NAHL
-Stock Charts: WHR, XHB, DHI, CAKE, KR, SLE, WMT, FLO, INTC, KLAC, INTC
-Today's video will be posted by 10:15 AM ET
- The next update will be Friday (June 26) by 9AM ET.
*****************************************************************
The major index ETFs broke down on...
READ MORE
MEMBERS ONLY

Watching for Tech Leadership
by Tom Bowley,
Chief Market Strategist, EarningsBeats.com
The tech-laden NASDAQ 100 showed considerable relative strength prior to the market bottom in March 2009. Should the NDX:SPX relative ratio break above 1.625, I believe it could lead to additional market strength.
-Tom Bowley
Join Tom and the Invested Central Team at www.investedcentral.com. Invested...
READ MORE
MEMBERS ONLY

UPS Leads the Market
by Arthur Hill,
Chief Technical Strategist, TrendInvestorPro.com
UPS is a key part of the Dow Transports and perhaps a leading indicator for the stock market. Notice how the price relative (UPS:$SPX ratio) bottomed ahead of the stock market in March. UPS started showing relative strength before the actual market bottom. Most recently, the price relative peaked...
READ MORE
MEMBERS ONLY

EMERGING MARKETS LEAD DECLINE IN GLOBAL STOCKS AND COMMODITIES -- S&P 500 IS RETESTING ITS 200-DAY AVERAGE --TRANSPORTS, REITS, AND CHIPS HAVE BROKEN 50-DAY LINES AS DOWNSIDE CORRECTION DEEPENS -- BONDS AND DOLLAR BOUNCE
by John Murphy,
Chief Technical Analyst, StockCharts.com
S&P 500 RETESTS 200-DAY AVERAGE ... My final chart on Friday showed hourly bars for the S&P 500 SPDRs starting to back off from overhead resistance starting at 92.76 which translated into 927 for the S&P 500. I suggested that a failure at...
READ MORE
MEMBERS ONLY
TECHNICAL ANALYSIS 101 - PART 9
This is the ninth part of a series of articles about Technical Analysis from a new course we're developing. If you are new to charting, these articles will give you the "big picture" behind the charts on our site. if you are an "old hand&...
READ MORE
MEMBERS ONLY
BPNYA TURNS DOWN FROM OVERBOUGHT TERRITORY
by John Murphy,
Chief Technical Analyst, StockCharts.com
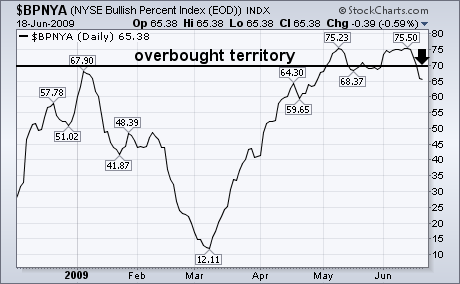
I recently showed the NYSE Bullish Percent Index (BPNYA) having reached overbought territory over 70. the BPNYA is the percent of NYSE stocks that are in point & figure uptrends. I suggested that a drop below the May trough at 68 could signal a short-term top. Chart 1 shows...
READ MORE
MEMBERS ONLY
BREAKDOWN AND SNAPBACK
by Carl Swenlin,
President and Founder, DecisionPoint.com
On Monday, in predictable fashion, prices broke down from the ascending wedge pattern we've been watching. Then, after a correction of 5%, prices began a snapback move up toward the recently violated support line (now overhead resistance). Prior to the breakdown, you will notice that overhead resistance was...
READ MORE
MEMBERS ONLY
NOT MUCH TO LIKE ABOUT HOUSING...

by Richard Rhodes,
Founder and President, Rhodes Capital Management and Rhodes Trading Group
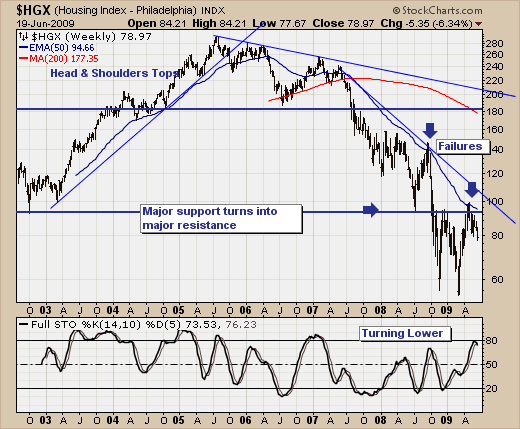
As the "green shootists" shout from the rooftops about the bottoming of the US and world economy; we think a technical and the Housing Index ($HGX) in particular offer keen insight as to whether one component of what led the US into the housing & credit market bubble....
READ MORE
