MEMBERS ONLY
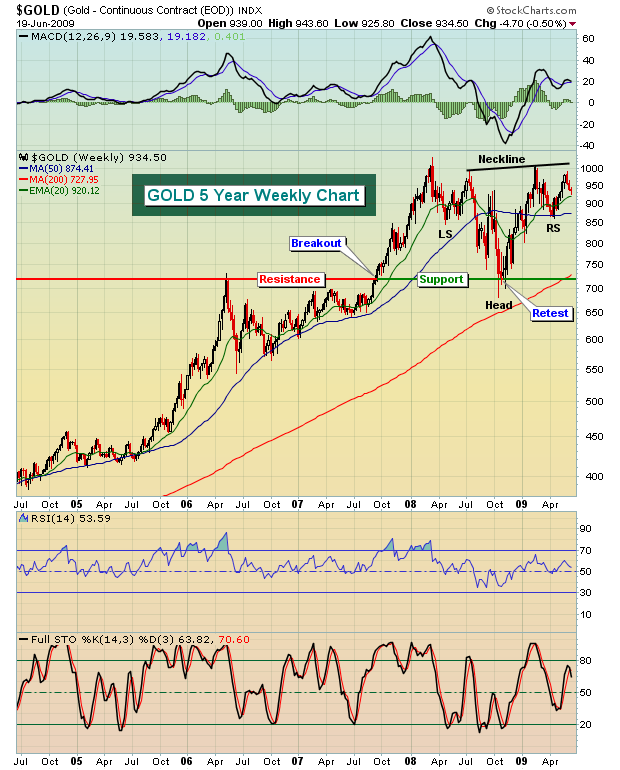
GOLD SETTING UP FOR MOVE HIGHER

by Tom Bowley,
Chief Market Strategist, EarningsBeats.com
There are lots of questions in the market regarding possible inflation, deflation, and general market weakness. One way to hedge against all three is to play gold. Below is a long-term weekly chart that shows gold in a very bullish inverse head & shoulders continuation pattern. The current pattern...
READ MORE
MEMBERS ONLY
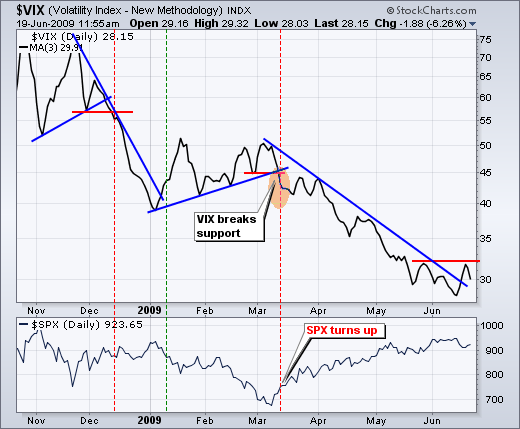
VIX BREAKS A TRENDLINE

by Arthur Hill,
Chief Technical Strategist, TrendInvestorPro.com
A downtrend in the S&P 500 Volatility Index ($VIX) underpins the current rally in the S&P 500. After all, decreasing fear gives way to confidence. The chart below shows the VIX as a 3-day SMA to smooth out daily fluctuations. The VIX broke support on...
READ MORE
MEMBERS ONLY

Volume Picks Up for SW Airlines
by Arthur Hill,
Chief Technical Strategist, TrendInvestorPro.com
After surging in March-April, SW Airlines (LUV) went into corrective mode with a falling wedge in May-June. This wedge is still falling, but volume on up days is starting to increase. The bounce in early June occurred on above average volume and Wednesday's volume was the...
READ MORE
MEMBERS ONLY

NYSE BULLISH PERCENT INDEX TURNS DOWN -- 13 AND 34 WEEK EMAS HAVEN'T CROSSED -- DON'T CONFUSE SHORT- AND LONG-TERM VIEWS -- THE 200-DAY AVERAGE HOLDS THE KEY TO SHORT-TERM MARKET DIRECTION

by John Murphy,
Chief Technical Analyst, StockCharts.com
BPNYA TURNS DOWN FROM OVERBOUGHT TERRITORY ... I recently showed the NYSE Bullish Percent Index (BPNYA) having reached overbought territory over 70. the BPNYA is the percent of NYSE stocks that are in point & figure uptrends. I suggested that a drop below the May trough at 68 could signal a...
READ MORE
MEMBERS ONLY
Charts Worth Watching
by Arthur Hill,
Chief Technical Strategist, TrendInvestorPro.com
- Charts Worth Watching: $USD, AAPL, BBBY, CHKP, CSCO, DHI, ENR, FXE, GLD, INTC, IWM, K, KFT, NVDA, PEP, QQQQ, SLE, SPY, SWK, WAG, WHR
- Click here for today's video.
The next update will be Tuesday (June 22) by 9AM ET.
*****************************************************************
It is touch-and-go in the stock...
READ MORE
MEMBERS ONLY
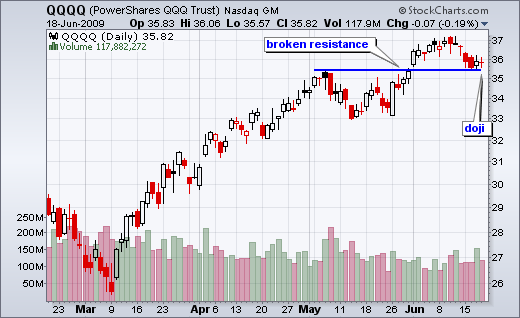
QQQQ Turns Indecisive
by Arthur Hill,
Chief Technical Strategist, TrendInvestorPro.com
The Nasdaq 100 ETF (QQQQ) formed a doji on Thursday to signal indecision at support. Doji look like plus signs because there is little change from open to close. In addition, notice that QQQQ closed in the middle of its high-low range. The candlestick looks like a small plus...
READ MORE
MEMBERS ONLY

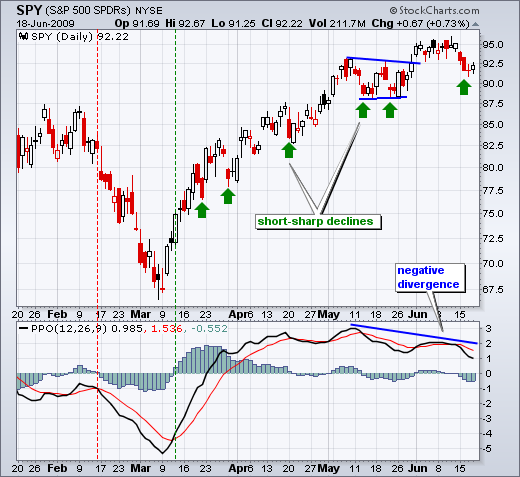
SPY HITS RESISTANCE ZONE - MEDIUM-TERM MOMENTUM REMAINS BULLISH FOR SPY - QQQQ STALLS NEAR BROKEN RESISTANCE - BREADTH CONTINUES TO WEAKEN - AD VOLUME LINE FORMS NEGATIVE DIVERGENCE - VIX NEARS DOWNTREND RESISTANCE
by John Murphy,
Chief Technical Analyst, StockCharts.com
SPY HITS RESISTANCE ON WEEKLY CHART... There is still a compelling case for a stock market correction or decline from current levels. Chart 1 show the S&P 500 ETF (SPY) surging over 40% from its March low without a correction. Even though the spring uptrend remains in place,...
READ MORE
MEMBERS ONLY
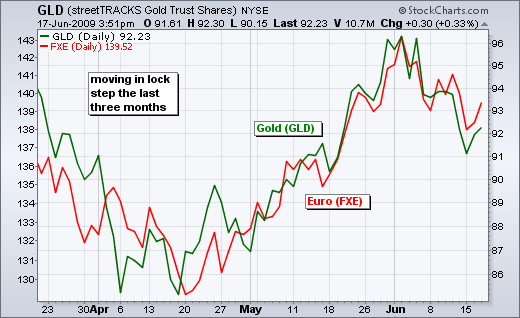
Euro and Gold Dancing Together
by Arthur Hill,
Chief Technical Strategist, TrendInvestorPro.com
The Euro ETF (FXE) and the Gold ETF (GLD) have been moving step-for-step over the last three months. In broad terms, both declined into mid April, advanced into early June and declined over the last two weeks....
READ MORE
MEMBERS ONLY

SEMICONDUCTORS STAY STRONG - HEALTHCARE REBOUNDS - BMY AND PFE PACE HEALTHCARE - BIOTECHS SURGE - AMGN AND GILD LEAD BIOTECHS HIGHER - INTERMARKET PICTURE FLIPS IN JUNE - TECHNOLOGY REMAINS A STRONG SECTOR
by John Murphy,
Chief Technical Analyst, StockCharts.com
SEMIS HOLD THE UPTREND... Link for todays video.
The Semiconductors HOLDRS (SMH) remains in an uptrend that has yet to reverse. Chart 1 shows SMH with Andrews Pitchfork (blue lines). The indicators icon is shown at the top of the price chart. After selecting the indicator, users then choose (click)...
READ MORE
MEMBERS ONLY

Triple Bottom Breakdown For CCL
by Arthur Hill,
Chief Technical Strategist, TrendInvestorPro.com
Carnival Corp (CCL) came up on the Triple Bottom Breakdown scan. After failing to hold its May breakout (blue arrow), the stock broke support with a sharp decline in June. You can probably see some other patterns at work here as well. Think Fibonacci, wedge and broken support....
READ MORE
MEMBERS ONLY

RESPONSES TO QUESTIONS ON MCCLELLANN OSCILLATORS, DOW THEORY WEEKLY SIGNALS, AND GOLDEN CROSSES -- THE BOTTOM LINE IS THAT GLOBAL STOCKS APPEAR TO BE ENTERING A DOWNSIDE CORRECTION -- TECHNICAL SIGNS SUGGEST THE SPRING RALLY HAS PROBABLY ENDED
by John Murphy,
Chief Technical Analyst, StockCharts.com
MCCLELLAN OSCILLATORS ARE NEGATIVE ... One of our readers points out that the McClellan Oscillators for the NYSE (NYMO) and the Nasdaq (NAMO) are both in negative territory and are showing negative divergence from their price indexes. The reader is right on both counts. On May 16, I pointed out the...
READ MORE
MEMBERS ONLY
Charts Worth Watching
by Arthur Hill,
Chief Technical Strategist, TrendInvestorPro.com
- Charts Worth Watching: $USD, BBY, CI, EL, GDX, GLD, IPCR, KMB, LLL, MHP, RTN, SPY, XLF , XLK, XLV, XLY
- Click here for today's video.
-The next update will be Friday (June 19) by 9AM ET.
*****************************************************************
With a sharp decline over the last two days, the major index ETFs...
READ MORE
MEMBERS ONLY

GLOBAL STOCKS AND COMMODITIES SLIDE AS DOLLAR REBOUNDS -- RAILS LEAD TRANSPORTS LOWER -- MAJOR INDEXES MAY RETEST 200-DAY MOVING AVERAGE LINES
by John Murphy,
Chief Technical Analyst, StockCharts.com
DOLLAR CONTINUES BOUNCE OFF DECEMBER LOW ... On Friday June 5, I showed the U.S. Dollar Index starting to bounce off chart support at its December low. I also showed the Euro pulling back from resistance at its December peak. I wrote that a drop in the Euro (dollar rally)...
READ MORE
MEMBERS ONLY
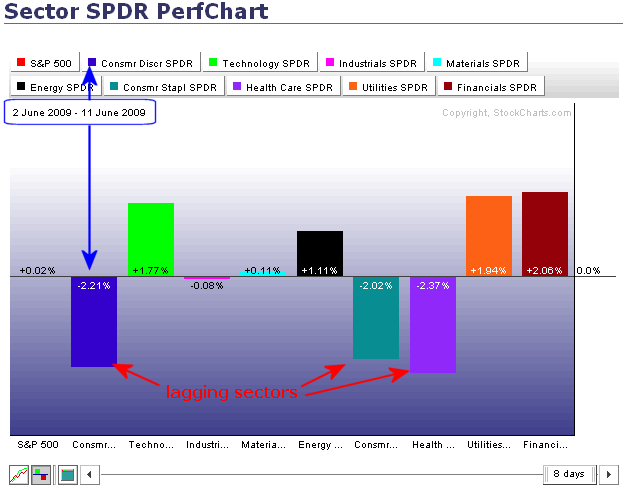
Consumer Discretionary Lagging in June
by Arthur Hill,
Chief Technical Strategist, TrendInvestorPro.com
The S&P Sector PerfChart from 2-June until 11-June shows the consumer staples, healthcare and consumer discretionary sectors lagging the broader market. Each is down over 2%, while the S&P 500 is up .02% (a fraction) over this timeframe. It is a strange trio, but...
READ MORE
MEMBERS ONLY

DOW THEORY UPDATE -- DOW TRANSPORTS FAIL TO CONFIRM LAST UPMOVE IN DOW INDUSTRIALS -- DOW THEORY OVERLAPS WITH ELLIOTT WAVES -- MAJOR DOWNSIDE OBJECTIVES WERE COMPLETED IN MARCH -- THE KEY NOW LIES WITH THE S&P 500 EXCEEDING ITS JANUARY HIGH
by John Murphy,
Chief Technical Analyst, StockCharts.com
JANUARY HIGHS ARE THE KEY ... One of our readers asked for an update on Dow Theory. For those of you not familiar with it, Dow Theory requires that the Dow Industrials and Transports must both exceed a previous peak to signal that a "confirmed" uptrend exists. The key...
READ MORE
MEMBERS ONLY

Charts Worth Watching
by Arthur Hill,
Chief Technical Strategist, TrendInvestorPro.com
- Charts Worth Watching: AEP, BDK, BMY, CNP, DIA, DKS, DUK, ENR, HD, IWM, IWM, JPM, KRE, LLY, LOW, PFE, QQQQ, RX, SO, SPY, TE, WHR, XLU, XLV, XLY
- Click here for today's video
- The next update will be Tuesday (June 16) by 9AM ET.
*****************************************************************
The major index ETFs...
READ MORE
MEMBERS ONLY

QQQQ Channels Higher
by Arthur Hill,
Chief Technical Strategist, TrendInvestorPro.com
June has been one choppy month, but the Nasdaq 100 ETF (QQQQ) continues to work its way higher within a rising channel. This channel features a series of higher highs and higher lows that define the 9 day uptrend....
READ MORE
MEMBERS ONLY

ENERGY STOCKS LEAD - BASE METALS SURGE - OIL CONTINUES ITS ADVANCE - GOLD MEETS RESISTANCE - DOLLAR ATTEMPTS TO FIRM AT SUPPORT - CONSUMER DISCRETIONARY SECTOR LAGS BROADER MARKET
by John Murphy,
Chief Technical Analyst, StockCharts.com
ENERGY STOCKS LEAD THE MARKET... The Energy SPDR (XLE) led the market higher with a surge above resistance on Thursday. Chart 1 shows XLE breaking above resistance from the November-January highs. Prior to this breakout, XLE broke triangle resistance in late April and again in late May. The energy...
READ MORE
MEMBERS ONLY

ANALYZING DIVERGENCES - PPO DIVERGENCES FORM IN IWM AND SPY - RSI BECOMES OVERBOUGHT FOR QQQQ - GAS AND INTEREST RATES CONTINUE TO RISE - REGIONAL BANK ETF SHOWS RELATIVE WEAKNESS
by John Murphy,
Chief Technical Analyst, StockCharts.com
DISSECTING DIVERGENCES ... There are some negative divergences to report, but first lets review the definition and look at some prior signals. A negative divergence occurs when the underlying security moves to a new high, but the indicator fails to exceed its prior high. This lower high in the indicator signals...
READ MORE
MEMBERS ONLY
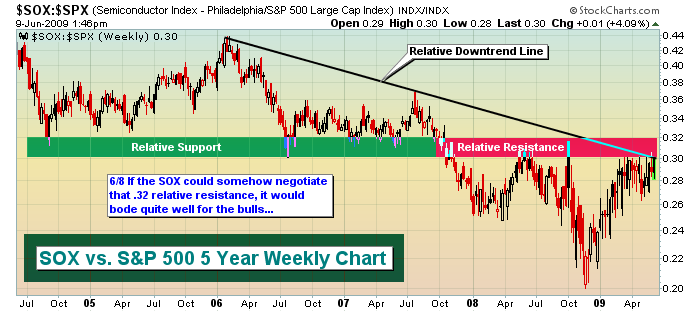
Semiconductors Leading The Charge
by Tom Bowley,
Chief Market Strategist, EarningsBeats.com
The semiconductor group has been very influential during the recent rally. In fact, the SOX has been outperforming the S&P 500 since late in 2008. A key relative resistance area has been approached, however. Whether the market can sustain a move higher could hinge significantly on how semiconductors...
READ MORE
MEMBERS ONLY
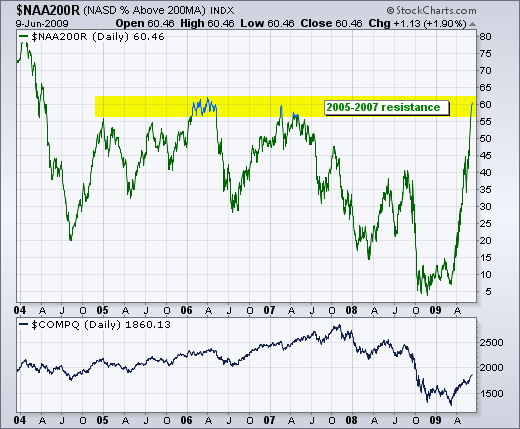
Over 60% of Nasdaq Stocks above their 200-day
by Arthur Hill,
Chief Technical Strategist, TrendInvestorPro.com
The percentage of Nasdaq stocks that are trading above their 200-day moving average reached its highest level since early 2006. As the chart below shows, fewer than 10% of Nasdaq stocks were trading above their 200-day moving average in March. With the March-June rally, 60.46% of...
READ MORE
MEMBERS ONLY

POINT & FIGURE CHARTS OFFER EASILY SPOTTED BUY AND SELL SIGNALS -- USING STOCK SCAN P&F ALERTS -- NYSE BULLISH PERCENT INDEX IS IN UPTREND BUT OVERBOUGHT
by John Murphy,
Chief Technical Analyst, StockCharts.com
POINT & FIGURE CHARTING... Although most of the charts shown in our Market Messages are bar and candlesticks, you should be aware of a third type of chart that can be extremely helpful in spotting market signals -- the point and figure chart. In my view, the main value of p&...
READ MORE
MEMBERS ONLY

Growth Leading Value
by Arthur Hill,
Chief Technical Strategist, TrendInvestorPro.com
As the price relative below shows, the S&P 500 Growth ETF (IVW) is outperforming the S&P 500 Value ETF (IVE). The price relative is simply a plot of the IVW:IVE ratio (enter IVW:IVE for the symbol). The ratio increases when IVW (numerator) rises more...
READ MORE
MEMBERS ONLY

Charts Worth Watching
by Arthur Hill,
Chief Technical Strategist, TrendInvestorPro.com
- Charts Worth Watching: $INDU, ACN, ATHR, BDK, DHI, JPM, KRE, PKI, QQQQ, RJF, TGT, USB, XHB
- Link to today's video.
- The next update will be Friday (June 12) by 9AM ET.
*****************************************************************
As evidenced by yesterday's last hour surge, trading remains quite tricky right now. The first...
READ MORE
MEMBERS ONLY

Homebuilders Bounce
by Arthur Hill,
Chief Technical Strategist, TrendInvestorPro.com
Even though the major stock indices were trading sharply lower on Monday afternoon, a few of the homebuilders showed nice gains. The gainers are easy to spot using the S&P Sector Carpet. As the blue arrows show, Lennar (LEN) was the second biggest gainer and DR Horton (DHI)...
READ MORE
MEMBERS ONLY

SPIKE IN 2-YEAR TREASURY YIELD SUPPORTS DOLLAR BUT CAUSES PROFIT-TAKING IN STOCKS AND COMMODITIES -- S&P 500 MANAGES TO HOLD ABOVE INITIAL CHART SUPPORT AT 925 AND ITS 200-DAY MOVING AVERAGE
by John Murphy,
Chief Technical Analyst, StockCharts.com
2-YEAR TREASURY YIELD SPIKES ... On Friday, I showed the U.S. Dollar Index bouncing from chart support at its December low, and suggested that a dollar bounce could cause short-term profit-taking in stocks and commodities. We saw some of that on Monday morning as stocks and commodities...
READ MORE
MEMBERS ONLY
AUTO-COMPLETE TICKER BOX
We've just added a new "auto-complete" dropdown box feature to our home page. As you enter a ticker symbol or company name into the "Symbol" box, we now display suggestions from our symbol database for what we think you are looking for. As...
READ MORE
MEMBERS ONLY
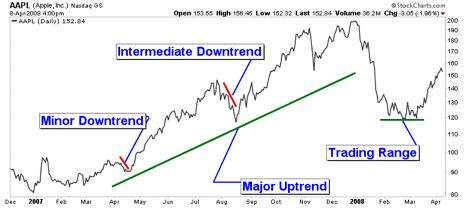
TECHNICAL ANALYSIS 101 - PART 8
This is the eighth part of a series of articles about Technical Analysis from a new course we're developing. If you are new to charting, these articles will give you the "big picture" behind the charts on our site. if you are an "old hand&...
READ MORE
MEMBERS ONLY
TIME TO TURN CAUTIOUS
by Tom Bowley,
Chief Market Strategist, EarningsBeats.com
I've been bullish for several weeks now, but the tide is changing. We are running out of historical bullish periods until later in 2009. We have a few periods that are a bit more optimistic, but by and large the stock market remains either neutral or bearish through...
READ MORE
MEMBERS ONLY

DRUGS & HEALTHCARE POISED TO OUTPERFORM

by Richard Rhodes,
Founder and President, Rhodes Capital Management and Rhodes Trading Group
As the current rally perpetuates beyond what reasonable technicians would have thought at this point - the buying surge has now surpassed 57 trading sessions, it would appear traders are searching rather intently for those "laggard" groups or stocks to provide them with enhanced risk-reward benefits. This is...
READ MORE
MEMBERS ONLY
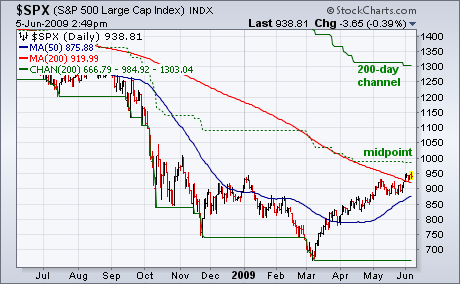
200-DAY AVERAGE IS STILL DROPPING
by John Murphy,
Chief Technical Analyst, StockCharts.com
Virtually all major market indexes (including the Dow) have now exceeded their 200-day moving averages. That's a positive sign for the stock market, and adds more weight to the view that a major bottom has been seen. As I wrote a couple of weeks ago, however, the...
READ MORE
MEMBERS ONLY
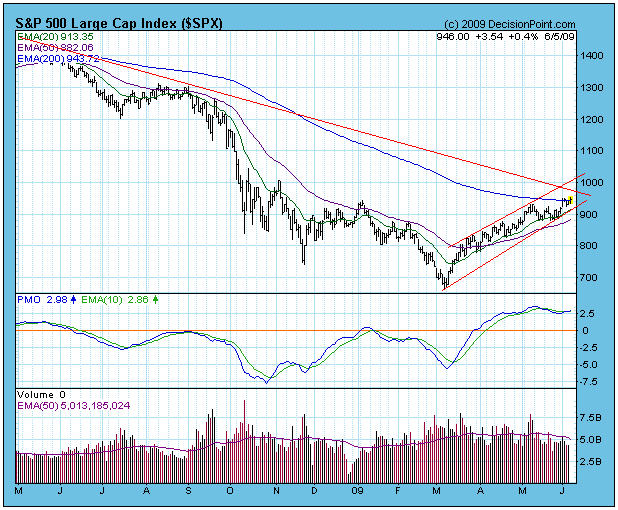
IMPORTANT RESISTANCE ENCOUNTERED

by Carl Swenlin,
President and Founder, DecisionPoint.com
On the chart below we could attach a callout window to the rally that began in March and entitle it "Bull Market Rules Apply". Bull market rules generally mean that bullish setups will almost always resolve positively, and that bearish setups will usually fail to execute, because the...
READ MORE
MEMBERS ONLY
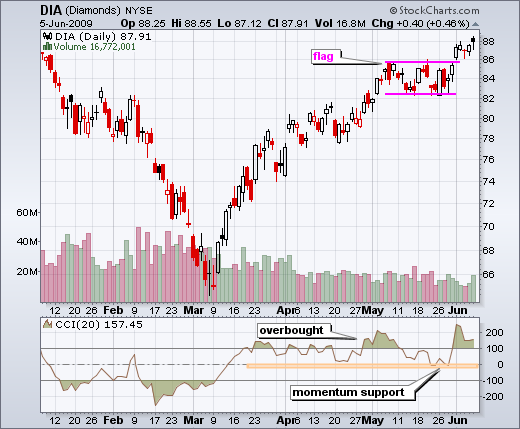
OVERBOUGHT AND BULLISH
by Arthur Hill,
Chief Technical Strategist, TrendInvestorPro.com
Even thought the Dow Diamonds (DIA) is overbought medium-term, the recent breakout is short-term bullish and this breakout is holding. On the daily chart, DIA broke above flag resistance with a surge on Monday. This move pushed CCI above 100 to turn momentum overbought. Even so, I would...
READ MORE
MEMBERS ONLY

DOLLAR INDEX REACHES CHART SUPPORT AT ITS DECEMBER LOW -- DROP IN EURO MAY PUT SOME SHORT-TERM DOWNSIDE PRESSURE ON STOCKS AND COMMODITIES -- TWO-THIRDS OF NYSE STOCKS ARE ABOVE 200-DAY AVERAGES WHICH IS BULLISH
by John Murphy,
Chief Technical Analyst, StockCharts.com
DOLLAR INDEX BOUNCES OFF DECEMBER LOW... The US Dollar Index peaked in March and has since fallen to the lowest level in six months. The falling dollar has coincided with rallies in stocks and commodities over the last three months. That's why it's worth noting that...
READ MORE
MEMBERS ONLY

Inverse Head-and-shoulders For Ixia
by Arthur Hill,
Chief Technical Strategist, TrendInvestorPro.com
As its name implies, an inverse head-and-shoulders is an upside down version of the normal head-and-shoulders. Ixia (XXIA) has a one such pattern with a neckline breakout this week. Notice that upside volume started increasing as the right shoulder unfolded....
READ MORE
MEMBERS ONLY

Charts Worth Watching
by Arthur Hill,
Chief Technical Strategist, TrendInvestorPro.com
- Charts Worth Watching: AET, CAT, DE, DIA, EMC, IMKTA, IR, IWM, JPM, LLY, OCR, QQQQ, SNPS, SPY, TTWO, TXT, WFC, XLF, XLI
- Link to today's video (click here).
-The next update will be Tuesday (June 9) by 9AM ET.
*****************************************************************
Even though the major index ETFs are still overbought...
READ MORE
MEMBERS ONLY

FINANCE SECTOR SHOWS RELATIVE STRENGTH FOR A DAY - OIL LEADS ENERGY SECTOR REBOUND - RETAILERS KEEP MARKET ADVANCE IN CHECK - STOCKS BENEFIT FROM WEAKNESS IN BONDS AND DOLLAR - ANALYZING THE AD LINE AND AD VOLUME LINE
by John Murphy,
Chief Technical Analyst, StockCharts.com
FINANCIALS LEAD THE MARKET HIGHER... Link for todays video.
After commenting about relative weakness in the finance sector just yesterday, the Financials SPDR (XLF) perked up with a nice bounce on Thursday. This bounce keeps the medium-term uptrend alive and reinforces support from the late May lows (11.5)...
READ MORE
MEMBERS ONLY

Corporate Bonds and Treasuries Diverge
by Arthur Hill,
Chief Technical Strategist, TrendInvestorPro.com
Investors are showing a clear preference for corporate bonds over treasury bonds. The chart below shows the 10-Year US Treasury Note ($UST) and the DJ Corporate Bond Index ($DJCBP) going their separate ways since March. $UST is down around 7% since mid March, but $DJCBP is up around 9%...
READ MORE
MEMBERS ONLY

CONSOLIDATION BREAKOUTS TURN INTO FIRST SUPPORT LEVELS - FINANCE AND CONSUMER DISCRETIONARY SECTORS START TO LAG - BIOTECHS BUCK THE SELLING PRESSURE - AMGEN AND GENZYME BREAK RESISTANCE - VIX CONTINUES TO TREND LOWER - NET NEW HIGHS EXPAND
by John Murphy,
Chief Technical Analyst, StockCharts.com
STOCKS PULL BACK ... Link for todays video.
After a four day surge that produced consolidation breakouts, the major index ETFs pulled back on Wednesday. Chart 1 shows the S&P 500 ETF (SPY) with a flag/wedge breakout on Monday. With a ~6% surge the prior four days, some...
READ MORE
MEMBERS ONLY
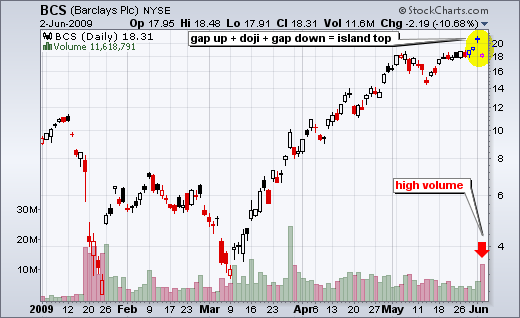
An Island Top for Barclays
by Arthur Hill,
Chief Technical Strategist, TrendInvestorPro.com
Barclays Plc (BCS) came across the island top scan from Tuesday's close. Notice how the stock gapped up, held the gap for one day with a doji and then gapped down with high volume on Tuesday. The doji represents an island where buyers are now trapped with a...
READ MORE
