MEMBERS ONLY
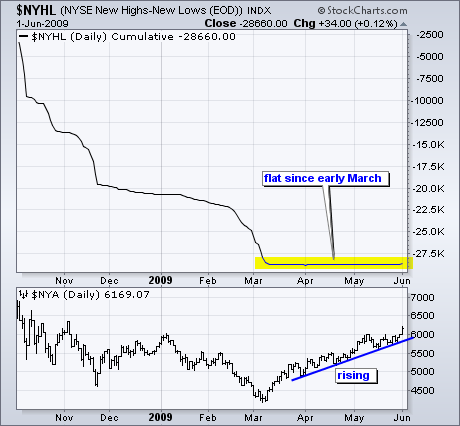
Net New Highs Remain Flat

by Arthur Hill,
Chief Technical Strategist, TrendInvestorPro.com
Even though stocks have been rising since early March, the cumulative Net New Highs indicator has been flat since early March. This shows a virtual stalemate between new 52-week highs and new 52-week lows. Obviously, the market can rally with a stalemate. Trouble could start if this indicator...
READ MORE
MEMBERS ONLY
Charts Worth Watching
by Arthur Hill,
Chief Technical Strategist, TrendInvestorPro.com
- Charts Worth Watching:aa, aci, atmi, csco, DIA, fic, intc,
IWM, jpm, ma, plcm, pmtc, QQQQ, shlm, smh, SPY, v, xlb, xlf
- Link to today's video (click here).
- The next update will be Friday (June 5) around 9 AM ET.
*****************************************************************
After pointing out bullish consolidations in the major...
READ MORE
MEMBERS ONLY
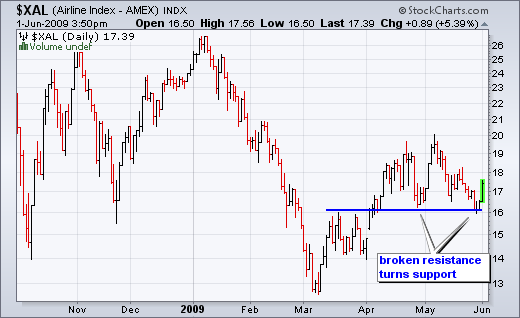
Airlines Fly High
by Arthur Hill,
Chief Technical Strategist, TrendInvestorPro.com
The Amex Airline Index ($XAL) surged around 5% with a big move off support on Monday. Notice how broken resistance around 16 turned into support in late April and again in May. Today's bounce reinforces support and makes XAL one of the industry group leaders on Monday....
READ MORE
MEMBERS ONLY

STOCKS AND COMMODITIES CONTINUE THEIR SPRING RUN -- THE S&P 500 TRADES OVER ITS 200-DAY AVERAGE FOR THE FIRST TIME IN A YEAR -- DOW INDUSTRIALS AND TRANSPORTS NEAR TESTS OF THEIR 200-DAY LINES

by John Murphy,
Chief Technical Analyst, StockCharts.com
S&P 500 TRADES OVER 200-DAY AVERAGE ... The market is off to a very strong start and a lot of market indexes and groups are either testing or breaking through their 200-day moving averages. The most important of all is the S&P 500 which is...
READ MORE
MEMBERS ONLY
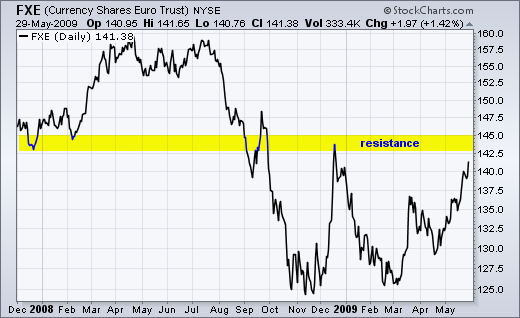
Euro Approaches Resistance Zone
by Arthur Hill,
Chief Technical Strategist, TrendInvestorPro.com
The Euro ETF (FXE) has been red hot with a move from around 125 in early March to 141 in late May. Interestingly, the rise in the Euro coincides with a rise in stock over this same period. FXE is fast approaching a resistance zone around 142.5-145. This...
READ MORE
MEMBERS ONLY
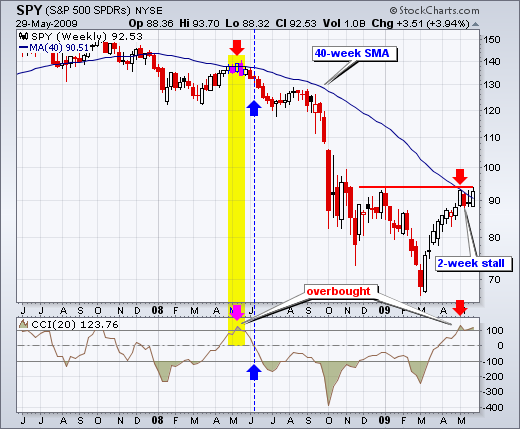
Reflections of May 2008
by Arthur Hill,
Chief Technical Strategist, TrendInvestorPro.com
With a huge rally from early March to late May, the S&P 500 ETF (SPY) is trading just above its 40-week moving average and a key momentum oscillator is overbought. The 40-week moving average is the weekly equivalent to the 200-day moving average (40 weeks...
READ MORE
MEMBERS ONLY

MONEY ROTATING OUT OF TREASURY BONDS AND THE DOLLAR HAS MOVED INTO STOCKS AND COMMODITIES -- THAT'S A SIGN OF GROWING OPTIMISM -- DON'T ABANDON ALL BOND CATEGORIES -- OUTSIDE OF TREASURIES, MOST FIXED INCOME CATEGORIES ARE RISING
by John Murphy,
Chief Technical Analyst, StockCharts.com
ROTATION INTO RISKIER ASSETS IS A GOOD SIGN... Although it's no surprise to read that some asset class rotations have been going on all spring, it's still helpful to see what's happening graphically. And to try to understand why it's happening. From...
READ MORE
MEMBERS ONLY

Charts Worth Watching
by Arthur Hill,
Chief Technical Strategist, TrendInvestorPro.com
Charts Worth Watching: amat, amln, apa, genz,
hal, IWM, lltc, nvls, oih, QQQQ, slb, smh, SPY
I am on the road and today's commentary is abbreviated. There is no video. Normal commentary and video will resume next Tuesday.
The next update will be Tuesday (June 2nd) by 9AM...
READ MORE
MEMBERS ONLY

Natural Gas Surges
by Arthur Hill,
Chief Technical Strategist, TrendInvestorPro.com
While the US Oil Fund ETF (USO) bottomed in February, the US Natural Gas Fund ETF (UNG) continued lower and recorded a new low in late April. There was a big surge in early May and then a deep pullback the last two weeks. Notice that this pullback ended abruptly...
READ MORE
MEMBERS ONLY

SPY STALLS AT RESISTANCE - QQQQ REMAINS ABOVE 40-WEEK AVERAGE - GAS CONTINUES TO RISE - STRENGTH IN OIL BOOSTS ENERGY SECTOR - GOLD AND SILVER MOVE HIGHER - GOLD IS TOP INTER-MARKET PERFORMER FOR 2009
by John Murphy,
Chief Technical Analyst, StockCharts.com
RANGE BOUND MARKET... Link for todays video.
May has been the month of churn in the stock market so it seems appropriate to step back and look at the bigger picture. After a huge advance from early March until early May, a little churning is actually quite normal. The bears...
READ MORE
MEMBERS ONLY

Asia Leads The Way
by Arthur Hill,
Chief Technical Strategist, TrendInvestorPro.com
While the western stock markets have clawed their way back towards positive territory the last few months, the Hang Seng ($HIS) turned year-to-date positive in early April and now sports a 24.31% gain. Among the six world indices shown, the Nikkei 225 is a distant second with...
READ MORE
MEMBERS ONLY

DARK CLOUDS AND SHOOTING STARS TAKE SHAPE - REVIEWING TUESDAYS SURGE ON LOW VOLUME - NASDAQ AND NY COMPOSITE BATTLE THEIR 200-DAY AVERAGES - CONSUMER DISCRETIONARY SECTOR SHOWS RELATIVE WEAKNESS - BONDS PLUNGE ON SUPPLY CONCERNS
by John Murphy,
Chief Technical Analyst, StockCharts.com
DARK CLOUDS OVERHEAD... Link for todays video.
The S&P 500 ETF (SPY) and the Dow Diamonds (DIA) opened strong and closed weak on Wednesday. Charts 1 and 2 show both giving back more than half of yesterdays big gain with long red candlesticks. In fact, SPY and DIA...
READ MORE
MEMBERS ONLY
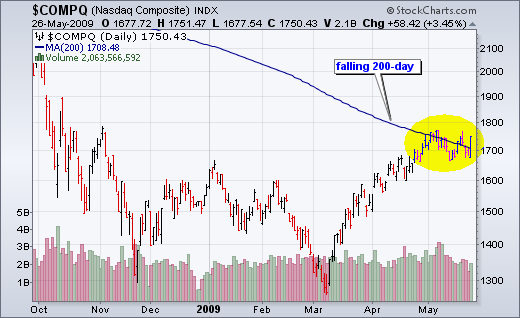
Naz Battles the 200-day
by Arthur Hill,
Chief Technical Strategist, TrendInvestorPro.com
The Nasdaq extended its battle with the 200-day moving average by jumping back above with a big advance on Tuesday. With this latest move, the index has now crossed the 200-day at least five times this month. Notice that today's surge occurred on the second lowest...
READ MORE
MEMBERS ONLY

SURGE IN CONSUMER CONFIDENCE KEEPS SPRING UPTREND INTACT -- FOREIGN STOCKS ARE LEADING US HIGHER BECAUSE OF THE FALLING DOLLAR -- THAT'S ESPECIALLY HELPFUL FOR FOR FOREIGN ETFS LIKE CANADA
by John Murphy,
Chief Technical Analyst, StockCharts.com
SHORT-TERM STOCK SUPPORT HOLDS... A big surge in consumer confidence has gotten stocks off to a strong start in the holiday-shortened week. Charts 1 and 2 show the Dow Industrials and the S&P 500 trading more than 2% higher in early afternoon trading. Today's...
READ MORE
MEMBERS ONLY

Charts Worth Watching
by Arthur Hill,
Chief Technical Strategist, TrendInvestorPro.com
Charts Worth Watching: SPY, DIA, IWM, XLB, XRT AND IYT.
Another update will be posted by 12PM ETon Tuesday (26-May). This will include the stock setups and the video.
*****************************************************************
The major index ETFs are showing signs of weakness as a potential correction unfolds. These ETFs include the Dow Diamonds...
READ MORE
MEMBERS ONLY

Stock Setups and Video
by Arthur Hill,
Chief Technical Strategist, TrendInvestorPro.com
Charts: BA, DELL, HD, HON, INTC, K , KFT, LMT, LOW
The next update will be Friday (May 29) by 9AM ET.
Link to corresponding video.
*****************************************************************
Weakness in Home Depot (HD) is negative overall. HD was hit hard with two sharp declines in May. The one-day wonder surge above 26...
READ MORE
MEMBERS ONLY

PRICE CHANNELS ARE BEARISH FOR BONDS AND THE DOLLAR, BUT ARE BULLISH FOR PRECIOUS METALS -- FOR A BULL MARKET IN STOCKS TO OCCUR, THE 40-WEEK MOVING AVERAGE NEEDS TO TURN UP -- THE 40-WEEK PRICE CHANNEL IS TOO HIGH FOR THAT TO HAPPEN IN THE NEAR FUTURE
by John Murphy,
Chief Technical Analyst, StockCharts.com
50-DAY PRICE CHANNEL IS BEARISH FOR BONDS ... On Tuesday, I wrote about using 20-day price channels (or four weeks) for short-term trading purposes. I also suggested that price channels could be used in any market. Take bonds for example. Chart 1 applies 20-day channels to the...
READ MORE
MEMBERS ONLY
Charts Worth Watching
by Arthur Hill,
Chief Technical Strategist, TrendInvestorPro.com
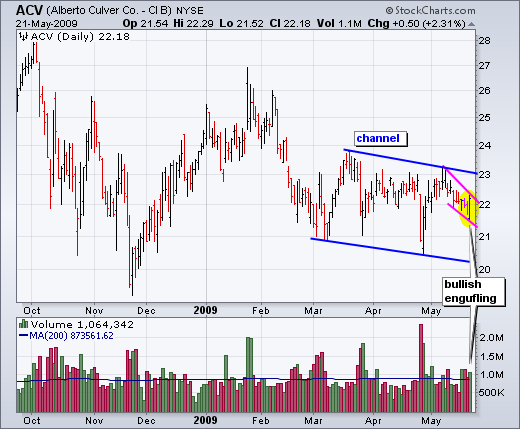
- Charts Worth Watching:acv, amgn, amln , asei, bro,
cah, cb, eric, hon, idcc, nke, swy, trv, vrtx
- Link to corresponding video.
The next update will be Tuesday (May 26) by 11AM ET.
****************************************************************
I will start off today with two potentially bullish setups from the consumer staples sector. This sector is...
READ MORE
MEMBERS ONLY

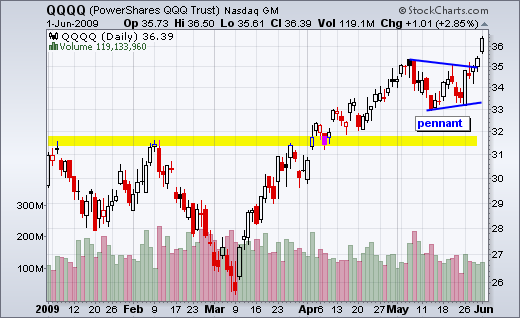
QQQQ Retraces 38.2%
by Arthur Hill,
Chief Technical Strategist, TrendInvestorPro.com
With the March-May advance, QQQQ has now retraced 38.2% of the May-November decline. Where does this number come from? It based on the Golden Ratio Congugate (.618). 1 - .618 = .382 or 38.2%. After a decline, like May to November, the Fibonacci Retracements Tool can be used...
READ MORE
MEMBERS ONLY

AD Volume Line Breaks Trendline
by Arthur Hill,
Chief Technical Strategist, TrendInvestorPro.com
The AD Volume Line for the Nasdaq broke its March trendline and formed a lower high in May. This indicator is a cumulative measure for the volume of advancing stocks less the volume of declining stocks. Notice that recent peaks and troughs in the Nasdaq coicided with peaks and troughs...
READ MORE
MEMBERS ONLY

STOCKS MOVE LOWER XLE FAILS AT RESISTACNE OIH GAPS DOWN BONDS DECLINE ON SUPPLY CONCERNS RATES SURGE XHB TURNS UNDERPERFORMER DOLLAR GETS WHACKED AGAIN GOLD AND SILVER SHINE
by John Murphy,
Chief Technical Analyst, StockCharts.com
BROAD DECLINE ON WALL STREET... Link for todays video.
Stocks moved lower on Thursday after S&P warned that they may cut their outlook for the United Kingdoms sovereign debt. While it is certainly a plausible excuse, I have my doubts. As a credit rating agency, S&P...
READ MORE
MEMBERS ONLY

NASDAQ BOUNCES ON LOW VOLUME AN OUTSIDE REVERSAL DAY FOR RETAIL HOLDRS DOLLAR AND VIX FALL TOGETHER INFLATION PROTECTED BONDS HINT AT INFLATION GOLD ETF TRACES OUT LARGE INVERSE HEAD-AND-SHOULDERS PATTERN
by John Murphy,
Chief Technical Analyst, StockCharts.com
LOW VOLUME BOUNCE ... Stocks surged on Monday and recorded small gains on Tuesday to start the week with two up days. Despite these gains, Charts 1 and 2 show Nasdaq and NYSE volume below average on both days. Keep in mind that this weeks bounce was in response to the...
READ MORE
MEMBERS ONLY

A Head-and-Shoulders for Wal-Mart?
by Arthur Hill,
Chief Technical Strategist, TrendInvestorPro.com
Wal-Mart is tracing out a continuation head-and-shoulders pattern with neckline support around 47.5-48. It is a bit unusual because the neckline is sloping up, which reflects higher lows since early February. A break below support would confirm the pattern and signal a continuation lower. Conversely,...
READ MORE
MEMBERS ONLY

HOW TO USE THE 20-DAY PRICE CHANNEL FOR SHORT-TERM TRADING -- S&P 500 REMAINS BELOW 200-DAY AVERAGE
by John Murphy,
Chief Technical Analyst, StockCharts.com
20-DAY PRICE CHANNELS... Here's a simple trading tool that you might want to incorporate into your work. It's called the "Price Channel" and you'll find it under the Overlays list below moving averages and Bollinger bands. One of the most popular...
READ MORE
MEMBERS ONLY

HOME DEPOT REVERSES YESTERDAY'S GAINS ON BAD HOUSING NEWS -- STOCKS TRY TO CONTINUE BOUNCE -- S&P 500 TRADING BETWEEN 20-AND 200-DAY MOVING AVERAGES
by John Murphy,
Chief Technical Analyst, StockCharts.com
SELLS OFF ON BAD HOUSING DATA... An good earnings report in Home Depot was quickly erased by some negative news on housing. The 15-minute bars in Chart 1 show the schizophrenic action over the last two days. The nation's largest home improvement stock has fallen 5% to...
READ MORE
MEMBERS ONLY

A High-Volume Harami for SUN
by Arthur Hill,
Chief Technical Strategist, TrendInvestorPro.com
After a decline below 30, Sunoco (SUN) suddenl firmed with a high volume harami on Monday (18-May). These are potentially bullish candlestick reversal patterns that require confirmation with further upside. Look for volume to confirm any breakout....
READ MORE
MEMBERS ONLY

Charts Worth Watching
by Arthur Hill,
Chief Technical Strategist, TrendInvestorPro.com
Charts Worth Watching: ANF, AZO, CAL, CB, INTC, ITB,
LUV, PGR, QQQQ, SMH, SWY, SYY, XLB, XLF
The next update will be Friday (May 22) around 9AM ET.
*****************************************************************
The moment of truth is close. Based on positive reports from State Street (STT) and Lowe's (LOW), stocks moved sharply...
READ MORE
MEMBERS ONLY
BIGGER PIPES, BETTER SERVICE
BIGGER PIPES, BETTER SERVICE - On Friday, we upgraded our Internet connection from a 180 Megabit connection to a 1 Gigabit Fiber connection (1 Gigabit is 1024 Megabits). That's over 5 times more bandwidth! If you have been experiencing slowness, especially during busy market times, you might see an...
READ MORE
MEMBERS ONLY
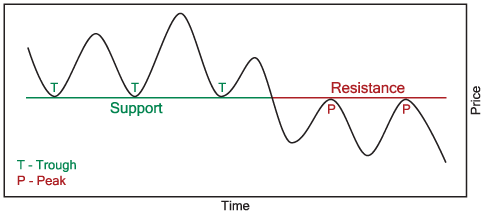
TECHNICAL ANALYSIS 101 - PART 7
This is the seventh part of a series of articles about Technical Analysis from a new course we're developing. If you are new to charting, these articles will give you the "big picture" behind the charts on our site. if you are an "old hand&...
READ MORE
MEMBERS ONLY
EMERGING MARKETS TAKING THE LEAD

by Richard Rhodes,
Founder and President, Rhodes Capital Management and Rhodes Trading Group
As the markets have rallied off the March 9th bottom, we find it rather interesting that the Emerging Markets have taken a lead role and have outperformed rather handily. The growing consensus believes that when the worlds' stock markets do bottom, then the Emerging Markets will take the role...
READ MORE
MEMBERS ONLY
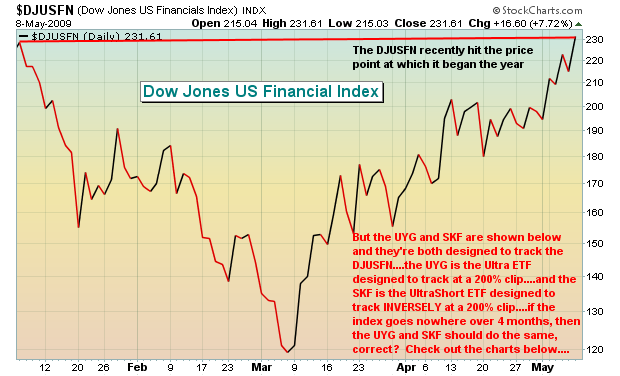
ANOTHER LOOK AT JUICED ETFS

by Tom Bowley,
Chief Market Strategist, EarningsBeats.com
In February, I wrote an article discussing the fact that juiced ETFs (ETFs designed to double or inversely double the returns of an underlying index) do not perform as you might expect. There was a huge response to this article and mostly positive feedback. There are plenty of reasons why...
READ MORE
MEMBERS ONLY

MARKET FAILS TEST OF JANUARY HIGH
by John Murphy,
Chief Technical Analyst, StockCharts.com
I started the week on Monday with the headline that "Upside price and time targets had been hit" and added that overbought readings suggested that the market was vulnerable to profit-taking. The NYSE Composite Index had just reached overhead resistance at its January high and its 200-...
READ MORE
MEMBERS ONLY

DOWNSIDE CORRECTION HAS STARTED AS OVERBOUGHT MARKET PULLS BACK FROM JANUARY PEAK AND 200-DAY AVERAGE -- SHORT-TERM MCCLELLAN BREADTH OSCILLATOR TURNS NEGATIVE -- THE LONGER-RANGE SUMMATION INDEX, HOWEVER, HITS FIVE-YEAR HIGH
by John Murphy,
Chief Technical Analyst, StockCharts.com
MARKET FAILS TEST OF JANUARY HIGH ... I started the week on Monday with the headline that "Upside price and time targets had been hit" and added that overbought readings suggested that the market was vulnerable to profit-taking. The NYSE Composite Index had just reached overhead resistance at...
READ MORE
MEMBERS ONLY
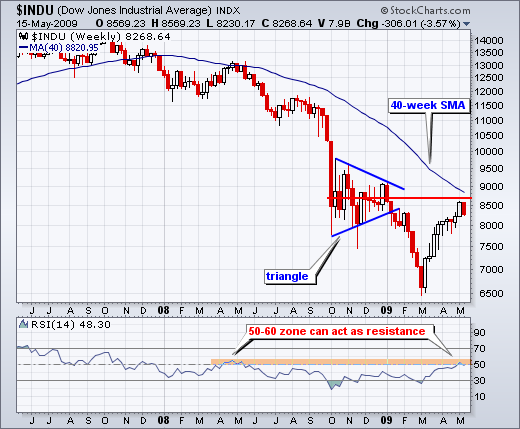
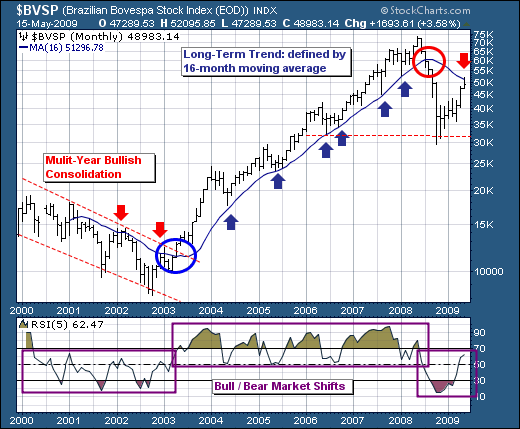
DOW HITS RESISTANCE
by Arthur Hill,
Chief Technical Strategist, TrendInvestorPro.com
After a massive 9 week advance, the Dow ran into resistance with its biggest weekly decline since early March. There is a resistance zone coming into play around 8700-8800 from the falling 40-week moving average and the Oct-Nov consolidation. After establishing support in Oct-Nov, this triangle...
READ MORE
MEMBERS ONLY
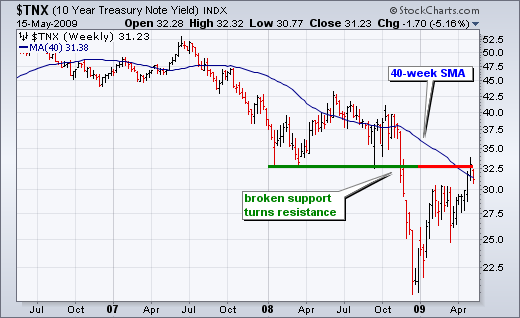
10-Year Treasury Yield Hits Resistance
by Arthur Hill,
Chief Technical Strategist, TrendInvestorPro.com
Broken support turns into resistance. This classic tenet of technical analysis is coming into play for the 10-Year Treasury Yield ($TNX). Notice that the 10-Year Treasury Yield broke support around 33-34 (3.3-3.4%) and this area turned into resistance in early May....
READ MORE
MEMBERS ONLY
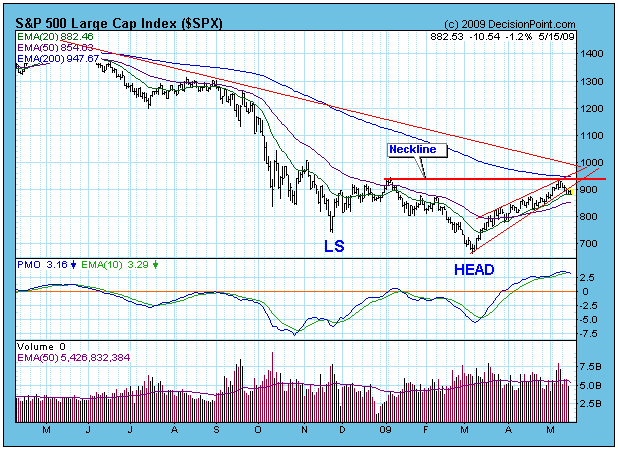
REVERSE HEAD AND SHOULDERS FORMING?

by Carl Swenlin,
President and Founder, DecisionPoint.com
The ascending wedge pattern we discussed last week has broken down as we expected. Considering that the market has rallied nearly 40%, I think it is reasonable to expect more corrective action.
The next development to watch is the possible formation of a reverse head and shoulders. We currently have...
READ MORE
MEMBERS ONLY

BREADTH INDICATORS REFLECT BROAD SELLING DOWNSIDE VOLUME PICKS UP PACE A LOOK AT THE PRIOR BEAR MARKET HOW THE CURRENT RALLY STACKS UP LOOKING AHEAD SEVEN MONTHS
by John Murphy,
Chief Technical Analyst, StockCharts.com
NASDAQ DECLINES ON HIGH VOLUME ... Breadth indicators are one of my first ports of call after a big market move. With the major indices moving sharply lower on Wednesday, the breadth statistics can tell us if this decline was broad-based or relatively narrow. Charts 1 and 2 show Volume,...
READ MORE
MEMBERS ONLY

A Massive Bearish Engulfing
by Arthur Hill,
Chief Technical Strategist, TrendInvestorPro.com
Tidewater (TDW) formed a massive bearish engulfing that engulfed the prior five candlesticks. Volume surged to its highest level since January. What's more, this is the second bearish engulfing pattern in two weeks. These patterns reflect a raging battle at resistance from the January-February highs....
READ MORE
MEMBERS ONLY
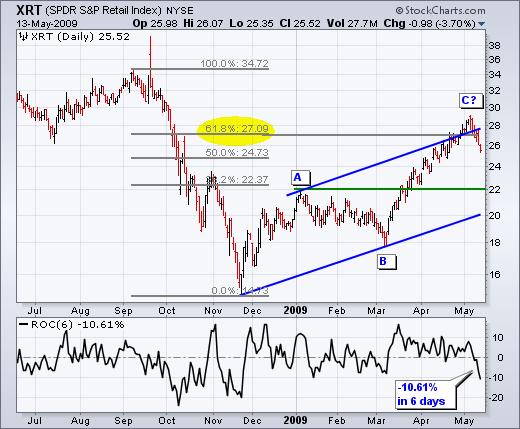
Charts Worth Watching
by Arthur Hill,
Chief Technical Strategist, TrendInvestorPro.com
Today's Charts Include: AMZN, ANF, ARO, CEPH, CHRW, COV, CPRT, FDX, GILD, INTC, IYT, JBHT, JWN, RL, UPS, XRT.
The next update will be Tuesday (May 19th) around 9AM ET.
*****************************************************************
The consumer discretionary sector and the retail group were hit hard over the last three days. Actually, the...
READ MORE
MEMBERS ONLY

STOCKS DECLINE WITH BROAD SELLING GAPS REMAIN UNFILLED SMALL AND MID CAPS LEAD LOWER DEFENSIVE SECTORS OUTPERFORM IN MAY DOLLAR HITS SUPPORT AREA BONDS GET OVERSOLD BOUNCE 10-YEAR NOTE YIELD HITS RESISTANCE
by John Murphy,
Chief Technical Analyst, StockCharts.com
BROAD SELLING HITS WALL STREET ... The market declined sharply on Wednesday with broad selling pressure. All of the major indices were sharply lower. All nine sectors were lower with five declining over 3%. Chart 1 shows the S&P 500 hitting resistance at its January high last week and...
READ MORE
