MEMBERS ONLY

Best Buy Breaks Support

by Arthur Hill,
Chief Technical Strategist, TrendInvestorPro.com
Best Buy (BBY) broke support and the 50-day moving average with a sharp decline over the last six days. Notice how the Aroon Oscillator turned negative just before this support break. In fact, this Aroon signal would have shown up on the Aroon scan last Thursday....
READ MORE
MEMBERS ONLY

Dow Transports Falls Short of 200-day
by Arthur Hill,
Chief Technical Strategist, TrendInvestorPro.com
After a most impressive rally, the Dow Transports stopped just short of its 200-day simple moving average with a sharp decline the last four days. Also notice that this key average is trading below its prior reaction high (early January). Watch the rising 50-day moving average for potential...
READ MORE
MEMBERS ONLY

COMMODITY RALLY MAY BE TIRING NEAR JANUARY HIGH -- COPPER BACKS OFF FROM 200-DAY AVERAGE -- HOMEBUILDERS STALL NEAR JANUARY HIGH -- SO DO EAFE ISHARES -- EMERGING MARKETS ARE OVERBOUGHT -- MONEY IS MOVING BACK INTO PRECIOUS METALS

by John Murphy,
Chief Technical Analyst, StockCharts.com
CRB INDEX TESTS JANUARY HIGH ... On Friday May 1, I wrote a message headlined: "The S&P 500 and CRB Index appear to be forming head and shoulder bottoms". A test of that bottoming theory would be a rally to their January highs followed by a pullback...
READ MORE
MEMBERS ONLY

Charts Worth Watching
by Arthur Hill,
Chief Technical Strategist, TrendInvestorPro.com
Today's charts include: SPY, ANF, BIIB, CHH, CL, FLML, GLD, IBB, ITB, LEN, MDC, NIKE, QQQQ, SEPR, SVU, VRTX, WMT, XLP, XLY.
The next update will be Thursday (May 14th) morning around 9AM ET.
*****************************************************************
Let's start with the broad market. Even though the S&P...
READ MORE
MEMBERS ONLY
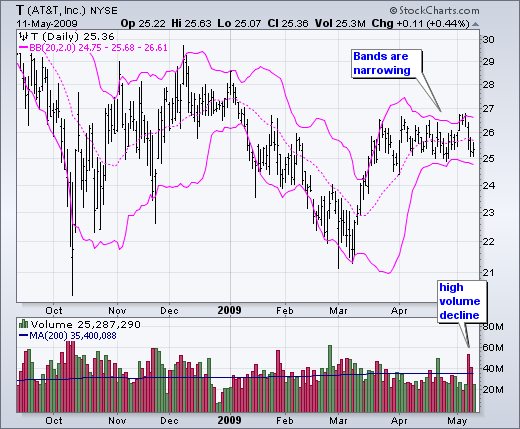
Bollinger Bands Narrow for AT&T
by Arthur Hill,
Chief Technical Strategist, TrendInvestorPro.com
With flat trading since late March, a volatility contraction for AT&T (T) is causing the Bollinger Bands to narrow. Bollinger Bands do not provide a directional bias, but last week's high volume decline shows selling pressure picking up steam....
READ MORE
MEMBERS ONLY

UPSIDE PRICE AND TIME TARGETS HAVE BEEN REACHED -- OVERBOUGHT READINGS ALSO SUGGEST THAT MARKET IS VULNERABLE TO SOME PROFIT-TAKING
by John Murphy,
Chief Technical Analyst, StockCharts.com
MAJOR INDEXES REACH JANUARY HIGH ... When this rally first started during March, I suggested that it could reach the January peak which would also bring some of the major stock indexes closer to their 200-day moving averages. On April 3, I added a time target into early May. That...
READ MORE
MEMBERS ONLY
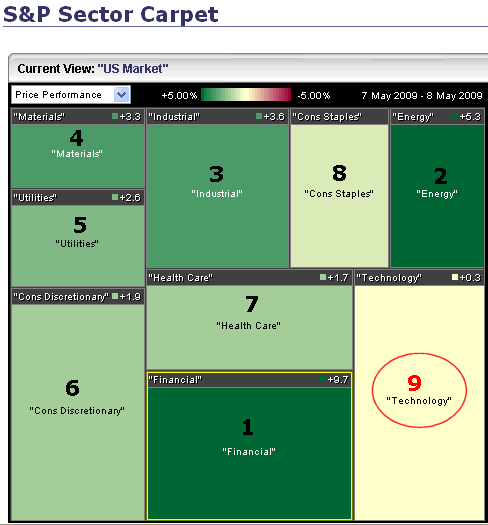
Technology Lags on Friday
by Arthur Hill,
Chief Technical Strategist, TrendInvestorPro.com
The S&P Sector Carpet shows a color-coded version of the leading and lagging sectors. Dark green sectors are leading with financial and energy showing the biggest gains on Friday. The technology was conspicuously absent from the leadership board on Friday. In fact, technology was the worst performing...
READ MORE
MEMBERS ONLY

LIST OF CYCLICAL STOCK LEADERS -- NATURAL GAS STOCKS LEAD ENERGY COMPLEX HIGHER AS THE COMMODITY BOTTOMS -- MARKET MAY BE LOSING SEMICONDUCTOR LEADERSHIP BUT BENEFITS FROM BANK REBOUND -- TUMBLING DOLLAR GIVES BOOST TO COMMOTIES
by John Murphy,
Chief Technical Analyst, StockCharts.com
LIST OF CYCLICAL STOCKS ... On Monday, I wrote an article showing that the Morgan Stanley Cyclical Index (CYC) had led the stock rally since March, and suggested that was a good sign for the market and the economy. One reader asked what stocks were included in the index. Chart 1...
READ MORE
MEMBERS ONLY
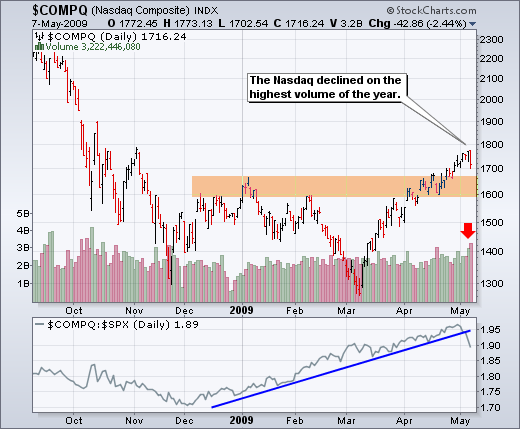
Charts Worth Watching
by Arthur Hill,
Chief Technical Strategist, TrendInvestorPro.com
Charts Worth Watching: ANF, BIIB, CHH, CL, FLML, GLD, IBB, ITB, LEN, MDC, NIKE, QQQQ, SEPR, SPY, SVU, VRTX, WMT, XLP, XLY.
Scheduling Note: The next posting will be on Tuesday, May 12 around 9AM ET.
*****************************************************************
The Nasdaq declined with the highest volume of the year on Thursday. While a...
READ MORE
MEMBERS ONLY

QQQQ DECLINES AFTER STRONG OPEN MONEY ROTATES INTO DEFENSIVE SECTORS THREE HEALTHCARE LEADERS NASDAQ IS LAGGING THE NY COMPOSITE SMALL-CAPS ARE LAGGING LARGE-CAPS NET NEW HIGHS FAIL TO IMPRESS
by John Murphy,
Chief Technical Analyst, StockCharts.com
SELLERS GREET STRONG OPEN... The Nasdaq 100 ETF (QQQQ) signaled that something was amiss when it opened strong and immediately moved lower for the second day running. Chart 1 shows the Nasdaq 100 ETF (QQQQ) with 15 minute candlesticks over the last four days. QQQQ opened strong with a gap...
READ MORE
MEMBERS ONLY
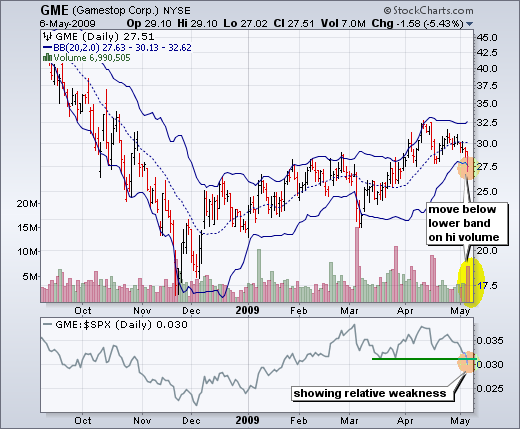
Gamestop Breaks Lower B-Band
by Arthur Hill,
Chief Technical Strategist, TrendInvestorPro.com
Looking through the scans page, I noticed that Game stop broke below its lower Bollinger Band with a high volume decline. Moreover, the stock is showing relative weakness as the price relative broke below its March lows. GME is moving down while the S&P 500 has been moving...
READ MORE
MEMBERS ONLY

FINANCIALS LEAD MARKET HIGHER OIL AND GASOLINE BREAK CONSOLIDATION PATTERNS XLE AND OIH FOLLOW ENERGY PRICES HIGHER GOLD CHALLENGES RESISTANCE AGAIN USING RSI TO IDENTIFY PULLBACKS
by John Murphy,
Chief Technical Analyst, StockCharts.com
BANKS SURGE AHEAD OF STRESS TEST... With news leaking out all over the place, financials were sharply higher ahead of Thursday's stress test results. Officially, the results of the stress test are to be announced on Thursday. Unofficially, Bloomberg and other outlets have been reporting preliminary results over...
READ MORE
MEMBERS ONLY
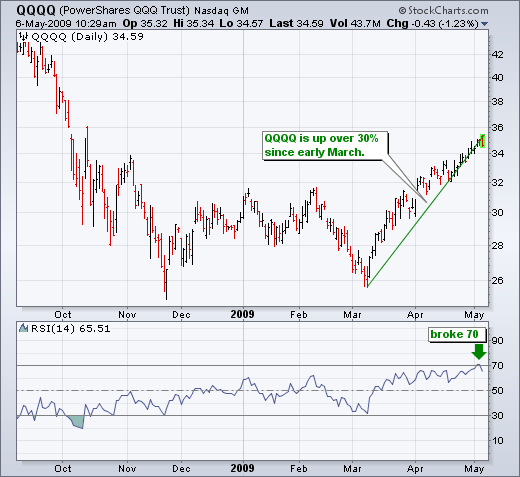
RSI Breaks 70 for QQQQ
by Arthur Hill,
Chief Technical Strategist, TrendInvestorPro.com
With 14-day RSI moving above 70 this week, the Nasdaq 100 ETF (QQQQ) became the first major-index ETF with an overbought reading. RSI is considered overbought when above 70 and oversold when below 30. For the Russell 2000 ETF (IWM), S&P 500 ETF (SPY) and Dow...
READ MORE
MEMBERS ONLY

SECTOR CHARTS DON'T HAVE TO LOOK ALIKE -- USING WEEKLY AND MONTHLY MACD SIGNALS -- NYSE ADVANCE DECLINE LINE BREAKS OUT BUT DOESN'T RULE OUT RIGHT SHOULDER PULLBACK -- WHATEVER YOU DO, DO IT SLOWLY
by John Murphy,
Chief Technical Analyst, StockCharts.com
SECTORS CHARTS DON'T HAVE TO LOOK ALIKE... One of our readers asked if the sectors that make up the S&P 500 need to be forming the same price pattern. The answer is no they don't. Some sectors usually rise faster than the S&...
READ MORE
MEMBERS ONLY

Commodity ETFs Follow SPY
by Arthur Hill,
Chief Technical Strategist, TrendInvestorPro.com
Demand for certain commodity ETFs is moving in the same direction as the stock market: UP. Economic growth translates into more demand for industrial metals (DBB), oil (USO), gasoline (UGA) and agricultural products (UGA). In a bit of a strange twist, natural gas (UNG) and livestock (COW) remain laggards....
READ MORE
MEMBERS ONLY

Lagging Sectors Break Resistance
by Arthur Hill,
Chief Technical Strategist, TrendInvestorPro.com
With Monday's market surge, some lagging ETFs joined the bulls with consolidation breakouts. The next four charts show sector ETFs that were lagging SPY because they remained below resistance from the March-April highs. These sector ETFs are still lagging, but they are now trying to play some...
READ MORE
MEMBERS ONLY

Charts Worth Watching
by Arthur Hill,
Chief Technical Strategist, TrendInvestorPro.com
Charts Worth Watching: BTU, CVX, ELON, EWW, KOL, LUB, MMC, RF and SLV.
Even though Mexico is ground-zero for swine flu, the Mexico ETF (EWW) shows no signs of the bug as it challenges resistance from the January high. There was a gap down last week, but the ETF...
READ MORE
MEMBERS ONLY

MARKET STARTS THE WEEK ON A STRONG NOTE -- THE FACT THAT ECONOMICALLY-SENSITIVE CYCLICAL STOCKS HAVE LED THE RALLY SINCE MARCH IS A POSITIVE SIGN FOR THE MARKET AND THE ECONOMY
by John Murphy,
Chief Technical Analyst, StockCharts.com
CYCLICALS LEAD S&P 500 HIGHER... The stock market is starting the week on a strong note. Chart 1 shows the S&P 500 trading 2% higher and reaching the highest level in four months. Even more impressive is the action in the Morgan Stanley Cyclicals Index (CYC)...
READ MORE
MEMBERS ONLY
IMPROVEMENTS GALORE!
NEW HOME PAGE DEBUTS - Our slick new home page provides you with a quick way to see all of the latest happenings at StockCharts. Which stocks are hot; which blogs have been updated recently; the latest improvements to the website; and much more are all right there on https://stockcharts....
READ MORE
MEMBERS ONLY

TECHNICAL ANALYSIS 101 - PART 6
This is the sixth part of a series of articles about Technical Analysis from a new course we're developing. If you are new to charting, these articles will give you the "big picture" behind the charts on our site. if you are an "old hand&...
READ MORE
MEMBERS ONLY
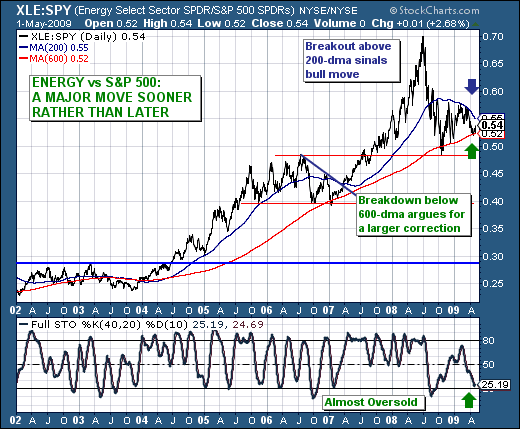
ENERGY vs S&P 500: A MAJOR MOVE SOONER RATHER THAN LATER

by Richard Rhodes,
Founder and President, Rhodes Capital Management and Rhodes Trading Group
The past several trading sessions have shown an increased propensity for traders to "allocate or rotate" funds into commodity and natural resource stocks. Those gains were no starker than during Friday's trading session, when the S&P Energy Sector (XLE) was higher by +3.23%...
READ MORE
MEMBERS ONLY
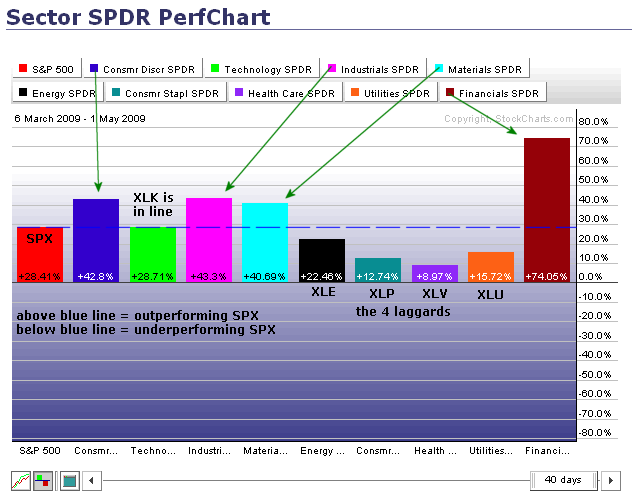
IT'S ALL RELATIVE
by Arthur Hill,
Chief Technical Strategist, TrendInvestorPro.com
The PerfChart below shows the percentage change for the S&P 500 and the nine sector SPDRs. The S&P 500 acts as the benchmark for relative performance. Sectors with greater percentage gains are outperforming the S&P 500. Sectors smaller percentage gains are underperforming. Defining the...
READ MORE
MEMBERS ONLY
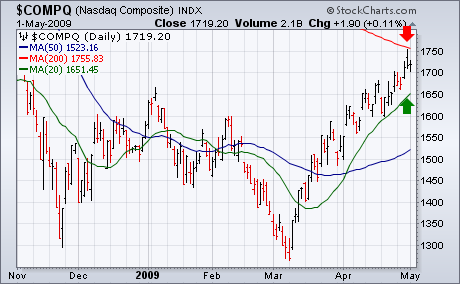
NASDAQ TESTS 200-DAY LINE
by John Murphy,
Chief Technical Analyst, StockCharts.com
One of the problems with doing an analysis of the "stock market" is choosing which market index to represent it. Like most analysts, I rely on the S&P 500 which is generally viewed as the market benchmark. As we've pointed out several times, however,...
READ MORE
MEMBERS ONLY
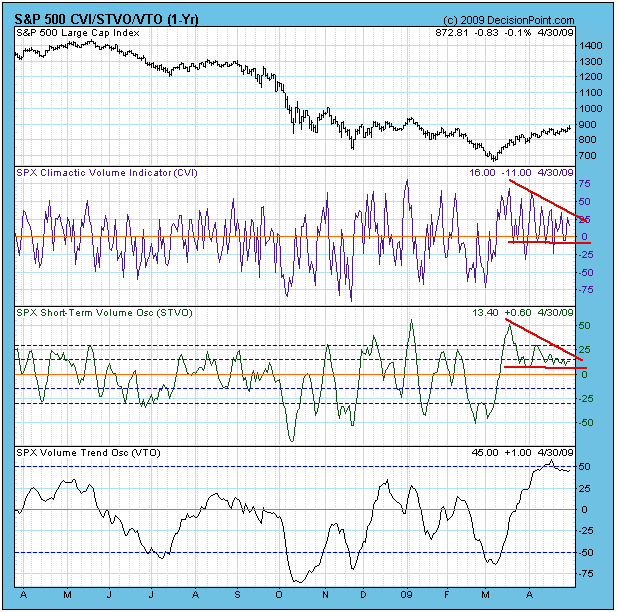
STEADY ADVANCE PERSISTS

by Carl Swenlin,
President and Founder, DecisionPoint.com
I have been referring to the slow, steady advance of the last few weeks as a "correction". To be more specific, it is a "running correction", which means that prices have moved higher as indicators have chopped sideways and lower. This is evident on the chart...
READ MORE
MEMBERS ONLY

THE S&P 500 AND THE CRB INDEX APPEAR TO BE FORMING HEAD AND SHOULDERS BOTTOMS -- A PULLBACK INTO A RIGHT SHOULDER COULD START DURING MAY -- THE NASDAQ COMPOSITE INDEX TESTS ITS 200-DAY LINE
by John Murphy,
Chief Technical Analyst, StockCharts.com
FIRST THE S&P 500... On Friday April 17, I wrote about the possibility that the S&P 500 could be forming a "head and shoulders" bottom. I based that bullish view on the shape of its pattern since last November. Chart 1 shows the potential...
READ MORE
MEMBERS ONLY
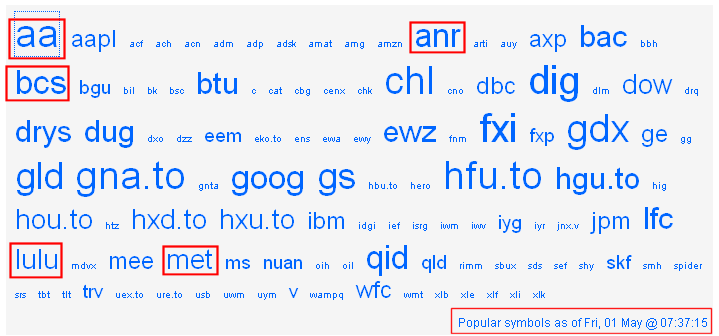
Don't Ignore this Cloud!
by Arthur Hill,
Chief Technical Strategist, TrendInvestorPro.com
Check out theticker cloudto see what's hot every morning. While there will always be the old standby symbols like GLD, DIG, DUG, GOOG, QID and FXI popping up, you are also likely to see some the stars d' jour. For Friday morning, I noticed interest inAlcoa(AA)...
READ MORE
MEMBERS ONLY
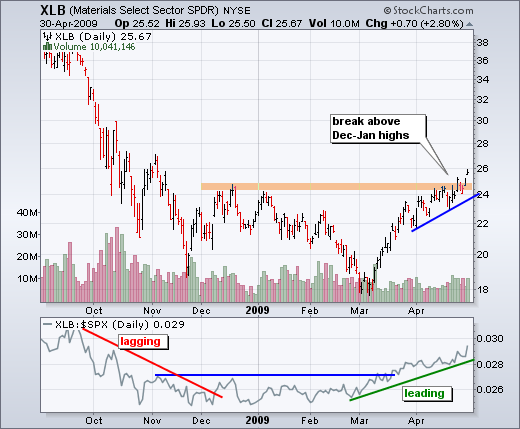
Sector Leaders and Laggards
by Arthur Hill,
Chief Technical Strategist, TrendInvestorPro.com
- Sector ETF Leaders and Laggards (XLY, XLB, XLK, XLP, XLV, XLE)
The Materials SPDR (XLB) was the latest to join the sector breakout club. With a surge from 18 to 26 (~30%), the ETF broke above its Dec-Jan highs over the past five days. The bottom indicator shows the...
READ MORE
MEMBERS ONLY
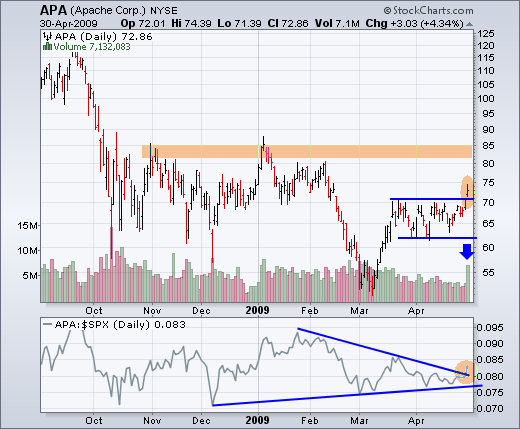
Charts Worth Watching
by Arthur Hill,
Chief Technical Strategist, TrendInvestorPro.com
- Charts Worth Watching (APA, CLF, JOYG, NSM, NVDA, T, NKE, CL).
Despite relative weakness in the energy sector, Apache (APA) broke consolidation resistance with a volume surge on Thursday. Also notice that the price relative turned up over the last few days and broke above the late January trendline. The...
READ MORE
MEMBERS ONLY
GO AWAY IN MAY? REALLY?

by Tom Bowley,
Chief Market Strategist, EarningsBeats.com
Ok, I understand the logic - partially. In order of S&P 500 calendar month performance since 1950, May ranks 8th out of 12 and June ranks 10th out of 12. However, both have produced positive annualized returns and in this period of very low interest rates, does it really...
READ MORE
MEMBERS ONLY

SEMI HOLDRS SURGE TO 200-DAY INTEL, TEXAS INSTRUMENT AND APPLIED MATERIALS CHALLENGE 200-DAY TOO UTILITIES CONTINUE TO SHOW RELATIVE WEAKNESS CAREFUL WITH OSCILLATORS IN A STRONG TREND TREND FOLLOWING WITH MOVING AVERAGE ENVELOPES
by John Murphy,
Chief Technical Analyst, StockCharts.com
SEMIS SURGE TOWARDS 200-DAY ... Chart 1 shows the Semiconductor HOLDRS (SMH) challenging its 200-day moving average with a move above 20 today. On the price chart, SMH broke above resistance from the December-February highs and then started working its way higher. The magenta trendlines show a channel...
READ MORE
MEMBERS ONLY

Triple Top Breakout for QQQQ
by Arthur Hill,
Chief Technical Strategist, TrendInvestorPro.com
A run through the PnF scans reveals a triple top breakout for QQQQ on Wednesday. This means prices pushed the current "x" above the prior two highs (green arrow). Despite this breakout, QQQQ is trading right at potential resistance from the bearish resistance line....
READ MORE
MEMBERS ONLY

SMALL-CAPS LEAD BROAD ADVANCE BONDS BREAK SUPPORT RATES BREAK RESISTANCE DOLLAR INDEX FORMS RISING FLAG EURO ETF BREAKS WEDGE TRENDLINE COMMODITY ETFS BOUNCE GOLD HITS TRENDLINE RESISTANCE
by John Murphy,
Chief Technical Analyst, StockCharts.com
SMALL-CAPS LEAD BROAD ADVANCE... Stocks surged ahead of today's Fed meeting and held their gains after the policy statement. There were no surprises from of the Fed as the FOMC left the Fed Funds target at 0-.25%. Small-caps led the advance with the Russell 2000...
READ MORE
MEMBERS ONLY
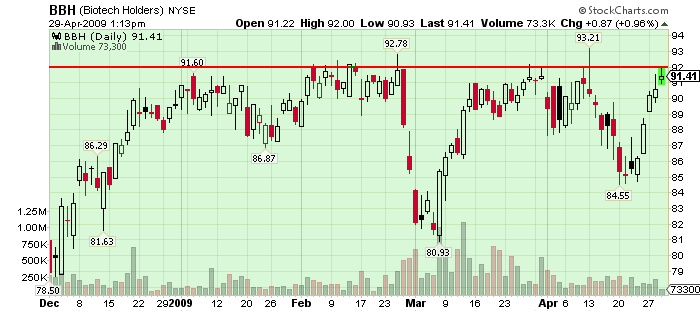
Biotech Holders (BBH) Trying to Breakout Again
Click here for a live version of this chart.
The Biotech ETF has had a devil of a time getting above 92 this year. Right now it is trying again. The low volume numbers don't bode well but remember that ETF volume data can be tricky to interpret....
READ MORE
MEMBERS ONLY

Stocks on the Move
by Arthur Hill,
Chief Technical Strategist, TrendInvestorPro.com
Charts: KFT, LLY, URBN XRAY
Stocks are up sharply in early trading ahead of today's FOMC policy statement. Even though the major stock indices are still looking overbought, the current uptrend remains in place as stocks continue to attract money. It takes some real guts to buy overbought...
READ MORE
MEMBERS ONLY

PERCENT OF NYSE STOCKS ABOVE THEIR 200-DAY AVERAGE IS TESTING MAJOR DOWN TRENDLINE -- THE PERCENT OF NYSE STOCKS ABOVE THEIR 50-DAY LINES IS OVERBOUGHT -- ROTATION OUT OF TREASURY BONDS AND INTO HIGH YIELD CORPORATE BONDS IS A SIGN OF CONFIDENCE
by John Murphy,
Chief Technical Analyst, StockCharts.com
% NYSE STOCKS ABOVE 200 DAY MA TESTS DOWN TRENDLINE ... On April 16, I charted showed the improvement in the percent of NYSE stocks trading over their 200-day moving averages. Chart 1 shows that measure bottoming during the fourth quarter and recently moving up to the highest level in six...
READ MORE
MEMBERS ONLY
A Lot of Resistance Around
by Arthur Hill,
Chief Technical Strategist, TrendInvestorPro.com
-- Financial stocks showing relative weakness
-- Stocks trading near resistance and overbought
-- Bullish considerations
After a big advance the last 9-10 weeks, many stocks are running into resistance. In addition, many are are overbought and ripe for at least a correction or consolidation. The same can be said for many...
READ MORE
MEMBERS ONLY

Financial Stocks Showing Relative Weakness
by Arthur Hill,
Chief Technical Strategist, TrendInvestorPro.com
-- Financial stocks showing relative weakness
-- Stocks trading near resistance and overbought
-- Bullish considerations
With a bounce last week, the Nasdaq 100 ETF (QQQQ) moved above its mid April high and the S&P 500 ETF (SPY) challenged its mid April high. However, some key financial stocks failed to bounce...
READ MORE
MEMBERS ONLY
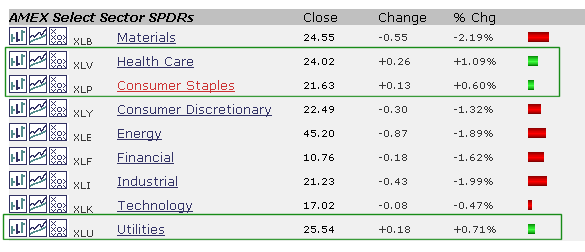
Defensive Sectors Turn Green
by Arthur Hill,
Chief Technical Strategist, TrendInvestorPro.com
The healthcare, utilities and consumer staples sectors are traditionally the defensive sectors that underperform during a broad market advance. This was the case in March and most of April. With Monday's weakness, the defensive sectors held up and all three finished with small gains. It is just one...
READ MORE
MEMBERS ONLY

FOREIGN STOCKS BACK OFF FROM MAJOR RESISTANCE BARRIERS WHICH MAY CAP SPRING RALLY -- OVERSOLD VIX MAY START BOUNCING FROM CHART SUPPORT -- BOLLINGER BANDS HINT AT STOCK WEAKNESS
by John Murphy,
Chief Technical Analyst, StockCharts.com
EMERGING MARKETS BACK OFF FROM 200-DAY AVERAGE... One of the ways to help determine the staying power of the current global rebound is to track the performance of the world's strongest markets. That happens to be in the emerging market area. Judging from the fact that several...
READ MORE
MEMBERS ONLY
Welcome to Art's Charts
by Arthur Hill,
Chief Technical Strategist, TrendInvestorPro.com
Welcome to the first posting day at Art's Charts. This blog will feature bullish and bearish setups for stocks and ETFs. Every week I scan through the chart universe looking for breakouts, strong trends, reversals and key chart patterns. Each setup will feature an annotated chart with detailed...
READ MORE
