MEMBERS ONLY

ANF Forms Inside Day within Rising Wedge

by Arthur Hill,
Chief Technical Strategist, TrendInvestorPro.com
Abercrombie & Fitch (ANF) is part of the retail apparel industry group and the consumer discretionary sector. ANF surged with a gap up in early April, but failed to hold this surge and filled the gap in mid April.
The inability tohold the gap-surge shows weakness. There was another,...
READ MORE
MEMBERS ONLY
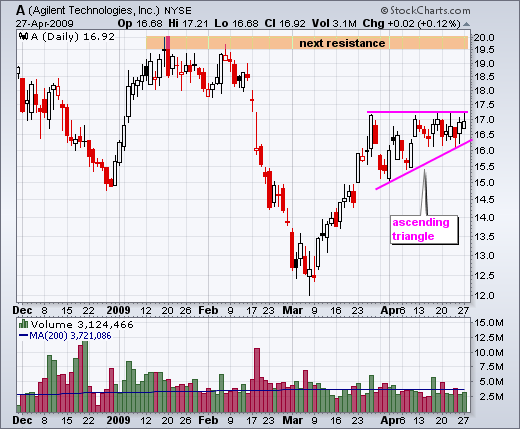
Agilent Traces Out Ascending Triangle
by Arthur Hill,
Chief Technical Strategist, TrendInvestorPro.com
Agilent Technology (A) surged in March and then formed an ascending triangle over the last 4-5 weeks. These classic patterns are bullish continuation patterns that require confirmation with a breakout.
The equal highs around 17.2 mark overhead supply (resistance). The higher lows in April show buying pressure (demand)...
READ MORE
MEMBERS ONLY

CNP Breaks Pennant Resistance
by Arthur Hill,
Chief Technical Strategist, TrendInvestorPro.com
Centerpoint Energy (CNP) is part of the electric utilities group. The defensive utilities sector has been struggling lately, but managed a gain in the face of Monday's market weakness.
Investors may turn to defense if the market weakens further. CNP surged with good volume in mid March and...
READ MORE
MEMBERS ONLY

New High for AD Line
by Arthur Hill,
Chief Technical Strategist, TrendInvestorPro.com
The NYSE AD Line moved above its January high to record a new high for 2009. In contrast, the NY Composite Index remains below its January high. This show of relative strength in the AD Line reflects broad participation in the current advance and bodes well for the current uptrend....
READ MORE
MEMBERS ONLY

MARKET UPTREND STILL INTACT -- NASDAQ IS CLOSEST TO ITS 200-DAY AVERAGE -- HOUSING STOCKS ARE LEADING THE WAY HIGHER -- REFLATION TRADE FAVORS COMMODITY ASSETS -- SOME BOND PRICES ARE RISING

by John Murphy,
Chief Technical Analyst, StockCharts.com
NASDAQ NEARS 200-DAY LINE ... The market bounce that started on March 9 remains intact. As has been the case all year, the technology-dominated Nasdaq market is leading the market higher. Chart 1 shows the Nasdaq Composite Index having cleared its January high and nearing a test of its...
READ MORE
MEMBERS ONLY
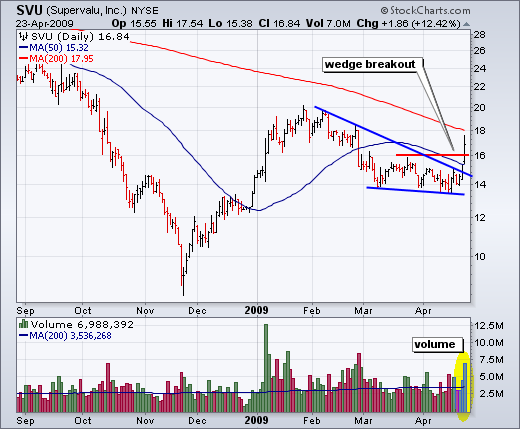
Super Surge for Super Valu
by Arthur Hill,
Chief Technical Strategist, TrendInvestorPro.com
Super Value (SVU) surged above its 50-day moving average and wedge resistance with a big move on big volume. The 200-day moving average is just ahead for the next challenge....
READ MORE
MEMBERS ONLY

QQQQ HOLDS BREAKOUT DEFENSIVE SECTORS LAGGING GOLD BOUNCES OFF SUPPORT GOLD MINERS SETS TESTS 200-DAY - GOLD ADVANCES AS DOLLAR FALLS UUP FORMS RISING WEDGE FXE FORMS FALLING WEDGE DOLLAR STILL UP FOR THE YEAR
by John Murphy,
Chief Technical Analyst, StockCharts.com
A TALE OF TWO MARKETS... Life revolves around the January highs for many stocks, indices and ETFs. Those trading above their January highs are leaders showing relative strength. Those trading below their January highs are the laggards showing less strength. Chart 2 shows the Nasdaq 100 ETF (QQQQ) trading above...
READ MORE
MEMBERS ONLY

Air Products Surges on Big Volume
by Arthur Hill,
Chief Technical Strategist, TrendInvestorPro.com
Air Products (APD) is part of the chemicals group and the basic materials sectors. After surging to resistance in March, the stock consolidated around the 60 the last few weeks. The bulls came out in force as the stock surged to its highest level of the year with big volume...
READ MORE
MEMBERS ONLY

DOW GIVES UP EARLY GAINS AND ESTABLISHES RESISTANCE AT 8000 DIA LOSES MOMENTUM OIL SERVICE HOLDRS CHALLENGE RESISTANCE NABORS AND BJ SERVICES SURGE ON BIG VOLUME SEMI HOLDRS HITS THE 200-DAY INTEL AND KLA-TENCOR MOVE HIGHER ON GOOD VOLUME
by John Murphy,
Chief Technical Analyst, StockCharts.com
DOW FALLS SHARPLY IN FINAL HOUR... Led by weakness in financials, the Dow Industrials gave up its afternoon gains to close with a modest loss on the Wednesday. Chart 1 shows the Average trading at around 8040 in the late afternoon before plunging below 7900 in the final hour of...
READ MORE
MEMBERS ONLY

DOWNSIDE BREADTH HITS AN EXTREME - QQQQ FORMS RISING WEDGE ON 30-MINUTE CHART IWM RETRACES 62% OF MONDAY'S DECLINE QQQQ REMAINS OVERBOUGHT ON DAILY CHART IWM HITS CHANNEL TRENDLINE
by John Murphy,
Chief Technical Analyst, StockCharts.com
SELLING PRESSURE INTENSIFIES... Even though the major-index ETFs (QQQQ,SPY,IWM, DIA) are in clear uptrends, they are also overbought and ripe for a correction or a consolidation. As noted on Monday, prior pullbacks were limited to two days as stocks recovered quite quickly. Monday's decline was...
READ MORE
MEMBERS ONLY
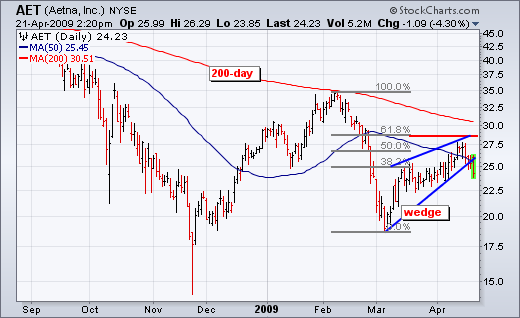
AETNA Breaks Wedge Trendline
by Arthur Hill,
Chief Technical Strategist, TrendInvestorPro.com
Aetna (AET) retraced 62% of the Feb-Mar decline with a rising wedge that peaked in mid April. Both the wedge and the retracement are typical for corrective rallies within bigger downtrends. Also notice that the 200-day moving average is falling and the 50-day moving average is below...
READ MORE
MEMBERS ONLY

S&P 500 REMAINS ABOVE ITS 20-DAY AVERAGE KEEPING THE SHORT-TERM UPTREND INTACT -- THREE WAYS TO USE BOLLINGER BANDS ON DAILY CHARTS
by John Murphy,
Chief Technical Analyst, StockCharts.com
USING BOLLINGER BANDS ON DAILY CHARTS... Stocks bounced back from Monday's selloff. As a result, it's difficult to decide if the rally off the March 9 bottom is over or just pulling back a bit. If it does pullback, how far? One valuable tool to help...
READ MORE
MEMBERS ONLY

RTH Hits Resistance
by Arthur Hill,
Chief Technical Strategist, TrendInvestorPro.com
The Retail HOLDRs (RTH) hit massive resistance around 78-80 for the third time since October. Resistance in this area stems from the October, January and April highs. In addition, the falling 200-day moving average is coming into play. After a run from 60 to 80, RTH is ripe...
READ MORE
MEMBERS ONLY

Wal-Mart Shows Relative Weakness
by Arthur Hill,
Chief Technical Strategist, TrendInvestorPro.com
Wal-Mart (WMT), which is the biggest component in RTH, is leading the way lower with a break below its 50-day moving average on Monday. Notice that WMT peaked at the 200-day moving average on 2-April and did not follow the broader market higher over the last...
READ MORE
MEMBERS ONLY

SPY VOLUME SHRINKS AN EXTREME FOR STOCKS ABOVE THEIR 50-DAY GLD BOUNCES OFF THE 200-DAY MOVING AVERAGE OIL AND ENERGY STOCKS LAG THE BROADER MARKET DOLLAR ETF RECAPTURES THE 50-DAY
by John Murphy,
Chief Technical Analyst, StockCharts.com
SPY EXTENDS HIGHER ON LOWER VOLUME... Despite a clear uptrend since early March, the current rally in SPY is getting stretched as volume declines and overbought conditions extend. Chart 1 shows the S&P 500 ETF (SPY) with a 28-day rally since early March. All told, SPY is...
READ MORE
MEMBERS ONLY
CHANGE IS IN THE AIR AT STOCKCHARTS
Wow. This past week has been a very hectic one here at StockCharts.com. Four - count 'em - four H-U-G-E changes have happened in addition to our 10-year Anniversary Sale is drawing to a close. I posted about most of this stuff in my blog, but...
READ MORE
MEMBERS ONLY
DIFFERENT STRATEGIES FOR DIFFERENT MARKETS

by Tom Bowley,
Chief Market Strategist, EarningsBeats.com
In my last article, I noted that I was "undeniably bullish". I can tell you that nothing occurred these last two weeks to change my mind. More and more corroborating technicals have lined up to suggest this current rally has legs. Perhaps the most important of them all...
READ MORE
MEMBERS ONLY
LUCKY #7

by Richard Rhodes,
Founder and President, Rhodes Capital Management and Rhodes Trading Group
The various US market averages have seen six straight weeks of rally, and one must wonder is "lucky #7" is in the offing. We don't know honestly; however, there are signs the rally off the March 9th low is becoming "long in the tooth"...
READ MORE
MEMBERS ONLY
PULLBACK IS LIKELY, BUT NOT GUARANTEED

by Carl Swenlin,
President and Founder, DecisionPoint.com
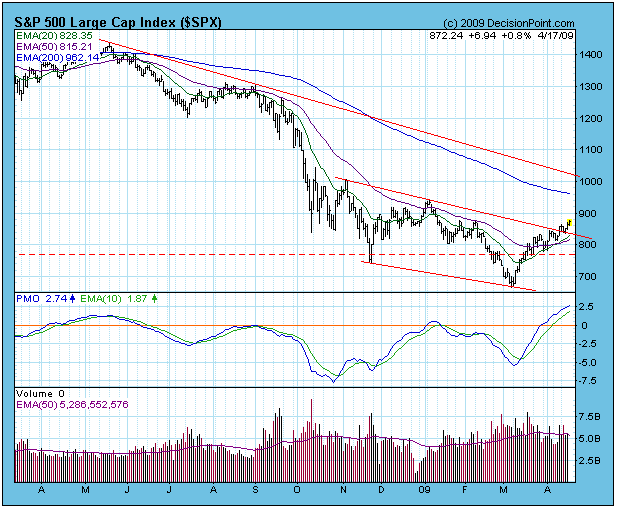
The bear market rally has continued to move prices higher, and the strength is greatest in the smaller-cap stocks. For example, the S&P 500 has rallied 30% from the March lows, but the Rydex S&P Equal Weight ETF (RSP) has advanced 45%. Looking through the...
READ MORE
MEMBERS ONLY
MCCLELLAN OSCILLATOR IS STILL POSITIVE
by John Murphy,
Chief Technical Analyst, StockCharts.com
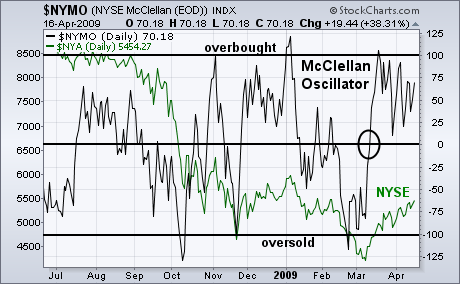
The McClellan Oscillator is a short- to intermediate-term momentum breadth indicator. It's calculated each day by taking the difference between the 39-day and 19-day exponential moving averages of the number of net advances on the NYSE (see Chart School for a more in-depth explanation)...
READ MORE
MEMBERS ONLY
DIA MAINTAINS UPTREND
by Arthur Hill,
Chief Technical Strategist, TrendInvestorPro.com
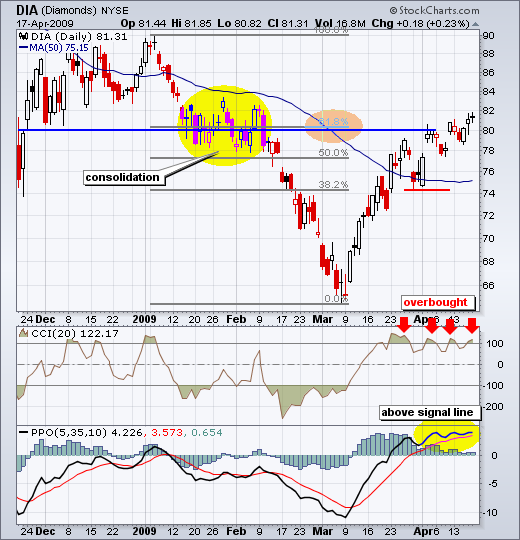
The Dow Industrials ETF (DIA) shows a classic case of becoming overbought and remaining overbought. I featured DIA in ChartWatchers two weeks ago as it hit potential resistance around 80. The song remains the same as DIA finished at 81.31 on Friday.
Let's review resistance. First, the...
READ MORE
MEMBERS ONLY

MCCLELLAN SUMMATION INDEX IS A LONG-TERM BREATH MOMENTUM INDICATOR THAT HAS REACHED A TWO-YEAR HIGH -- WHY THE MARKET COULD BE FORMING A BULLISH HEAD AND SHOULDERS BOTTOM
by John Murphy,
Chief Technical Analyst, StockCharts.com
MCCLELLAN OSCILLATOR IS STILL POSITIVE ... The McClellan Oscillator is a short- to intermediate-term momentum breadth indicator. It's calculated each day by taking the difference between the 39-day and 19-day exponential moving averages of the number of net advances on the NYSE (see Chart School for...
READ MORE
MEMBERS ONLY
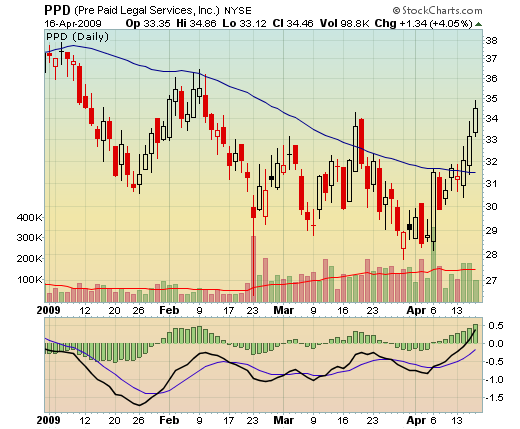
PPD Finally Breaks Out
Click here for a live version of this chart.
We discussed PPD and its long struggle with the 50-day MA in a previous post. Looks like things have finally changed! Should be fun to watch during the next couple of days....
READ MORE
MEMBERS ONLY
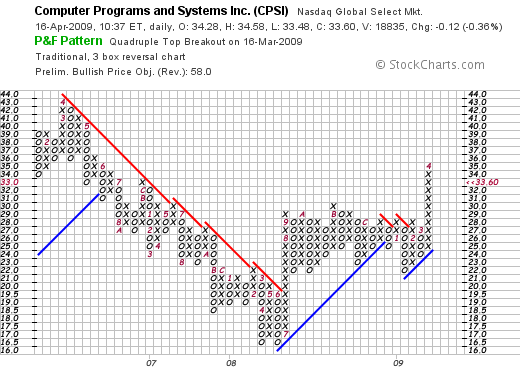
Quadrupal Top Breakout Now Faltering (CPSI)
Click here for a live version of this chart
CPSI has had a pretty impressive P&F chart for a while now. On March 16th, it completed a Quadrupal Top Breakout pattern that is, technically, still in place today. The problem is that CPSI is dangerously close to reversing...
READ MORE
MEMBERS ONLY

LONG-TERM INDICATORS SUGGEST THAT A BOTTOM MAY BE FORMING -- OVER THE SHORT-RUN, HOWEVER, A LOT OF MARKET MEASURES AND STOCKS ARE UP AGAINST 200-DAY AVERAGES WHERE THEY MAY RUN INTO RESISTANCE
by John Murphy,
Chief Technical Analyst, StockCharts.com
A MARKET BOTTOM IS A PROCESS, NOT AN EVENT... Global stock markets have enjoyed a nice rally since mid-March. Most U.S. stock indexes have rallied more than 20%. Some foreign stock indexes (like China) have done even better. Certain commodities (like copper) have also enjoyed a strong runup...
READ MORE
MEMBERS ONLY

A LOT OF LEADING GROUPS HAVE REACHED OVERHEAD RESISTANCE BARRIERS INCLUDING THE NASDAQ, SEMICONDUCTORS, BASIC MATERIALS, AND CONSUMER DISCRETIONARY -- THAT SUGGESTS THAT SPRING RALLY MAY BE NEAR COMPLETION
by John Murphy,
Chief Technical Analyst, StockCharts.com
NASDAQ AND CHIPS UP AGAINST RESISTANCE ... The rally from March 9 has reached a phase where further advances are going to be more difficult. That's because a number of groups that have led the spring rally have reached overhead resistance barriers. Technology is a good example. I'...
READ MORE
MEMBERS ONLY

AUSTRALIAN DOLLAR, COPPER, AND CHINA ARE RALLYING TOGETHER -- SO IS PLATINUM -- DOLLAR BEAR FUND IS RISING
by John Murphy,
Chief Technical Analyst, StockCharts.com
CHINA ISHARES AND AUSSIE DOLLAR TEST 200-DAY AVERAGES... A week ago Friday I showed China iShares testing important resistance barriers. That's still the case. Chart 1 shows China iShares (FXI) testing not only its 200-day average, but its January high around 32. That's an...
READ MORE
MEMBERS ONLY
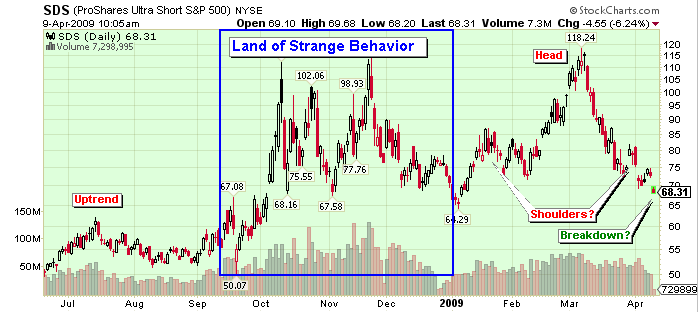
Ticker Cloud leads to SDS Head and Shoulders
Click here for a live version of this chart
SDS is the ProShares Ultra Short S&P 500 ETF. It's a way to invest (gamble really) that the market is going to fall. It showed up today on our Ticker Cloud page as one of today'...
READ MORE
MEMBERS ONLY

BANKS LEAD MARKET HIGHER - REIT ETF BREAKS 50-DAY - PUBLIC STORAGE AND DUKE REALTY BREAK MARCH HIGHS - LEADING AND LAGGING SECTORS - BULLISH PERCENT INDEX LEADERS - DIA CHALLENGES BROKEN SUPPORT
by John Murphy,
Chief Technical Analyst, StockCharts.com
FINANCIALS LEAD THE CHARGE... Stocks opened strong this morning with financials leading the way higher. Chart 1 shows 60-minute bars for the Financials SPDR (XLF) over the last 6-7 weeks. Notice that XLF surged above 9.5 in mid March and then consolidated for around three weeks. As...
READ MORE
MEMBERS ONLY

SPY HITS RESISTANCE AS MACD RISES IWM AND QQQQ HOLD THEIR GAPS BBBY SURGES ON HUGE VOLUME RETAIL SPDR HITS 200-DAY TECHS AND SMALL-CAPS SHOW LEADERSHIP STOCKS TO WATCH (AGILENT, FLOUR, KING PHARMA AND APPLIED MATERIALS)
by John Murphy,
Chief Technical Analyst, StockCharts.com
RESISTANCE COMING INTO PLAY... While this rally may have further room to run, a breather may be in order as resistance levels come into play on a number of charts. As noted last week, stocks became overbought after big advances in March. There are two ways to alleviate overbought conditions:...
READ MORE
MEMBERS ONLY

MARKET PULLS BACK FROM SHORT-TERM OVERBOUGHT CONDITION -WEEKLY AND MONTHLY INDICATORS, HOWEVER, SUGGEST THERE'S MORE UPSIDE TO COME -- THAT'S ALSO TRUE OF THE NASDAQ AND FINANCIALS
by John Murphy,
Chief Technical Analyst, StockCharts.com
CCI IN OVERBOUGHT TERRITORY ... The stock market is undergoing its second straight day of selling. One of the reasons for the pullback is short-term overbought readings in some of our more sensitive momentum indicators. Chart 1, for example, shows the Commodity Channel Index (CCI) reaching overbought territory above 100...
READ MORE
MEMBERS ONLY
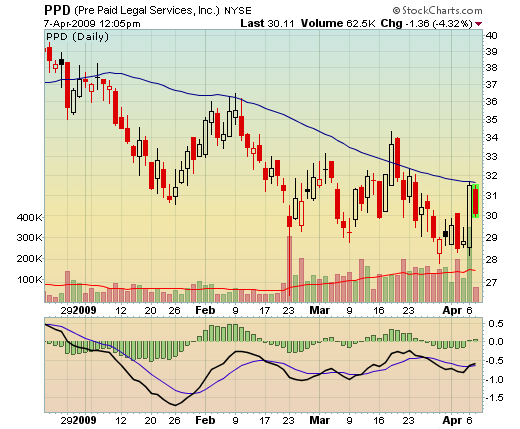
Getting Beat Down Legally (PPD)
Click here for a live version of this chart
Help! Police! Pre-Paid Legal Services (PPD) is getting beat down by its 50-day Moving Average! Again!
This is the third time this year that PPD has failed to penetrate the 50-day MA (blue line). Things were looking promising...
READ MORE
MEMBERS ONLY
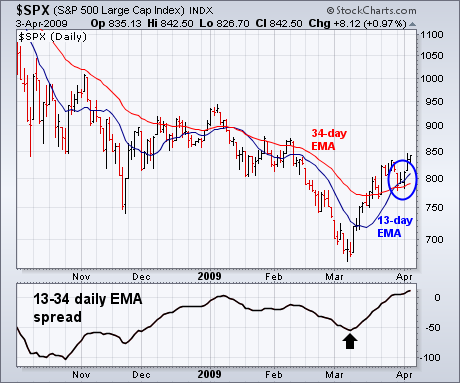
DAILY EMA COMBO TURNS POSITIVE
by John Murphy,
Chief Technical Analyst, StockCharts.com
I've received a number of requests to review the current position of the 13-34 exponential moving averages (EMAs). As you probably know, I place a lot of importance on that combination because of its strong track record over the years. I apply the 13-34 EMA combination...
READ MORE
MEMBERS ONLY
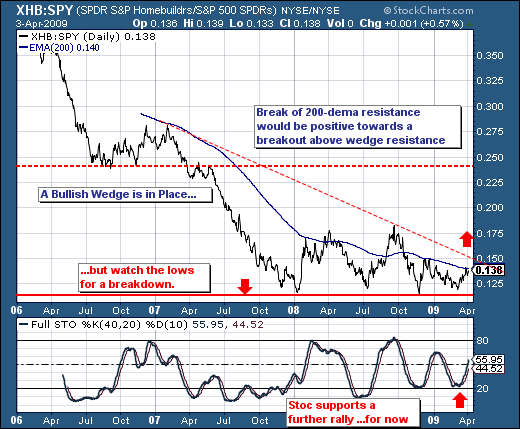
LOOKING AT HOMEBUILDERS
by Richard Rhodes,
Founder and President, Rhodes Capital Management and Rhodes Trading Group
As the market continues it counter-trend bullish rally, we find is more than interesting that the Homebuilders haven't yet taken a leadership role. We would posit that given it was the Homebuilders that was the "canary in the coal mine" for the sharp broader market...
READ MORE
MEMBERS ONLY
UNDERLYING BULLISH SIGNALS STRENGTHENING
by Tom Bowley,
Chief Market Strategist, EarningsBeats.com
I am undeniably bullish right now. My only question at this point is whether this is a very significant bear market rally or the early legs of a new bull market. Believe it or not, I think it's the latter. As pointed out in my last article, this...
READ MORE
MEMBERS ONLY

TEN YEARS YOUNG!
OUR TEN-YEAR CELEBRATION IS NOW ON! Chip started StockCharts.com ten years ago this month and to celebrate we are running our best special ever!
* Subscribe to (or renew) any of our online services for a year and get two additional months of service free!
Normally, you'd...
READ MORE
MEMBERS ONLY
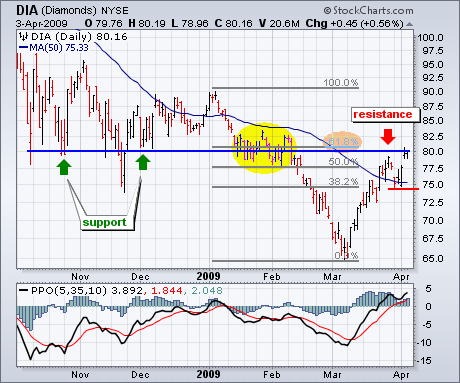
DIA SURGES OFF 50-DAY
by Arthur Hill,
Chief Technical Strategist, TrendInvestorPro.com
The Dow Industrials ETF (DIA) surged off its 50-day moving average with a big advance on Wednesday and a gap on Thursday. While the four-week surge is most impressive, the ETF is running into a resistance zone and becoming overbought. First, broken supports around 80 turn into resistance....
READ MORE
MEMBERS ONLY
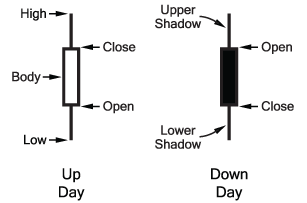
TECHNICAL ANALYSIS 101 - PART 5
This is the fifth part of a series of articles about Technical Analysis from a new course we're developing. If you are new to charting, these articles will give you the "big picture" behind the charts on our site. if you are an "old hand&...
READ MORE
MEMBERS ONLY
RALLY CONTINUES
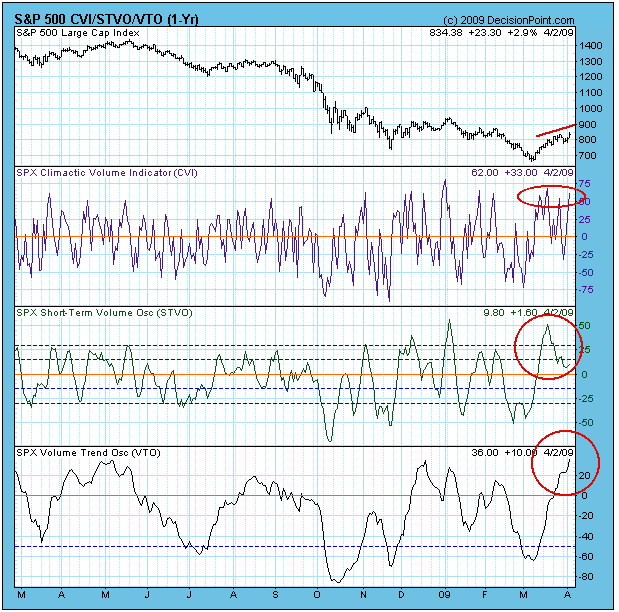
by Carl Swenlin,
President and Founder, DecisionPoint.com
Last Friday I said we should be looking for a short-correction because the CVI (Climactic Volume Oscillator) was very overbought, and prices were approaching overhead resistance. There was a very small correction, but prices kept moving higher, while the CVI zigzagged at overbought levels. We also observed the STVO...
READ MORE
MEMBERS ONLY
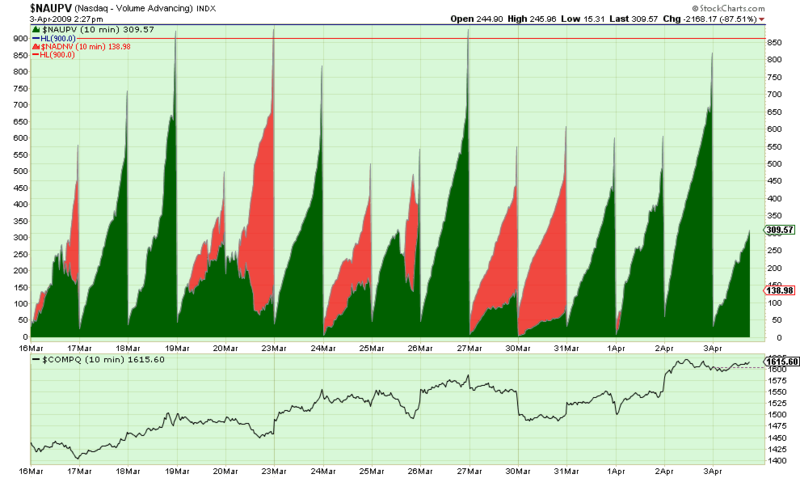
Intraday Up/Down Volume Sentiment Chart
Click here for a live version of this chart.
"Wow. That doesn't look like any financial chart I've ever seen before."
I agree, that is one strange looking chart. What the green area shows is the total amount of "Up" volume - i....
READ MORE
