MEMBERS ONLY

CITIGROUP AND FINANCIALS LEAD OVERSOLD MARKET HIGHER -- OTHER POSITIVES INCLUDE A PULLBACK IN THE DOLLAR, BONDS, AND GOLD AND A BOUNCE IN COPPER AND OIL

by John Murphy,
Chief Technical Analyst, StockCharts.com
CITIGROUP LEADS FINANCIALS HIGHER... News that Citigroup is having a good quarter has pushed that stock sharply higher today and helped spark a global stock rebound. The daily bars in Chart 1 show Citigroup gapping 34% higher (and on rising volume). The 14-day RSI (solid line) is rebounding from...
READ MORE
MEMBERS ONLY
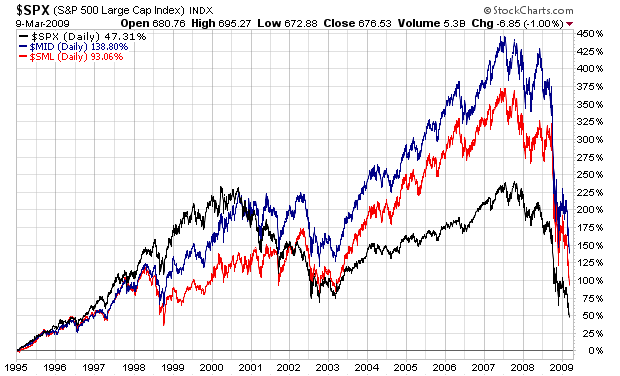
Large Caps, Mid Caps or Small Caps?
Click here for a live version of this chart.
Long term answer: Mid caps. Next question?...
READ MORE
MEMBERS ONLY
SITE NEWS FOR MARCH 7, 2009
NEW "WHAT'S NEW" AREA - We've reworked the "What's New" area on the "Members" page so that it now shows you all of the latest posts from our various blogs. I know that some of you just look at...
READ MORE
MEMBERS ONLY
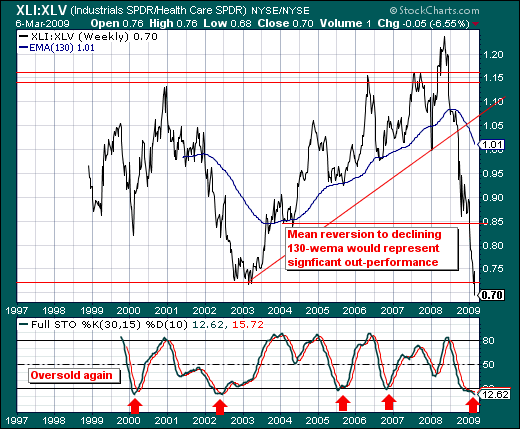
LOOKING TOWARDS SECTOR ROTATION

by Richard Rhodes,
Founder and President, Rhodes Capital Management and Rhodes Trading Group
This year has seen the S&P decline by -24.3%; with the building crescendo of "fear" likely to provide for a bottom that can be traded sooner rather than later. We're looking towards sector rotation to play a large part in our trading strategy;...
READ MORE
MEMBERS ONLY
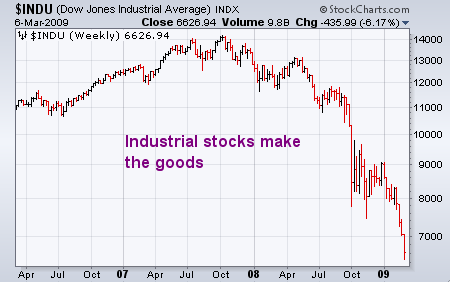
DOW THEORY STILL IN DOWNTREND
by John Murphy,
Chief Technical Analyst, StockCharts.com
At the start of the 20th century, Charles Dow invented the Dow Theory. It was a simple idea. He created two stock indexes -- one for industrial stocks and one for the transports (which were exclusively rails). His reasoning was that both indexes should rise together in a healthy economy. While...
READ MORE
MEMBERS ONLY
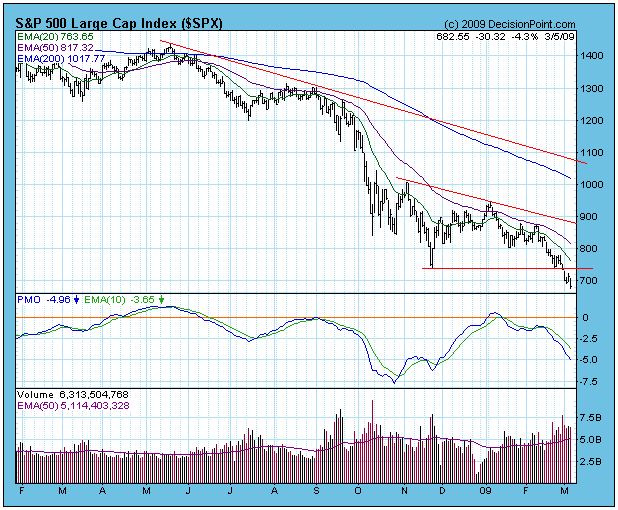
BREAKDOWN!

by Carl Swenlin,
President and Founder, DecisionPoint.com
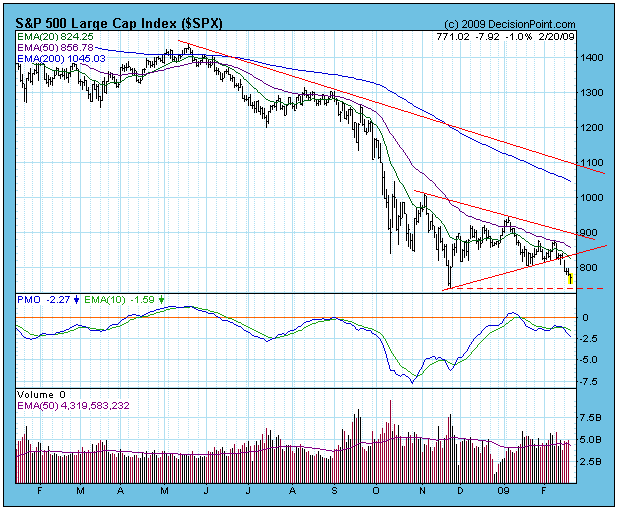
At the end of last week the S&P 500 had declined to and had settled on the support created by the November lows. It was poised to either rally and lock in a double bottom, or break down. On Monday prices broke down through support, and by Thursday&...
READ MORE
MEMBERS ONLY
WHERE'S THE FEAR?

by Tom Bowley,
Chief Market Strategist, EarningsBeats.com
Significant market bottoms generally share many key characteristics. I like to see a spike in volume to get that last wave of selling in place. During this "panicked" phase, it's also important to see pessimism rise to a relative level where we can be fairly confident...
READ MORE
MEMBERS ONLY
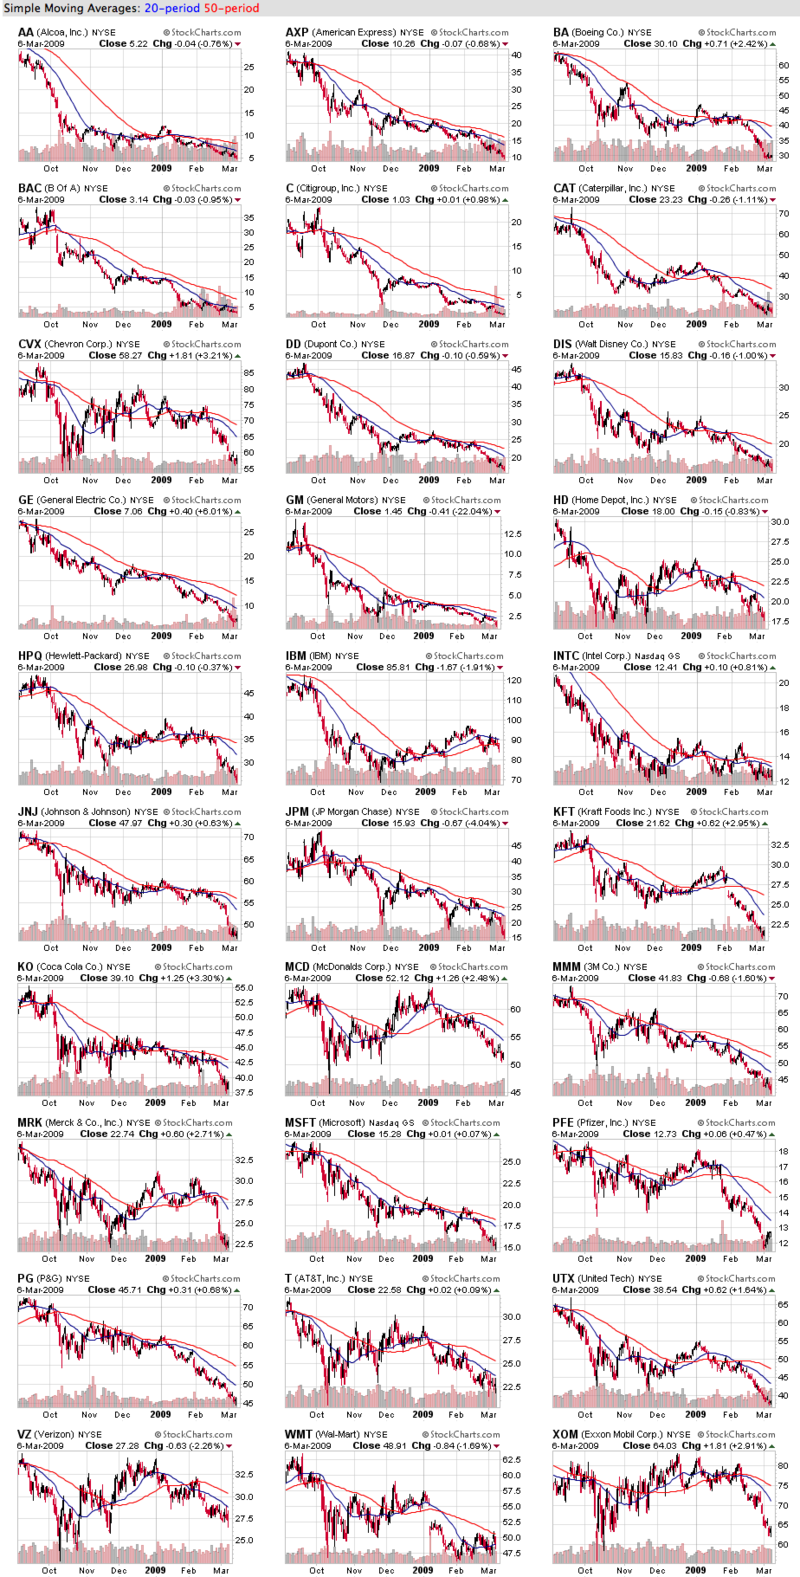
One of These Charts is Not Like the Others (Dow Stocks)
Click here for a live version of these charts.
OK - I apologize for the size of the image above, but it's worth the extra time needed to download I promise!
These are 6-month candlestick charts of the 30 stocks that make up the Dow Jones Industrial Average....
READ MORE
MEMBERS ONLY
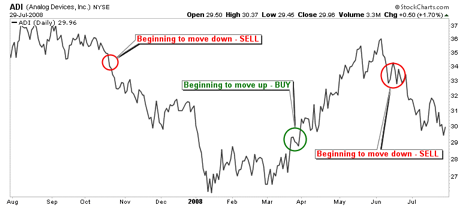
TECHNICAL ANALYSIS 101 - PART 3
This is the third part of a series of articles about Technical Analysis from a new course we're developing. If you are new to charting, these articles will give you the "big picture" behind the charts on our site. if you are an "old hand&...
READ MORE
MEMBERS ONLY

DOW THEORY STILL IN DOWNTREND -- RAILS ARE TIED TO TREND OF COMMODITIES WHICH IS DOWN -- WE CAN'T REFLATE WITH A RISING DOLLAR
by John Murphy,
Chief Technical Analyst, StockCharts.com
DOW THEORY STILL IN DOWNTREND... At the start of the 20th century, Charles Dow invented the Dow Theory. It was a simple idea. He created two stock indexes -- one for industrial stocks and one for the transports (which were exclusively rails). His reasoning was that both indexes should rise together...
READ MORE
MEMBERS ONLY

STOCKS FALL SHARPLY - FLIGHT TO SAFETY TRADE RESUMES -- BONDS GAP HIGHER - VOLUME SURGES ON NYSE AS PRICE DECLINE ACCELLERATES
by John Murphy,
Chief Technical Analyst, StockCharts.com
STOCKS FALL IN BROAD DECLINE... Today's Market Message was written by Arthur Hill. - Editor
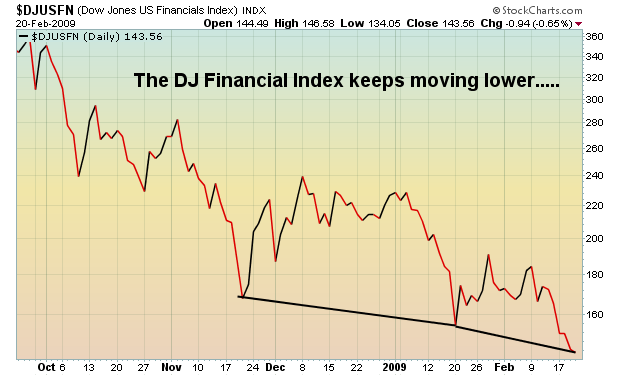
It was a sea of red on Wall Street. All nine sectors were lower with financials leading the way. Just when you thought they could not go any lower, chart 1 shows the Financials...
READ MORE
MEMBERS ONLY

EURO FALLS AFTER RATE CUT -- GOLD HITS SUPPORT ZONE -- TOP 10 DOW COMPONENTS - BIG BLUE BREAKS WEDGE SUPPORT
by John Murphy,
Chief Technical Analyst, StockCharts.com
EURO FALLS AFTER ECB DECISION... Today's Market Message was written by Arthur Hill. - Editor
On Thursday, the European Central Bank (ECB) cuts its key rate by 50 basis points (bps) to 1.5%. Even though their key rate is at its lowest level ever, analysts expect further rate...
READ MORE
MEMBERS ONLY
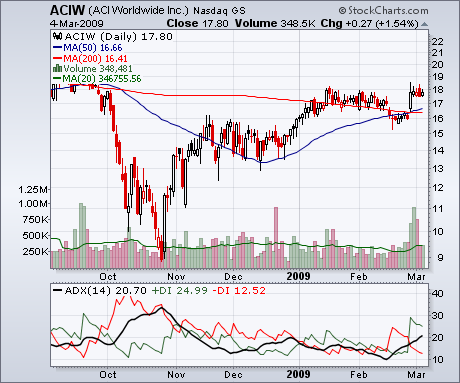
The Only Nasdaq Stock in a New Uptrend Right Now (ACIW)
Click here for a live version of this chart.
Only one Nasdaq stock began a new uptrend today. Well... began a new uptrend as defined by the ADX indicator. ACI Worldwide Inc recently had a bullish 50/200 Moving average crossover (corresponding to a nice bump up on good volume)...
READ MORE
MEMBERS ONLY

STOCKS GET OVERSOLD BOUNCE -- ENERGY AND MATERIALS LEAD THE WAY -- OIL AND BASE METALS JUMP OVER 8%
by John Murphy,
Chief Technical Analyst, StockCharts.com
STOCKS STAGE BROAD ADVANCE... Today's Market Message was written by Arthur Hill. - Editor
The stock market staged a broad advance on Wednesday with eight of nine sectors moving higher. While this advance looks impressive by itself, it needs to be considered in the context of the prior decline....
READ MORE
MEMBERS ONLY

STRANGE BEHAVIOR IN THE VIX -- VOLATILITY REMAINS RELATIVELY HIGH -- PUT/CALL RATIO STAYS SUBDUED -- SMOOTHING A PRICE SERIES
by John Murphy,
Chief Technical Analyst, StockCharts.com
VIX LAGS THE S&P 500 ... Today's Market Message was written by Arthur Hill. - Editor
The S&P 500 Volatility Index ($VIX) measures the implied volatility for a basket of S&P 500 options, both puts and calls. John Murphy pointed out a rising VIX...
READ MORE
MEMBERS ONLY
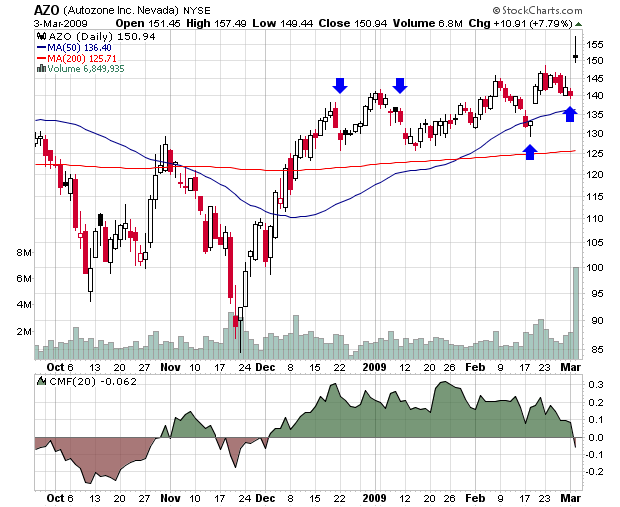
Vroom! Autozone Jumps the Gap (AZO)
Click here for a live version of this chart
After gapping down during December and January, AutoZone gapped up significantly in mid February and zoomed upwards today hitting a high of 157 at one point. So why is the Chaikin Money Flow not zooming upwards as well? The CMF gave...
READ MORE
MEMBERS ONLY

FOREIGN STOCK CASH INDEXES (EXCEPT JAPAN) ARE STILL ABOVE THEIR 2002 LOWS -- THAT'S BECAUSE THEY HAD FURTHER TO FALL THAN THE U.S. -- THE U.S. DOLLAR IS RISING BECAUSE FOREIGN CURRENCIES ARE FALLING
by John Murphy,
Chief Technical Analyst, StockCharts.com
GLOBAL BENCHMARKS... A couple of readers ask where foreign stock markets were in relation to their 2002 lows. And they wanted to see the charts of the actual cash markets instead of Exchange Traded Funds. Charts 1 through 5 show five major foreign stock benchmarks through yesterday's close....
READ MORE
MEMBERS ONLY

THE ONLY STOCK FUNDS GOING UP ARE BEAR FUNDS -- THE VIX IS ALSO RISING -- THE DOLLAR CONTINUES TO RISE ON SAFE HAVEN BUYING -- RUSSELL 2000 SMALL CAP INDEX BREAKS NOVEMBER LOW -- THE NASDAQ MAY BE NEXT -- TREASURY BONDS BOUNCE
by John Murphy,
Chief Technical Analyst, StockCharts.com
INVERSE ETFS ARE RISING ... Rather than showing you pictures of falling stock indexes, I'm going to show you charts of stock indexes that are rising. That would of course be inverse (or bear) ETFs. These inverse funds are designed to trade in the opposite direction of their respective...
READ MORE
MEMBERS ONLY

GLOBAL STOCKS UNDERCUT NOVEMBER LOWS -- MORE 2002 LOWS ARE BEING THREATENED -- BONDS AND THE DOLLAR ARE ONLY WINNERS -- COMMODIITES REMAIN WEAK
by John Murphy,
Chief Technical Analyst, StockCharts.com
NOWHERE TO HIDE... Another massive loss by AIG and problems at HSBC, which is Europe's biggest bank, have helped send global stocks sharply lower today. The heavy selling started in Asia before spreading to Europe and the U.S. The Dow and S&P 500 broke their...
READ MORE
MEMBERS ONLY
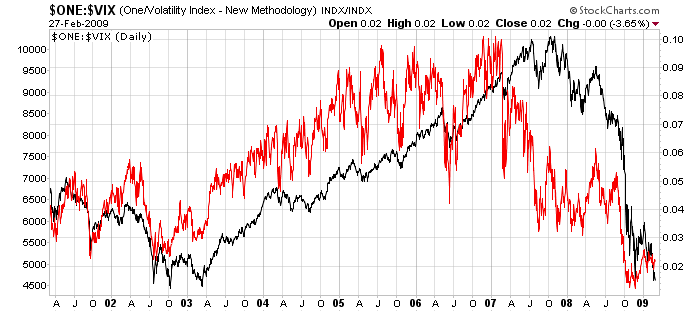
What Did the VIX Know and When Did It Know It?
Click here for a live version of this chart
The VIX is the Volatility Index published by the Chicago Board Options Exchange (CBOE). It measures the "implied volatility" of a hypothetical SPX option created from a weighted average of several actual SPX options. (For all the gory details,...
READ MORE
MEMBERS ONLY

WEAK ECONOMIC NUMBERS PUSH MARKET BACK NEAR 2002 LOWS -- DOWNSIDE TARGETS FOR THE DOW AND S&P IF THOSE LOWS ARE BROKEN
by John Murphy,
Chief Technical Analyst, StockCharts.com
WEAK ECONOMIC NUMBERS PUSH STOCKS LOWER... The Dow Industrials and the S&P 500 closed at the lowest level in twelve years on Monday. I cautioned, however, that the most important close of the week would take place on Friday. That's because today is the last trading...
READ MORE
MEMBERS ONLY

WEAKNESS SPREADS TO OTHER SECTORS - HEALTHCARE SPDR BREAKS JANUARY LOW -- TECH SPDR BATTLES SUPPORT -- ENERGY SPDR TESTS 2008 LOWS -- UTILITIES SPDR BREAKS NOVEMBER LOW
by John Murphy,
Chief Technical Analyst, StockCharts.com
SECTOR LEADERS SUCCUMB TO THE BEAR... Today's Market Message was written by Arthur Hill. - Editor
There are not many places to hide in this market. Richard Russell, of Dow Theory Letters, used to say: "In a bear market, everyone loses, and the winner is the one who...
READ MORE
MEMBERS ONLY

BONDS COME UNDER PRESSURE -- INTEREST RATES RISE -- SHORT-TERM RATES REFLECT UNCERTAINTY
by John Murphy,
Chief Technical Analyst, StockCharts.com
BONDS MOVER LOWER ... Today's Market Message was written by Arthur Hill. - Editor
Bonds are coming under pressure from the prospect of increasing supply. The bailouts and stimulus package will require the government to raise large amounts of money through bond auctions (sales). Today, the government is set to...
READ MORE
MEMBERS ONLY

The Battle for Apple (AAPL)
Click here for a live version of this chart.
Apple has been bouncing around $90 since October. Is that support going to hold? One way to gauge the strength of a support level is to use the "Vol by Price" overlay - the horizontal histogram on the left side...
READ MORE
MEMBERS ONLY

QQQQ RALLIES BACK -- YEN ETF CONFIRMS DOUBLE TOP -- NIKKEI TESTS OCTOBER LOW -- OIL SURGES FROM OVERSOLD LEVELS -- XLE AND OIH FAIL TO FOLLOW OIL HIGHER
by John Murphy,
Chief Technical Analyst, StockCharts.com
STOCKS RECOVER FROM LOWS... Today's Market Message was written by Arthur Hill. - Editor
Stocks dipped sharply lower in early trading, but staged a tech-led comeback in the afternoon. Nothing has changed on the daily charts, but I did notice a couple of interesting patterns on the intraday...
READ MORE
MEMBERS ONLY

UPSIDE VOLUME FAILS TO IMPRESS -- SPY REMAINS WITH SUPPORT BREAK -- QQQQ HOLDS DOWN GAP -- IWM AND DIA FORM HARAMI
by John Murphy,
Chief Technical Analyst, StockCharts.com
SPY TESTS NOVEMBER LOW... Today's Market Message was written by Arthur Hill. - Editor
The stock market surged on Tuesday with the Nasdaq 100 ETF (QQQQ) and S&P 500 ETF (SPY) both gaining over 3.5%. This is an impressive gain when viewed as a single day....
READ MORE
MEMBERS ONLY

GOLD IS BACKING OFF FROM 1,000 AS GOLD STOCKS FALL BELOW 200-DAY AVERAGE -- GOLD GIVES FIRST SHORT-TERM SELL SIGNAL IN MORE THAN A MONTH
by John Murphy,
Chief Technical Analyst, StockCharts.com
GOLD STOCKS BACK BELOW 200-DAY AVERAGE... Gold stocks are coming under new selling pressure. Chart 1 shows the Market Vectors Gold Miners ETF (GDX) trading back below its 200-day moving average today. Part of that selling is coming from the two biggest gold stocks. Chart 2 shows Barrick...
READ MORE
MEMBERS ONLY
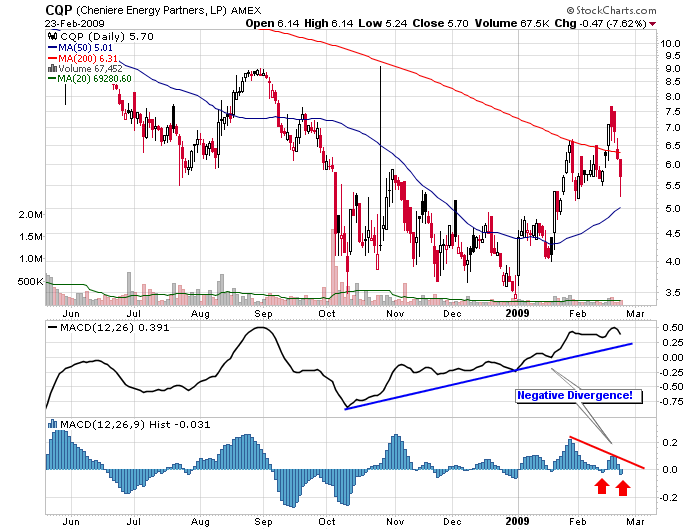
Up + Down = Down (CQP)
Click here for a live version of this chart.
The MACD Histogram shows the change in momentum of the MACD Line. The MACD Line - in turn - shows the change of momentum in the underlying stock. In the case of CQP, the MACD Line has been moving up pretty steadily since...
READ MORE
MEMBERS ONLY

DOW AND S&P 500 CLOSE BELOW 2002 BOTTOM -- TREASURY BONDS BOUNCE ALONG WITH THE DOLLAR -- GOLD HOLDS FIRM -- A RISING VIX IS ANOTHER WARNING SIGNAL FOR STOCKS
by John Murphy,
Chief Technical Analyst, StockCharts.com
2002 LOWS UNDER PRESSURE ... Price declines in excess of 3% pushed the Dow and S&P 500 to the lowest closing price in twelve years. The monthly bars in Charts 1 and 2 show those two indexes closing under the previous bear market low formed in the fourth quarter...
READ MORE
MEMBERS ONLY
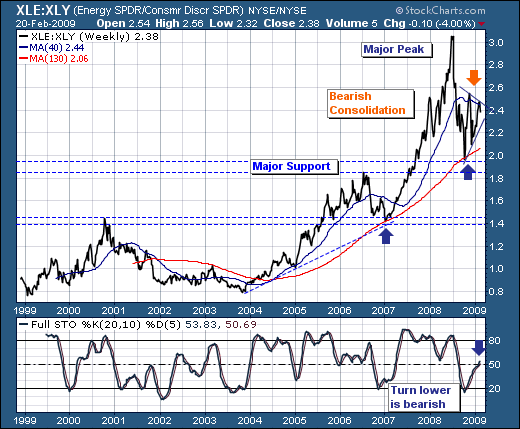
BE PREPARED
by Richard Rhodes,
Founder and President, Rhodes Capital Management and Rhodes Trading Group
In our last commentary, we noted that the S&P Energy ETF (XLE) was in the process of forming a bearish consolidation that argues for sharply lower prices. And since then, prices have consolidated further, but
are now poised to breakdown below trendline support and the October-2008 lows....
READ MORE
MEMBERS ONLY
MASTERING OUR BLOGS
In case you missed it, we are now publishing a ton of new content about charting and technical analysis on our seven(!) different blogs. One of the great things about blogs is that you can "subscribe" to a blog and then get notified as soon as anything new...
READ MORE
MEMBERS ONLY
JUICING UP YOUR RETURNS
by Tom Bowley,
Chief Market Strategist, EarningsBeats.com
I receive a lot of questions regarding the "ultra" shares and "ultrashort" shares and how to effectively trade them. In particular, there are always questions asking why those "juiced" ETF returns don't correspond to the indices they're supposed to track...
READ MORE
MEMBERS ONLY
TECHS TAKE A PUNCH

by Arthur Hill,
Chief Technical Strategist, TrendInvestorPro.com
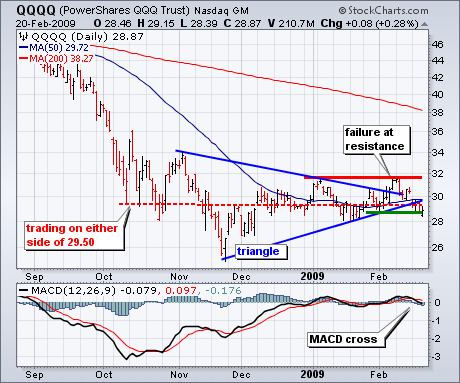
Two weeks ago I featured the Nasdaq 100 ETF (QQQQ) with a triangle breakout, strong OBV and relative strength. The ETF surged to resistance from the early January high, but ultimately failed to break above this key level. With a sharp decline over the last eight trading days, the trading...
READ MORE
MEMBERS ONLY
A LOT OF MARKETS ARE AT CRITICAL CHART JUNCTURES...
by John Murphy,
Chief Technical Analyst, StockCharts.com
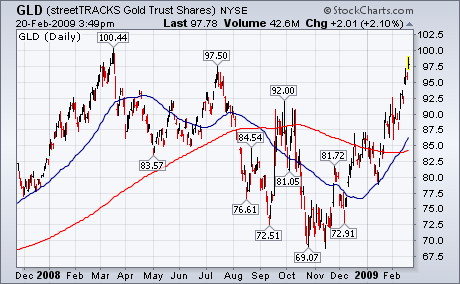
GOLD TOUCHES $1000 FOR FIRST TIME IN A YEAR... A number of financial markets are testing important chart points. Let's start with gold. Bullion touched $1,000 today for the first time since last March. Chart 1 shows the streetTracks Gold Trust (GLD) very close to touching its...
READ MORE
MEMBERS ONLY
RETEST
by Carl Swenlin,
President and Founder, DecisionPoint.com
The long-awaited retest of the November lows has finally arrived. The S&P 500 is still slightly above that support, but the Dow has penetrated it. Even though every rally since November has been greeted with intense hope of a new advance that would end the bear market,...
READ MORE
MEMBERS ONLY
TECHNICAL ANALYSIS 101 - PART 2
This is the second part of a series of articles about Technical Analysis from a new course we're developing. If you are new to charting, these articles will give you the "big picture" behind the charts on our site. if you are an "old hand&...
READ MORE
MEMBERS ONLY

A LOT OF MARKETS ARE AT CRITICAL CHART JUNCTURES -- GOLD REACHES $1,000 TARGET WHILE DOLLAR PULLS BACK FROM ITS NOVEMBER HIGH -- MAJOR MARKET INDEXES ARE TESTING THEIR NOVEMBER LOW AND THEIR 2002 BOTTOM
by John Murphy,
Chief Technical Analyst, StockCharts.com
GOLD TOUCHES $1000 FOR FIRST TIME IN A YEAR... A number of financial markets are testing important chart points. Let's start with gold. Bullion touched $1,000 today for the first time since last March. Chart 1 shows the streetTracks Gold Trust (GLD) very close to touching its...
READ MORE
MEMBERS ONLY
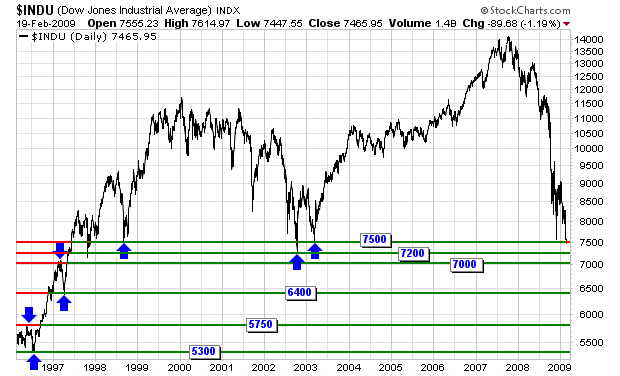
Support for the Dow? ($INDU)
Click here for a live version of this chart.
Today the Dow Jones Industrials closed below its 6 year low just under 7500. What's the next important support level? What's the one below that? (and, gulp, the one below that?) Here you go. Let's...
READ MORE
MEMBERS ONLY

DOW BREAKS NOVEMBER LOW -- FINANCIALS LEAD LOWER -- SHAREHOLDERS BAILOUT OF CITIGROUP -- GE TRADES LIKE A BIG BANK -- DOW STOCKS UNDER $10 -- MACD TURNS BEARISH FOR THE NASDAQ -- EUROSTOXX ETF TESTS SUPPORT ZONE
by John Murphy,
Chief Technical Analyst, StockCharts.com
DOW CLOSES BELOW NOVEMBER LOW... Today's Market Message was written by Arthur Hill. - Editor
As noted yesterday, a close below 7552.29 in the Dow Industrials would confirm a Dow Theory sell signal. The Dow Transports already did its part with a close below the November (closing) low...
READ MORE
MEMBERS ONLY
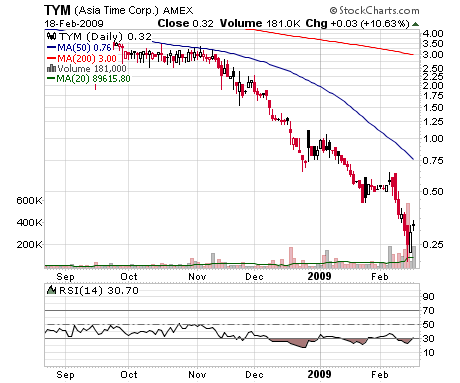
Bottom Feeding: Time for Asia Time? (TYM)
Click here for a live version of this chart.
Trying to catch a "falling knife" like Asia Time (TYM) is extremely risky in any market. Doing it in today's market is pure folly. And yet... TYM is the only stock on any of the major markets...
READ MORE
