MEMBERS ONLY

DOW INDUSTRIALS TESTS NOVEMBER LOW -- DOW TRANSPORTS BREAKS NOVEMBER LOW -- MARKET BREADTH DETERIORATES -- VIX AND VXN BREAK ABOVE 50-DAY LINES -- A NEW VOLATILITY BASED ETN -- MOSAIC AND POTASH FORM RISING WEDGES -- MONSANTO TESTS SUPPORT

by John Murphy,
Chief Technical Analyst, StockCharts.com
DOW THEORY REMAINS BEARISH... Today's Market Message was written by Arthur Hill. - Editor
Dow Theory remains on a sell signal as the Dow Transports broke below its late November low. Before moving on to the charts, let's review some Dow Theory basics. A Dow Theory sell...
READ MORE
MEMBERS ONLY
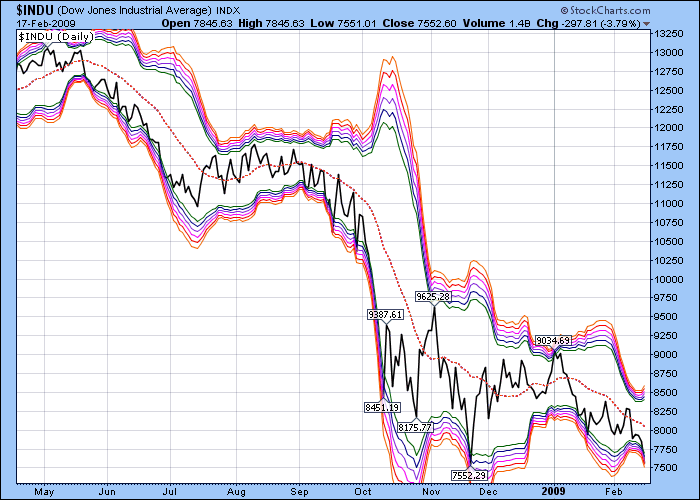
Bollinger Band "Topo Map" ($INDU)
Click here for a live version of this chart.
Based on the statistical concept of Standard Deviations, Bollinger Bands graphically illustrate how "far away" prices are from their "average" value. Traditionally, 2.0 standard deviations are used to determine where the upper and lower bands should...
READ MORE
MEMBERS ONLY

PLAYING DEFENSE WITH THE SECTOR ROTATION MODEL -- THE NEW GOLD STANDARD -- FINANCIAL SPDR HITS NEW LOW AND LEADS MARKET LOWER -- S&P HITS THREE-MONTH LOW -- BONDS BOUNCE AS STOCKS WEAKEN -- GOLD AND SILVER SURGE -- WATCH MY BLOOMBERG INTERVIEW HERE
by John Murphy,
Chief Technical Analyst, StockCharts.com
SECTOR ROTATION MODEL ... One of our readers asked for more information on the Sector Rotation Model shown below. [This version can be found under the AMEX SPDRs part of the Performance Charts]. The model shows which sectors tend to lead at various stages of the business cycle. In my new...
READ MORE
MEMBERS ONLY

GLOBAL STOCKS WEAKEN -- THE DOW AND S&P 500 REACH LOWEST LEVELS SINCE NOVEMBER -- GOLD AND THE DOLLAR JUMP SHARPLY AS FOREIGN CURRENCIES TUMBLE -- BONDS RISE AS STOCKS FALL
by John Murphy,
Chief Technical Analyst, StockCharts.com
STOCKS FALL SHARPLY... Stocks are falling sharply all over the world. Most foreign markets fell on Monday when our markets were closed and continued their fall today. Our market is just following along. On Friday, I showed a point & figure chart of the S&P 500 on a...
READ MORE
MEMBERS ONLY

Long-Term Log Scale Chart Provides Context ($INDU)
How bad is it? How big was the Internet bubble? How does the current decline compare to the 1987 crash? It's all here in black and white (and red and blue). On a log scale chart like this, movements of the same percentage appear to have the same...
READ MORE
MEMBERS ONLY

LOW PUT/CALL RATIO IS A POTENTIALLY NEGATIVE SIGN FOR THE STOCK MARKET -- POINT & FIGURE CHARTS OF THE MAJOR MARKET INDEXES -- THE SECOND EDITION OF THE VISUAL INVESTOR IS MY NEWEST AND MY FAVORITE BOOK -- I'LL BE ON BLOOMBERG TONIGHT AT 5:10 NYT
by John Murphy,
Chief Technical Analyst, StockCharts.com
LOW PUT-CALL RATIO IS NEGATIVE SIGN ... One of things that worries me about the current market is the unusually low reading in the CBOE Put/Call Ratio (CPC). The red line in Chart 1 is a 5-day moving average of the CPC which smooths out its daily trend....
READ MORE
MEMBERS ONLY

After the Head and Shoulders (NDN)
NDN has been falling after completing a classic Head & Shoulders chart pattern back in January. Today was the first set of positive technical signals for the stock in quite a while - a bullish MACD crossover, a rising RSI line and a bullish Parabolic SAR signal. While all of these...
READ MORE
MEMBERS ONLY

STOCKS RECOVER IN FINAL HOUR -- XLF FORMS HAMMER -- RKH TRACES OUT DRAGON FLY DOJI -- RETAIL HOLDERS FAILS AT 50-DAY -- KOHLS GAPS DOWN -- TIFFANY DECLINES ON HIGH VOLUME -- WAL-MART HITS RESISTANCE
by John Murphy,
Chief Technical Analyst, StockCharts.com
STOCKS STAGE LATE RECOVERY... Today's Market Message was written by Arthur Hill. - Editor
Stocks were down sharply in afternoon trading, but news of a mortgage relief program sparked a dramatic rally in the final hour. The Nasdaq (+.73%) and the Nasdaq 100 (+1.28%) led the recovery by...
READ MORE
MEMBERS ONLY

DOW LEADS MARKET LOWER - VIX REMAINS AT HIGH LEVELS -- VOLATILITY INDICES CONSOLIDATE
by John Murphy,
Chief Technical Analyst, StockCharts.com
DOW BREAKS TO NEW LOWS... Today's Market Message was written by Arthur Hill. - Editor
With a sharp decline in early trading on Thursday, the Dow Industrials broke below the January-February lows. Chart 1 shows the Dow Industrials trading at its lowest level of the year today. In...
READ MORE
MEMBERS ONLY

STOCKS FIRM AFTER SHARP DECLINE -- SPY AND IWM REMAIN WITHIN CONSOLIDATIONS -- QQQQ SHOWS GAIN FOR 2009 -- TWO KEY FINANCIAL ETFS FORM INSIDE DAYS
by John Murphy,
Chief Technical Analyst, StockCharts.com
LARGE TRIANGLES CONTINUE TO EVOLVE... Today's Market Message was written by Arthur Hill. - Editor
Last week I featured a chart of the S&P 500 ETF (SPY) with a rather large triangle over the last few months. Chart 1 shows this pattern still at work with an...
READ MORE
MEMBERS ONLY

BONDS SURGE ON BAILOUT CONCERNS -- LONG-TERM RATES HIT RESISTANCE - GOLD EXTENDS ITS GAINS AND COVERAGE -- USING SHORT-TERM RSI TO IDENTIFY PULLBACKS
by John Murphy,
Chief Technical Analyst, StockCharts.com
BONDS EXTEND ADVANCE... Today's Market Message was written by Arthur Hill. - Editor
As John Murphy noted, there was a flight to safety as money charged into gold, bonds and the Dollar on Tuesday. Bonds and gold added to their gains with another surge early Wednesday. The rise in...
READ MORE
MEMBERS ONLY

McClellan Summation Index Struggling to Stay Positive
Click here for a live version of this chart.
The McClellan Summation Index is a great market indicator that recently set some all-time record lows back at the end of last year. Since then, it has bounced back into positive territory, but over the past couple of days a...
READ MORE
MEMBERS ONLY

STOCKS FALL IN HEAVY TRADING ON BAILOUT PLAN -- DROP IN EURO PUSHES DOLLAR HIGHER AND MOST COMMODITIES LOWER -- GOLD AND THE YEN CONTINUE TO ATTRACT SAFE HAVEN MONEY
by John Murphy,
Chief Technical Analyst, StockCharts.com
STOCKS FALL IN HEAVY TRADING ... The stock market reacted badly to release of the latest bailout plan. All of the major market indexes lost more than 4%. Charts 1 and 2 show the Dow Diamonds and the S&P 500 SPDRs falling in heavy trading. Both indexes met resistance...
READ MORE
MEMBERS ONLY

STOCKS SELL OFF ON BAILOUT PACKAGE AS FINANCIALS LEAD DECLINE -- BONDS AND GOLD BOUNCE IN SAVE HAVEN BID -- GLD AND BARRICK GOLD CHALLENGE AUTUMN HIGHS
by John Murphy,
Chief Technical Analyst, StockCharts.com
STOCKS FALL IN HEAVY TRADING ... Stocks have sold off in heavy trading after details of the new bailout plan were released. The hourly bars in Chart 1 show the S&P 500 SPDRS tumbling more than 3% in heavy trading. It's important to note that the recent...
READ MORE
MEMBERS ONLY

Anatomy of a Doji (STAA)
STAA put in a huge Doji on its daily chart today. Technically, a doji is a candlestick where the open and the close are the same. The huge upper shadow and relatively small lower candle makes STAA's Doji especially striking. It is very close to being a "...
READ MORE
MEMBERS ONLY
NEW BLOGS, NEW CHARTWATCHERS, NEW BOOK FROM JOHN MURPHY!
Hello Fellow ChartWatchers!
This week is the start of big changes here at StockCharts.com. We are moving much of our free content over into a new set of Blogs. ("Blogs" are Web Logs - collections of articles on a particular topic.) Things like, well, this newsletter are actually...
READ MORE
MEMBERS ONLY

MACD LINES SHOW SOME PROMISE
by John Murphy,
Chief Technical Analyst, StockCharts.com
A reader complained this week that we failed to point out the "negative divergence" in the daily MACD lines during January prior to the latest downturn. The reason I didn't point it out was because none existed. In fact, it may be the other way around....
READ MORE
MEMBERS ONLY
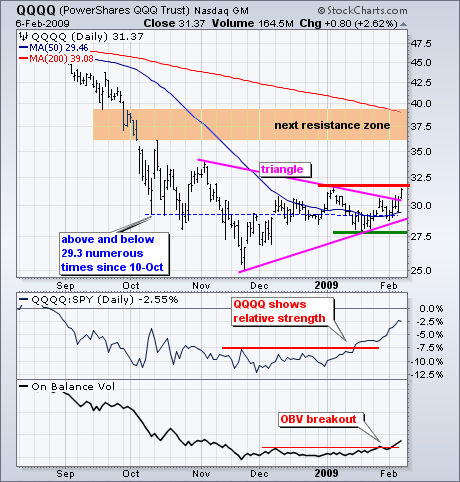
OBV AND RELATIVE STRENGTH DRIVE QQQQ

by Arthur Hill,
Chief Technical Strategist, TrendInvestorPro.com
The Nasdaq 100 ETF (QQQQ) is breaking out of its trading range. The chart below shows QQQQ stuck in a trading since 10-Oct. Focusing on the blue dotted line marking the mid October lows, we can see that QQQQ traded above and below this line numerous times the last...
READ MORE
MEMBERS ONLY
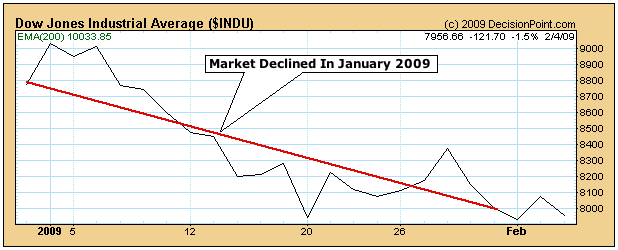
JANUARY FORECASTS A DOWN YEAR

by Carl Swenlin,
President and Founder, DecisionPoint.com
Research published by Yale Hirsch in the "Trader's Almanac" shows that market performance during the month of January often predicts market performance for the entire year. The January "barometer" has been particularly prescient in odd years (the first year of a new Congress), with...
READ MORE
MEMBERS ONLY
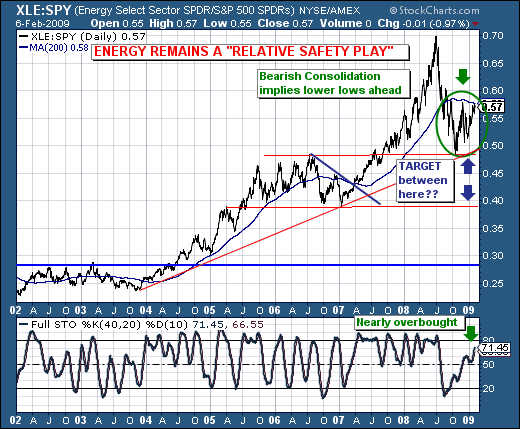
FOCUSING ON THE ENERGY SECTOR

by Richard Rhodes,
Founder and President, Rhodes Capital Management and Rhodes Trading Group
Our focus today is upon the Energy Sector (XLE) and its relative valuation to the S&P 500 Spyders (SPY). Given the current bear market, we've found recently that market participants are once again willing
to return aggressively to what they know worked rather well in the...
READ MORE
MEMBERS ONLY
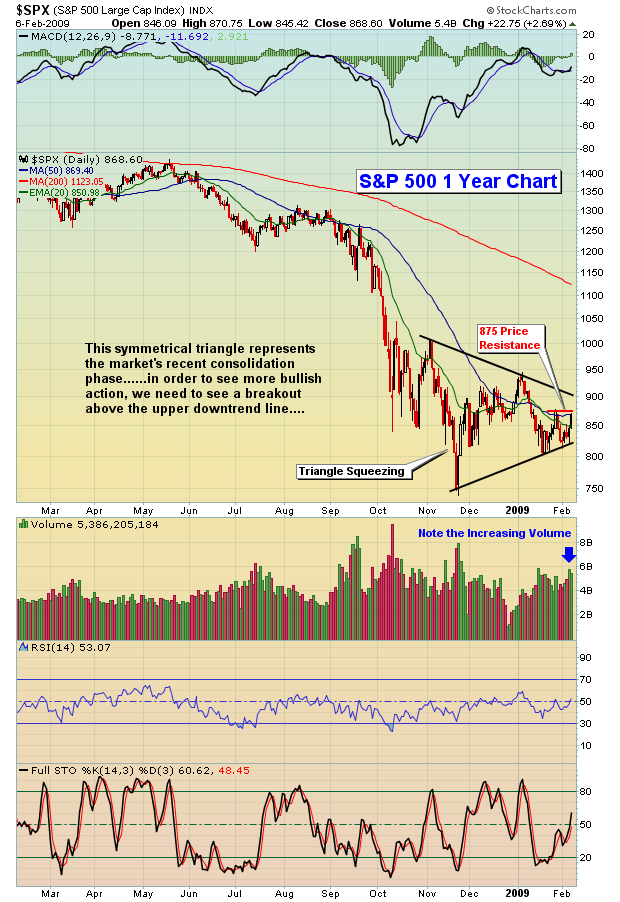
BERMUDA TRIANGLE - WALL STREET STYLE

by Tom Bowley,
Chief Market Strategist, EarningsBeats.com
We've seen this all before. The sure-fire short setups get waxed as trendline support holds. Then the bulls grow confident as the market soars only to get turned back by trendline resistance. The cycle continues to repeat itself until we get resolution. If you time your entries...
READ MORE
MEMBERS ONLY

DROOY - Bullish CMF Signal Confirmed by Long-Term Crossover
(Click here for a live version of this chart.)
Durban Roodeport Deep (DROOY) is a major gold mining company in South Africa. Their stock jumped in late November generating a "buy" signal from the standard 20-day Chaiken Money Flow (CMF) in early December. The longer term moving...
READ MORE
MEMBERS ONLY

DAILY AND WEEKLY MACD LINES ARE HELPING TO SUPPORT STOCKS WHICH END WEEK ON A POSITIVE NOTE -- SIGNS OF BUYING IN FINANCIALS AND HOMEBUILDERS ARE ALSO AN ENCOURAGING SIGN
by John Murphy,
Chief Technical Analyst, StockCharts.com
MACD LINES SHOW SOME PROMISE ... Another reader complained this week that we failed to point out the "negative divergence" in the daily MACD lines during January prior to the latest downturn. The reason I didn't point it out was because none existed. In fact, it may...
READ MORE
MEMBERS ONLY

THREE ACTIONABLE IDEAS THAT I'VE WRITTEN ABOUT IN THE NEW YEAR INCLUDE GOLD, CORPORATE BONDS AND TIPS, AND HEALTHCARE STOCKS --
by John Murphy,
Chief Technical Analyst, StockCharts.com
GOLD IS RISING AGAINST ALL CURRENCIES... One of our readers complained to me this week that we haven't provided any actionable ideas since the start of the new year. How about gold? We've written a number of positive articles on that commodity over the past couple...
READ MORE
MEMBERS ONLY

Sirius XM Radio's (SIRI) Runaway Gap Up
( Click here for a live version of this chart.)
SIRI gapped up on the open and moved higher from there today on strong volume. Very nice turnaround play with resistance at 0.225. When a stock that is already in an uptrend gaps up like this, it is called a...
READ MORE
MEMBERS ONLY

STOCKS STAGE RECOVERY ON EXPANDING VOLUME -- OIL SERVICES AND SEMIS LEAD ADVANCE
by John Murphy,
Chief Technical Analyst, StockCharts.com
NASDAQ SURGES OVER 2%... Today's Market Message was written by Arthur Hill. - Editor
It was a wild day on Wall Street as stocks opened weak and then staged an impressive advance with above average volume. Chart 1 shows the Nasdaq with a long white candlestick that closed back...
READ MORE
MEMBERS ONLY

GOLD SURGES AND TURNS VOLATILE -- EURO REMAINS WEAK OVERALL -- TIPS AND GOLD MOVE IN TANDEM -- RISING INTEREST RATES BOOST THE DOLLAR -- STRONG DOLLAR KEEPS OIL IN CHECK - INTERMARKET PICTURE SINCE MID DECEMBER
by John Murphy,
Chief Technical Analyst, StockCharts.com
GOLD AND THE EURO DIVERGE ... Today's Market Message was written by Arthur Hill. - Editor
Contrary to historical tendencies, gold and the Euro appear to be going their separate ways. There has historically been a negative correlation between the U.S. Dollar and gold. The Dollar advances as gold...
READ MORE
MEMBERS ONLY

Hitachi's (HIT) RSI Rebound
( Click here for a live version of this chart.)
Hitachi's RSI indicator moved back above 30 today after sinking down around 20 two days ago. This big jump indicates that an important rebound is underway and has a good chance of continuing at least until the RSI crosses...
READ MORE
MEMBERS ONLY

SPY CONTINUES THE BIG STALL -- QQQQ SHOWS RELATIVE STRENGTH -- SEMIS LEAD THE TECH SECTOR HIGHER -- TXN SURGES ON GOOD VOLUME -- INTEL SURGES ON LACKLUSTER VOLUME -- DOW TRANSPORTS LAG -- DOW UTILITIES LEAD
by John Murphy,
Chief Technical Analyst, StockCharts.com
SPY REMAINS RANGE BOUND... Today's Market Message was written by Arthur Hill. - Editor
Indecision continues to grip the stock market as the S&P 500 ETF (SPY) trades within a tightening range. Chart 1 shows SPY trading on either side of 85 since 10-Oct (blue dotted...
READ MORE
MEMBERS ONLY

NetFlix (NFLX) has a Powerful MA Crossover
The 50-day Simple Moving Average for NetFlix moved above the 200-day Simple Moving Average today in a very convincing manner confirming the stock's gains over the past couple of days. No other heavily traded Nasdaq stock has a similarly bullish signal right now....
READ MORE
MEMBERS ONLY

A NUMBER OF HEALTHCARE STOCKS CONTINUE TO TRADE ABOVE THEIR 200-DAY AVERAGES -- NEW ADDITIONS INCLUDE ABBOTT LABS, GILEAD AND MEDCO HEALTH SOLUTIONS
by John Murphy,
Chief Technical Analyst, StockCharts.com
HEALTHCARE GIVES MARKET A BOOST ... On January 27, I wrote about upside leadership coming from healthcare stocks, and suggested that more of that could provide some support for the rest of the market. That's certainly the case today. Better than expected earnings from Merck and Schering Plough are...
READ MORE
MEMBERS ONLY

Quadruple Bottom P&F Breakdown for Target (TGT)
( Click here to see a live version of this chart.)
Target Corp's Point and Figure chart broke below the bottom of the Quadruple Bottom Pattern that it had put in over the past 5 weeks. See the 4 "O's" in the boxes at 32?...
READ MORE
MEMBERS ONLY

STOCKS HAVE WORST JANUARY IN HISTORY -- CORPORATE BONDS GAIN GROUND AS TREASURIES DROP -- GOLD CONTINUES TO SHINE
by John Murphy,
Chief Technical Analyst, StockCharts.com
GOING FOR THE GOLD ... With stocks falling again this week, and Treasury bond prices tumbling, investors turned to gold as a safe haven. Chart 1 shows bullion closing jumping $22 on Friday to end at $928 which puts it right up against its October intra-day peak at $936. On...
READ MORE
MEMBERS ONLY

Dark Cloud Cover for ODFL
( Click here to see a live version of this chart.)
The Dark Cloud Cover candlestick pattern occurs when a stock that is in an uptrend has a tall hollow candle that is followed by a tall filled candle that extends below the mid-point of the first candle.
A Dark...
READ MORE
MEMBERS ONLY

Nasdaq Bullish Percent Index will Signal the Return of the Bulls
(Click on the chart for a live version)
The Nasdaq Bullish Percent Index represents the percentage of Nasdaq stocks that have Bullish signals on their P&F charts. Typically, readings oscillate around 50. Readings above 60 are rare and indicate a strong rally is underway. Readings below 20 are...
READ MORE
MEMBERS ONLY

LACKLUSTER VOLUME -- NASDAQ AND NY COMPOSITE BREAK FLAG RESISTANCE -- FED STATEMENT WEIGHS ON BONDS -- DOLLAR FIRMS AS RATES RISE -- GOLD RISES ALONG WITH THE DOLLAR
by John Murphy,
Chief Technical Analyst, StockCharts.com
VOLUME FAILS TO INSPIRE... Today's Market Message was written by Arthur Hill. - Editor
Despite a big advance on Wednesday, Nasdaq and NYSE volume levels were uninspiring. Chart 1 shows the Nasdaq surging 3.55% with average volume. Chart 2 shows the NY Composite surging 3.5% with above...
READ MORE
MEMBERS ONLY

FINANCIALS SURGE ON BAD BANK IDEA -- XLF AND RKH GAP HIGHER -- CITIGROUP, BANK OF AMERICA AND WELLS SURGE - BROKERS OUTPERFORMING BANKS - POINT & FIGURE SETTINGS -- TARGETS AND REVERSAL MARKERS FOR SPX AND NDX
by John Murphy,
Chief Technical Analyst, StockCharts.com
FINANCIALS LEAD BROAD MARKET ADVANCE... Today's Market Message was written by Arthur Hill. - Editor
In early trading on Wednesday, financial stocks led the market higher as investors embraced the "bad bank" idea. Bloomberg reported that President Obama was nearing a deal to create a bad bank...
READ MORE
MEMBERS ONLY

GOLD STILL HAS MORE RESISTANCE BARRIERS TO OVERCOME -- WHY GOLD CAN BE A DEFLATION HEDGE -- GOLD STRENGTH HINTS AT DOLLAR WEAKNESS
by John Murphy,
Chief Technical Analyst, StockCharts.com
GOLD STILL HAS MORE BARRIERS TO OVERCOME... I've gotten a lot of questions about the recent upturn in gold. I'll try to answer some of them here. I wrote on Friday that gold had "broken out" to a three-month high and had exceeded...
READ MORE
MEMBERS ONLY

HEALTHCARE IS TOP DEFENSIVE SECTOR -- LEADERS INCLUDE BRISTOL MYERS SQUIBB, SCHERING PLOUGH, UNITEDHEALTH, AND MYLAN LABS -- MCKESSON AND ST JUDE MEDICAL GAP HIGHER -- HEALTHCARE SPDR NEARS TEST OF JANUARY HIGH
by John Murphy,
Chief Technical Analyst, StockCharts.com
HEATLHCARE RS LINE HITS NEW HIGH ... Over the last year, the three top performing market sectors have been consumer staples, healthcare, and utilities (in that order). Although all three have lost money, they've lost a lost less than the market as a whole. That's perfectly normal...
READ MORE
MEMBERS ONLY

GOING FOR THE GOLD -- BULLION BREAKS OUT -- BARRICK AND NEWMONT EXCEED 200-DAY AVERAGES -- TIPS GAIN GROUND ON TREASURY BONDS -- MCCELLAN OSCILLATOR TURNS NEGATIVE
by John Murphy,
Chief Technical Analyst, StockCharts.com
GOLD HITS THREE MONTH HIGH ... The gold market is starting to attract a lot of attention and money. Chart 1 shows the streetTracks Gold Trust ETF (GLD) jumping $36 dollars today. In so doing, it has decisively cleared the falling resistance drawn over the July/October highs. And it did...
READ MORE
