MEMBERS ONLY

VOLATILITY REIGNS SUPREME -- DOW BATTLES SUPPORT AT 8000 -- USING STOCHRSI TO IDENTIFY THE SWINGS -- AN INVERSE HEAD-AND-SHOULDERS FOR DIA? -- BONDS FALL SHARPY

by John Murphy,
Chief Technical Analyst, StockCharts.com
DOW CONTINUES ITS SWINGING WAYS... Today's Market Message was written by Arthur Hill. - Editor
Chart 1 shows the Dow Industrials since early October. Despite a number of big swings the last few months, the average is currently trading near the October lows. Essentially, the Dow has gone nowhere...
READ MORE
MEMBERS ONLY

DOWNSIDE BREADTH STRONGER THAN UPSIDE BREADTH -- NEW 52-WEEK LOWS STILL OUTPACING NEW 52-WEEK HIGHS -- VOLUME LEVELS REMAIN UNINSPIRING
by John Murphy,
Chief Technical Analyst, StockCharts.com
BREADTH LAGS ON BOUNCE ... Today's Market Message was written by Arthur Hill. - Editor
The stock market surged on Wednesday, but a look under the hood shows lagging breadth and uninspiring volume. Before getting into the analysis, let's review some key breadth indicators. Charts 1 and 2...
READ MORE
MEMBERS ONLY

SPY AND QQQQ FORM HARAMI PATTERNS -- FINANCIALS LEAD RECOVERY BOUNCE -- SURGING OIL BOOSTS XLE AND OIH -- MARKET CARPET SEES RED IN 2009 -- CONSUMER STAPLES SECTOR SHOWS RELATIVE STRENGTH
by John Murphy,
Chief Technical Analyst, StockCharts.com
SPY AND QQQQ FORM INSIDE DAYS ... Today's Market Message was written by Arthur Hill. - Editor
After a long black candlestick and sharp decline on Tuesday, the S&P 500 ETF (SPY) and Nasdaq 100 ETF (QQQQ) formed inside days on Wednesday. Taken together, the candlesticks of the...
READ MORE
MEMBERS ONLY

STOCKS SUFFER WORST INAUGURATION DAY DROP IN HISTORY -- A RETEST OF NOVEMBER LOWS APPEARS LIKELY
by John Murphy,
Chief Technical Analyst, StockCharts.com
NYSE INDEX LOSES 6% ON RISING VOLUME... According to Bloomberg, today's stock drop was the biggest loss in inauguration day history. Chart 1 shows the NYSE Composite Index losing 6% and ending at the lowest close since early December (as did all of the other major stock indexes)...
READ MORE
MEMBERS ONLY

PLUNGE IN BANK SHARES PULLS REST OF THE MARKET LOWER -- TODAY'S ONLY WINNERS ARE THE DOLLAR, YEN, AND GOLD -- A RISING VIX IS SOMETHING ELSE FOR STOCKS TO WORRY ABOUT
by John Murphy,
Chief Technical Analyst, StockCharts.com
BANKS PLUNGE TO NEW LOWS... The plunge in European bank shares on Monday spilled over to U.S. trading today. Chart 1 shows the PHLX Bank Index falling near 15% to a new low. Financials and consumer discretionary are among the day's biggest losers. Other big losers include...
READ MORE
MEMBERS ONLY

EUROPEAN MARKETS FALL ON MONDAY ALONG WITH US STOCK FUTURES -- INTERMARKET RELATIONSHIPS STILL PAINT A NEGATIVE PICTURE FOR STOCKS AND COMMODITIES AS A RISING DOLLAR HURTS BOTH -- CORPORATE BONDS PLAY CATCH-UP
by John Murphy,
Chief Technical Analyst, StockCharts.com
EUROPEAN MARKETS FALL ... Although U.S. markets are closed for the Martin Luther King holiday, foreign markets are open. And, unfortunately, most of them are dropping. That includes Brazil, Canada, and Europe. Stocks fell in all 18 western European markets. A catalyst for European weakness was a 67% plunge in...
READ MORE
MEMBERS ONLY
TECHNICAL ANALYSIS 101 - PART 1
This is the first part of a series of articles about Technical Analysis from a new course we're developing. If you are new to charting, these articles will give you the "big picture" behind the charts on our site. if you are an "old hand&...
READ MORE
MEMBERS ONLY
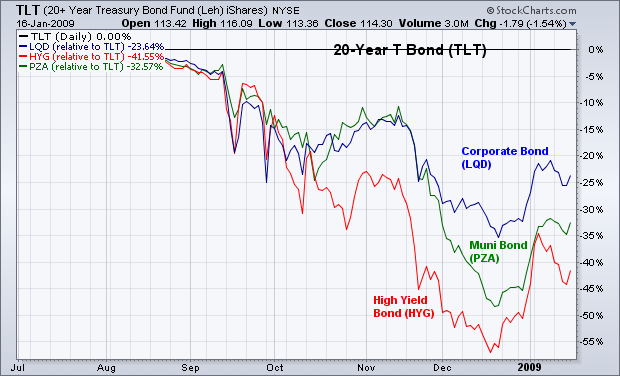
OTHER BOND CATEGORIES ARE BOUNCING
I recently wrote about how investment grade corporate bonds were starting to gain some ground on Treasury bonds. Today, I'm adding two other bond categories to that list. The flat line in Chart 1 is the 20+Year Treasury Bond iShares (TLT) which has been the strongest part...
READ MORE
MEMBERS ONLY
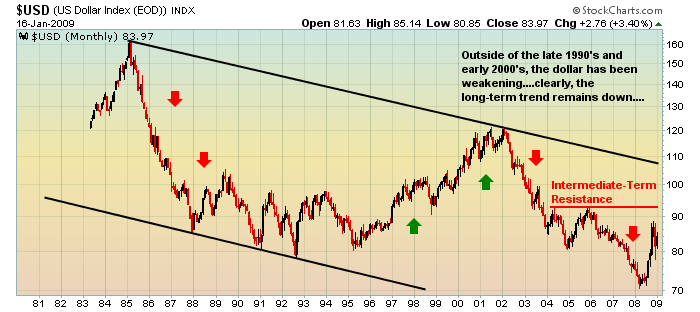
IS THE DOLLAR TOPPING?
An interesting result of the government bailout of the financials and automakers, along with the huge economic stimulus package will be the long-term impact on the U.S. dollar. Can the dollar maintain its relative value as interest rates fall and deficits mount? Let's take a look...
READ MORE
MEMBERS ONLY
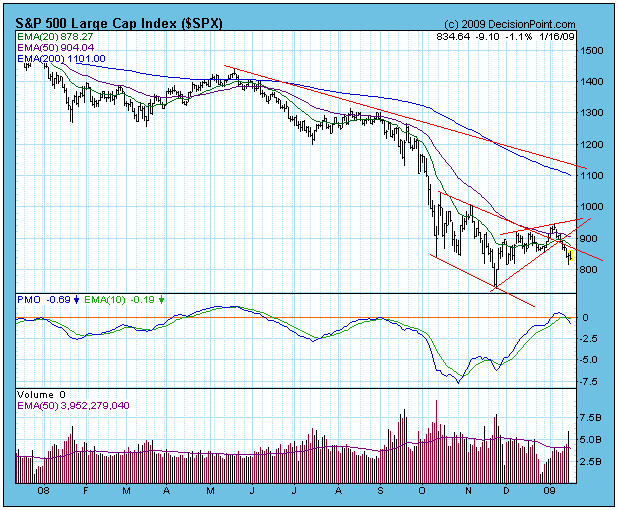
RALLY FAILURE
In my January 2 article I pointed out that the stock market was overbought by bear market standards, but that the rally had plenty of internal room for prices to expand upward if bullish forces were to persist. There was a brief rally and a small breakout, but then the...
READ MORE
MEMBERS ONLY
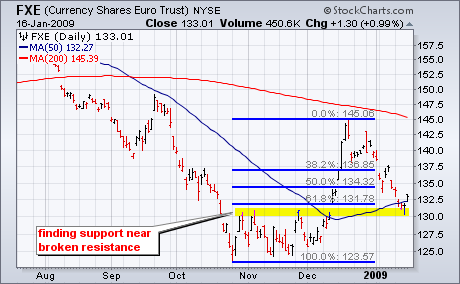
EURO FINDS SUPPORT AS DOLLAR HITS RESISTANCE
With a bounce on Friday, the Euro Trust ETF (FXE) found support from a confluence of indicators and chart features. First, broken resistance turns into support in 130-132 area. Second, there is support in this area from the 50-day moving average. Third, the decline over the last few...
READ MORE
MEMBERS ONLY

BEWARE OF SHORT-TERM WHIPSAWS -- USE LONG-TERM CHARTS TO FILTER DAILY SIGNALS -- MORE BOND ETFS ARE BOUNCING
by John Murphy,
Chief Technical Analyst, StockCharts.com
OTHER BOND CATEGORIES ARE BOUNCING... I recently wrote about how investment grade corporate bonds were starting to gain some ground on Treasury bonds. Today, I'm adding two other bond categories to that list. The flat line in Chart 1 is the 20+Year Treasury Bond iShares (TLT) which...
READ MORE
MEMBERS ONLY

TECHS LEAD REBOUND -- QQQQ BATTLES SUPPORT - A FEEBLE RETRACEMENT RALLY -- LONG-TERM SUPPORT FOR SPY -- EURO HITS SUPPORT AS DOLLAR HITS RESISTANCE
by John Murphy,
Chief Technical Analyst, StockCharts.com
TECHS LEAD MARKET REBOUND ... Today's Market Message was written by Arthur Hill. - Editor
After plunging the first two hours of trading, the Nasdaq 100 ETF (QQQQ) firmed and then surged higher in the afternoon. Chart 1 shows QQQQ swing over 4% from low to high during the day....
READ MORE
MEMBERS ONLY

DIA AND SPY BREAK SUPPORT -- DECLINE IN RETAIL SALES HITS RETAIL ETFS -- FINANCIALS STILL LEADING LOWER -- SECTOR LAGGARDS IN JANUARY - DOW THEORY WITH A TWIST -- ENERGY IS BIGGER THAN FINANCE
by John Murphy,
Chief Technical Analyst, StockCharts.com
DIA AND SPY BREAK SUPPORT... Today's Market Message was written by Arthur Hill. - Editor
A broad decline in stocks pushed the Dow Industrials ETF (DIA) and the S&P 500 ETF (SPY) below their late-December lows. All sectors were down with financials and energy leading the...
READ MORE
MEMBERS ONLY

THE DOLLAR AND YEN CONTINUE TO GAIN GROUND WHICH IS KEEPING GLOBAL STOCKS AND COMMODITIES UNDER PRESSURE -- THE RISING YEN, HOWEVER, DOESN'T HELP JAPANESE STOCKS
by John Murphy,
Chief Technical Analyst, StockCharts.com
FLIGHT TO DOLLAR AND YEN ... I wrote yesterday that this week's rebound in the US Dollar Index and the Japanese Yen were negative signs for commodities and stocks. Charts 1 and 2 show the Dollar and the yen rising again today. The rising dollar is keeping downward pressure...
READ MORE
MEMBERS ONLY

CURRENCY TRENDS SHOW THAT MARKETS ARE STILL RISK AVERSE -- A BOUNCING DOLLAR HURTS COMMODITIES AND A RISING YEN IS BAD FOR STOCKS
by John Murphy,
Chief Technical Analyst, StockCharts.com
RISING DOLLAR PRESSURES GOLD AND STOCKS... Last Friday, I wrote about how a rising dollar was putting downward pressure on most commodity markets and gold in particular. I showed gold backing off from its 200-day moving average while the US Dollar Index was bouncing off its 200-day line....
READ MORE
MEMBERS ONLY

INVESTMENT GRADE CORPORATE BONDS ARE GAINING SOME GROUND ON TREASURIES -- BOUNCING DOLLAR KEEPS GOLD IN CHECK -- THE VIX HAS REACHED A POTENTIAL SUPPORT LEVEL WHICH MAY REMOVE BULLISH PROP FROM STOCKS -- MARKET FAILS FIRST WEEK OF JANUARY TEST
by John Murphy,
Chief Technical Analyst, StockCharts.com
CORPORATE BONDS ARE STARTING TO RECOVER... During the second half of 2008, Treasury Bonds were the top performing fixed income group as investors fled to safety. Other bond categories actually lost ground including corporate bonds. There are signs that some bond money is starting to flow into that other bond...
READ MORE
MEMBERS ONLY

SMALL-CAPS AND TECHS REBOUND -- WARNING HITS WAL-MART -- RETAIL HOLDRS FAIL AT RESISTANCE -- WAL-MART WEIGHS ON CONSUMER STAPLES SPDR -- POCKETS OF STRENGTH AMONG RETAILERS - BONDS FIRM AHEAD OF EMPLOYMENT REPORT
by John Murphy,
Chief Technical Analyst, StockCharts.com
STOCKS FIRM AFTER WEAK OPEN... Today's Market Message was written by Arthur Hill. - Editor
The Wal-Mart warning reverberated throughout the stock market as the major indices opened lower on Thursday. Despite this lower open, trading quickly turned mixed and most of the major-index ETFs ended with...
READ MORE
MEMBERS ONLY

QQQQ GAPS DOWN AND STAYS DOWN -- SPY FORMS RISING WEDGE PATTERN -- FINANCIALS LAG BROADER MARKET -- JP MORGAN BREAKS TRIANGLE SUPPORT -- WELL FARGO LEADS LOWER -- GOLD FALLS DESPITE WEAK DOLLAR -- OIL PLUNGES
by John Murphy,
Chief Technical Analyst, StockCharts.com
QQQQ GAPS DOWN ... Today's Market Message was written by Arthur Hill. - Editor
Led by weakness in the technology sector, the Nasdaq 100 ETF (QQQQ) gapped down and stayed down on Wednesday. Chart 1 shows daily candlesticks over the last four months. QQQQ has been working its way higher...
READ MORE
MEMBERS ONLY

MCCLELLAN INDICATORS SHOW IMPROVEMENT IN MARKET BREADTH -- AIRLINES CONTINUE TO SHOW MARKET LEADERSHIP -- AIRLINE LEADERS ARE JETBLUE AND CONTINENTAL -- BOUNCE IN T-BILL AND T-BOND RATES SHOWS A BIT MORE CONFIDENCE
by John Murphy,
Chief Technical Analyst, StockCharts.com
MCCLELLAN OSCILLATOR REACHES NEW HIGH... A couple of readers have asked what the implications are for the current high reading in the McClellan Oscillator. For those not familiar with it, this breadth indicator is based on the difference between the 19-day and 39-day exponential moving averages of net...
READ MORE
MEMBERS ONLY
WHAT LIES AHEAD?
In order to gain a decent perspective as to where we might go in 2009, it's always helpful to take a look at the past to see how we got here. 2008 was a horrible year for the major stock market indices. The Dow Jones, S&P...
READ MORE
MEMBERS ONLY
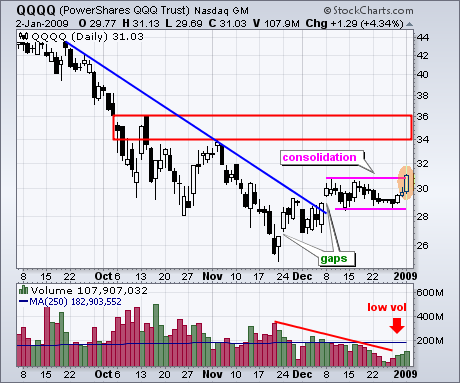
QQQQ BREAKS CONSOLIDATION RESISTANCE
QQQQ broke consolidation resistance with a big surge on the first trading day of the year. After surging in late November and early December with two gaps, QQQQ stalled for most of December with a flat trading range. The consolidation pattern looks like a flag and the upside breakout calls...
READ MORE
MEMBERS ONLY
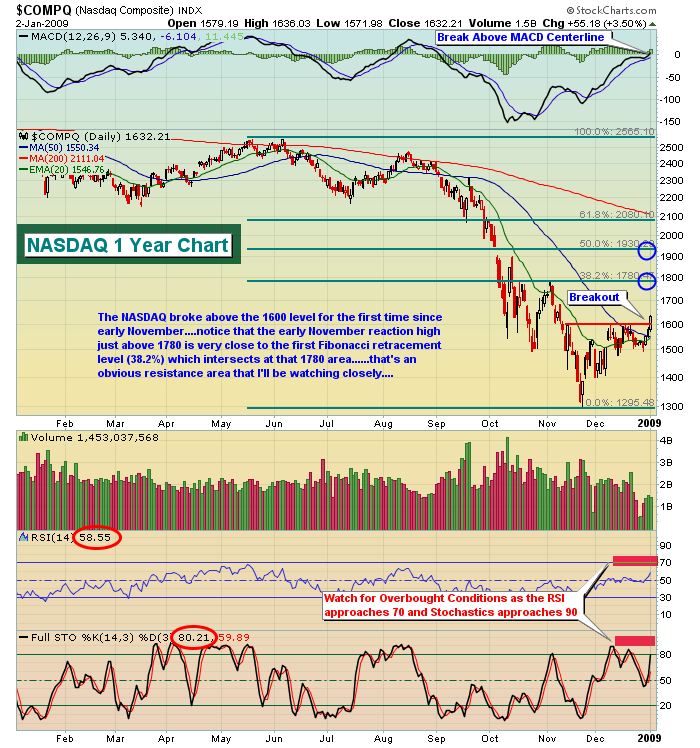
HOW OVERBOUGHT IS IT?
For the last few weeks the stock market has been drifting higher on low volume, and there is no doubt in my mind that the Fed/Treasury has been the invisible hand that has quickly moved in to squelch any selling that started. Under these conditions, I find it difficult...
READ MORE
MEMBERS ONLY
PURSUING HEDGING STRATEGIES IN 2009
As the credit crisis continues apace into 2009, we believe the time is rather "ripe" for pursuing various hedging "thematic" strategies to profit from relative valuations across the globe. Quite simply, we believe that the credit crisis will fundamentally impact various global regions in a different...
READ MORE
MEMBERS ONLY
INTERMARKET TRENDS TURN MORE POSITIVE
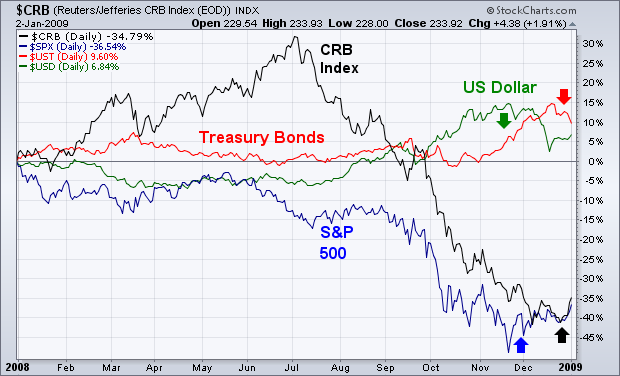
Chart 1 shows how the interaction between the four main asset classes unfolded during 2008 and how they're entering 2009. The two weakest assets were commodities and stocks. The two strongest were Treasury bonds and the dollar. During the first half of the year, commodities were the strongest...
READ MORE
MEMBERS ONLY
STYLEBUTTONS GIVE YOU MULTIPLE WAYS TO ANALYZE A STOCK INSTANTLY
Hello Fellow ChartWatchers!
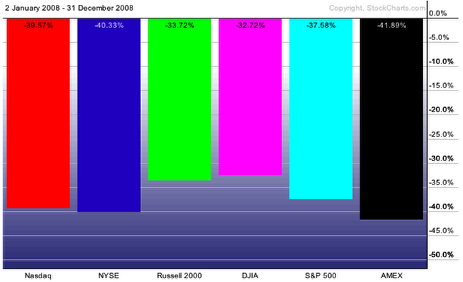
First off, Happy 2009! Let's hope this year is better than 2008 - one of the all time stinkers in terms of stock market performace. How bad was it? Here ya go:
Ugh. Well, let's not dwell on it too much. Instead I wanted...
READ MORE
MEMBERS ONLY

2009 GETS OFF TO A POSITIVE START -- STOCKS AND COMMODITIES RALLY WHILE BONDS AND THE DOLLAR PULL BACK -- CONSUMER DISCRETIONARY STOCKS DO BETTER THAN STAPLES AT YEAREND-- AS JANUARY GOES SO GOES THE YEAR
by John Murphy,
Chief Technical Analyst, StockCharts.com
INTERMARKET TRENDS TURN MORE POSITIVE ... Chart 1 shows how the interaction between the four main asset classes unfolded during 2008 and how they're entering 2009. The two weakest assets were commodities and stocks. The two strongest were Treasury bonds and the dollar. During the first half of the...
READ MORE
MEMBERS ONLY

QQQQ EXTENDS ITS POST-SURGE CONSOLIDATION -- XLF AND XLK FORM PENNANTS -- BONDS ARE THE BIG WINNERS FOR 2008 -- OIL IS THE BIG LOSER -- GOLD DIVERGES FROM OTHER COMMODITIES
by John Murphy,
Chief Technical Analyst, StockCharts.com
QQQQ REMAINS IN CONSOLIDATION MODE... Today's Market Message was written by Arthur Hill. - Editor
The Nasdaq 100 ETF (QQQQ) continues to consolidate after the late-November surge. Chart 1 shows the ETF surging above 28 in late November and then consolidating the last four weeks (December). Most of...
READ MORE
MEMBERS ONLY

CONSUMER STAPLES AND HEALTHCARE ARE DEFENSIVE MARKET LEADERS -- BIG PHARMA LEADERS ARE BMY, SGP, AND PFE -- RETAIL STOCKS ARE DOING OKAY IN SPITE OF BAD NEWS -- CONSUMER DISCRETIONARY SECTOR IS HELPING LEAD MARKET HIGHER
by John Murphy,
Chief Technical Analyst, StockCharts.com
HEALTHCARE AND STAPLES ARE DEFENSIVE LEADERS ... Arthur Hill and myself have noted several times this past year that defensive sectors like consumer staples and healthcare have been market leaders. That's normal during a bear market and recession. This time last year (December 28, 2007), I wrote a message...
READ MORE
MEMBERS ONLY

HOPES FOR SANTA CLAUS RALLY FADE -- MIDEAST VIOLENCE WEAKENS DOLLAR AND BOOSTS GOLD AND OIL -- CHEMICALS TAKE BIGGEST HIT -- 13 AND 34 DAY EMAS ARE STILL NEGATIVE -- HOURLY BARS SHOW THREE-WEEK TRADING RANGE STILL INTACT
by John Murphy,
Chief Technical Analyst, StockCharts.com
CHEMICALS FALL HARD ... Dow Chemical and Rohm and Haas fell especially hard today on news that funding for their merger was in trouble. The two chemical stocks lost -20% and -15% respectively. Chemicals as a group lost 5% and were the day's biggest losers. Charts 1 and 2...
READ MORE
MEMBERS ONLY

DEFINING THE SANTA CLAUS RALLY, THE JANUARY EFFECT, AND THE JANUARY BAROMETER -- WHY THE NEXT FEW WEEKS ARE IMPORTANT FOR THE MARKET
by John Murphy,
Chief Technical Analyst, StockCharts.com
SANTA CLAUS RALLY ... You've probably been hearing and reading a lot lately about the so-called "Santa Claus rally". The term is often used to describe any market bounce that takes place during December (which is usually one of the strongest months of the year). There...
READ MORE
MEMBERS ONLY

VOLUME LEVELS SHRINK -- NEW 52-WEEK LOWS STILL OUTPACING NEW 52-WEEK HIGHS -- ELLIOTT WAVE COUNTS FOR SPY - QQQQ STALLS AFTER SURGE -- FOUR PROMINENT TECH STOCKS -- HEALTHCARE SECTOR SHOWS LEADERSHIP
by John Murphy,
Chief Technical Analyst, StockCharts.com
VOLUME THINS AS HOLIDAY MODE HITS... Today's Market Message was written by Arthur Hill. - Editor
Volume levels on the NYSE and Nasdaq were below average on Monday and Tuesday. Low volume is typical for the period between Christmas and New Year's. In addition to these seasonal...
READ MORE
MEMBERS ONLY

MARKET ENDS THE WEEK ON A FLAT NOTE -- BOUNCE IN DOLLAR CAUSES PROFIT-TAKING IN GOLD -- ENERGY AND MATERIAL STOCKS WEAKEN AS WELL -- THE DOW AND S&P 500 CLOSE BACK BELOW 50-DAY AVERAGES
by John Murphy,
Chief Technical Analyst, StockCharts.com
DOLLAR BOUNCE CAUSES PROFIT-TAKING IN GOLD ... After falling sharply all week, the Dollar Index bounced on Friday from potential chart support near its 200-day moving average. That caused profit-taking in gold at a time when bullion was testing its own 200-day average and a resistance line...
READ MORE
MEMBERS ONLY

% NYSE STOCKS OVER 50-DAY AVERAGE IMPROVES -- VIX INDEX BREAKS LATE NOVEMBER SUPPORT WHICH IS POSITIVE FOR STOCKS -- S&P 500 APPEARS HEADED UP TO EARLY NOVEMBER PEAK AT 1000
by John Murphy,
Chief Technical Analyst, StockCharts.com
MORE STOCKS TRADE OVER 50-DAY AVERAGES... Last Friday, I showed an indicator that measures the % NYSE stocks trading over their 50-day moving average. At the time, the reading was only 30%. With most stock indexes having cleared that resistance barrier this week, the number of stocks trading over...
READ MORE
MEMBERS ONLY

BONDS SURGE AGAIN -- ANALYZING THE LONG-TERM TREND FOR SPY -- DOW THEORY STAGES -- SECONDARY MOVEMENTS -- EXPECTED RETRACEMENTS AND RESISTANCE LEVELS FOR SPY
by John Murphy,
Chief Technical Analyst, StockCharts.com
BONDS GO BALLISTIC... Today's Market Message was written by Arthur Hill. John Murphy will return tomorrow. - Editor
The surge in bonds over the last seven weeks is truly staggering. The iShares 20+ Year Bond ETF (TLT) is up some 30% from its November low. On Tuesday, the Fed...
READ MORE
MEMBERS ONLY

FED ANNOUNCES THAT IT'S READY TO START USING MORE UNCONVENTIONAL TOOLS TO STABILIZE THE ECONOMY -- PURCHASE OF BONDS IS ONE POSSIBILITY -- HOMEBUILDERS HAVE A STRONG DAY ON PROSPECTS FOR LOWER MORTAGE RATES -- MARKET INDEXES CLEAR 50-DAY LINES
by John Murphy,
Chief Technical Analyst, StockCharts.com
FOCUS SHIFTS AWAY FROM SHORT-TERM RATES... The Fed cut its short-term Fed funds rate to "a target range" between zero and .25 today. More importantly, it announced that it was ready to take more aggressive steps to do whatever is required to get the economy moving...
READ MORE
MEMBERS ONLY

IN A DEFLATIONARY SCENARIO, TREASURY BOND PRICES RISE WHILE STOCKS AND COMMODITIES FALL -- FALLING RATES DON'T HELP MUCH IN THAT ENVIRONMENT -- INCREASE IN MONEY SUPPLY WEAKENS DOLLAR WHICH MAY BOOST GOLD
by John Murphy,
Chief Technical Analyst, StockCharts.com
BONDS AND STOCKS DECOUPLE ... With fears of deflation growing, I thought it a good time to review some of my previous writing on that subject and to explain what happens in a deflationary environment. Most traditional intermarket relationships remain the same, but some don't. My 1991 book entitled...
READ MORE
MEMBERS ONLY
MARKET RALLIES TO FIND RESISTANCE
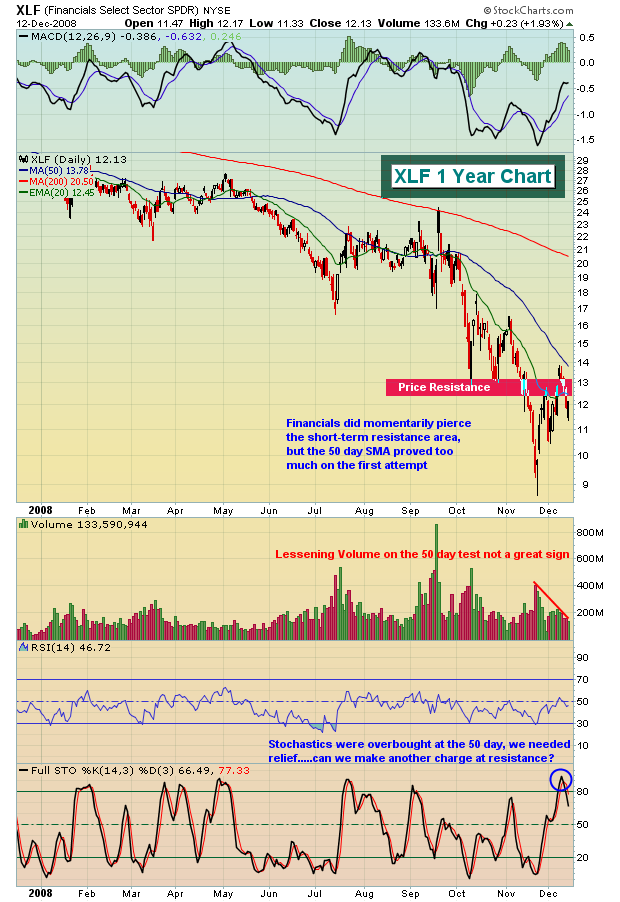
I knew eventually we'd get a rally with legs. The recent long-term positive divergences across our major indices suggested a 50 day SMA test was on the horizon and that's exactly what we saw this past week. Key indices hit resistance and, not surprisingly, backed...
READ MORE
MEMBERS ONLY
GOLD BENEFITS FROM WEAK DOLLAR
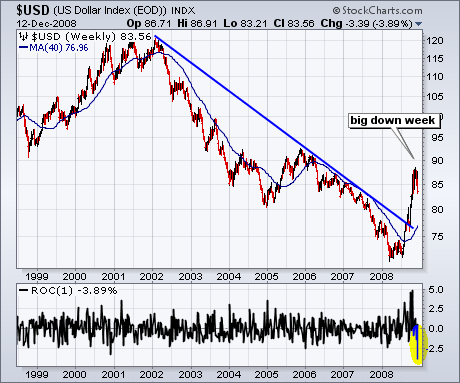
After surging from the low 70s to the upper 80s, the U.S. Dollar Index ($USD) experienced its sharpest decline in years. In fact, this week's decline was the sharpest in over 10 years. The bottom indicator window shows the 1-week Rate-of-Change dipping to -3....
READ MORE
MEMBERS ONLY
TIME RUNNING OUT ON RALLY
Last week we looked at a descending wedge pattern on the S&P 500 chart that could have sparked a rally had it resolved to the upside. Prices actually did break upward, but volume was poor, and the up move stalled immediately. Now there is an ascending wedge pattern...
READ MORE
