MEMBERS ONLY

RETAILERS OVERSOLD -- MARKET REMAINS NERVOUS -- DIA HITS RESISTANCE - FINANCIALS LEAD LOWER -- SHORT-TERM RATES FALL -- DOLLAR INDEX BACKS OFF OVERBOUGHT LEVELS

by John Murphy,
Chief Technical Analyst, StockCharts.com
RETAILERS FEELING THE PINCH... Today's Market Message was written by Arthur Hill. John Murphy will return tomorrow. - Editor
As expected the Fed cut the federal funds rate by 0.5% and this key rate now stands at 1%. In its policy statement, the Fed noted a decline in...
READ MORE
MEMBERS ONLY

BOUNCE IN FOREIGN MARKETS GIVES US STOCKS A BOOST -- OVERSOLD CONDITION AND DROP IN VOLATILITY ALSO SUGGEST THE LIKELY START OF A BEAR MARKET BOUNCE
by John Murphy,
Chief Technical Analyst, StockCharts.com
OVERSOLD FOREIGN MARKETS BOUNCE ... Over the past week, the U.S. market has held relatively firm while foreign shares have mostly fallen to new lows. Today's rebound in foreign shares is finally giving a boost to stocks in the U.S. Charts 1 and 2 show the EAFE...
READ MORE
MEMBERS ONLY

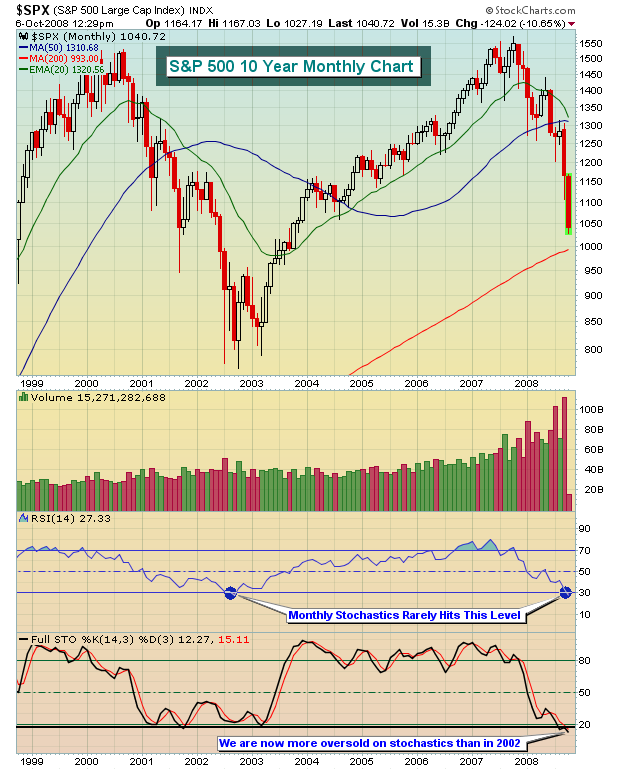
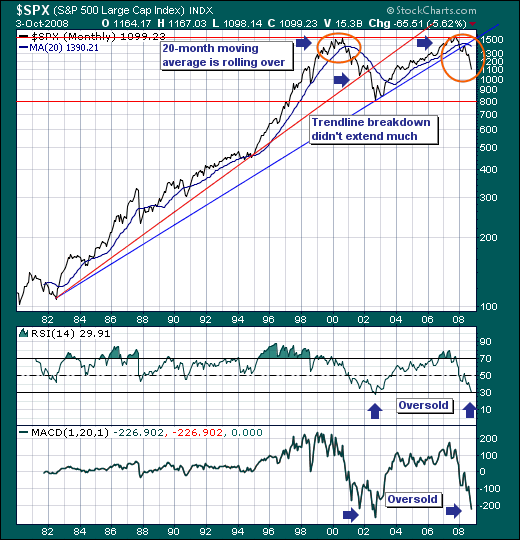
S&P 500 NEARS TEST OF 2002-2003 LOW WHICH WOULD BE DROP OF 50% -- WHY THE CURRENT MARKET TRIANGLE CARRIES GOOD AND BAD NEWS
by John Murphy,
Chief Technical Analyst, StockCharts.com
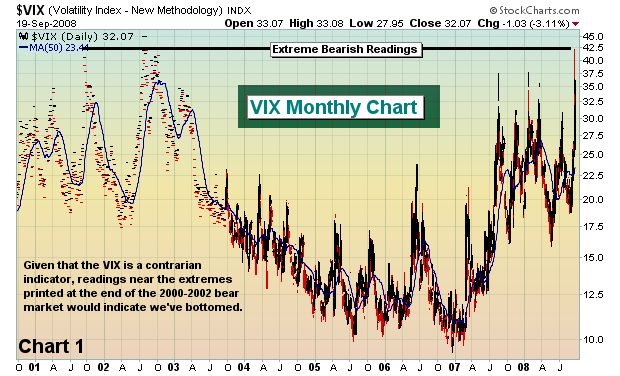
50% DROP WOULD MATCH 2000-2002 LOSS ... The monthly bars in Chart 1 put the last eight years of market action in good perspective. And the chart is pretty orderly. From its 2000 peak to its late 2002 bottom, the S&P 500 lost 50% of its value. From...
READ MORE
MEMBERS ONLY

THE FED MAY NEED TO EMPLOY SOME CHARTISTS -- WARNING SIGNS OF HOUSING PROBLEMS WERE CLEARLY VISIBLE ON CHARTS -- WHY A RISING YEN HAS BEEN BAD FOR GLOBAL STOCKS
by John Murphy,
Chief Technical Analyst, StockCharts.com
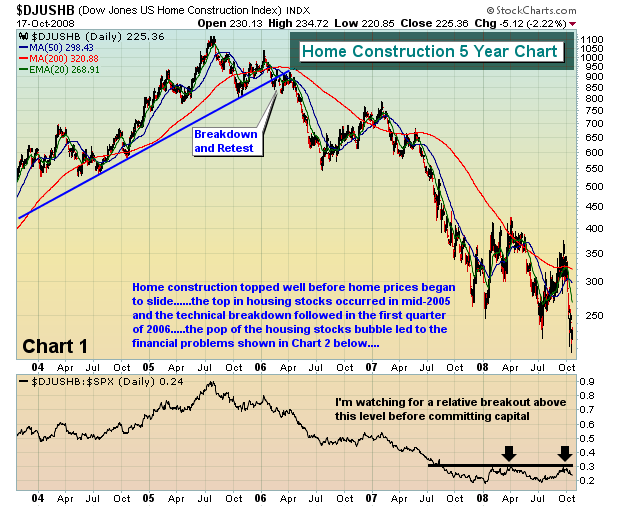
AN ARMY OF PHDS DIDN'T SEE ANY PROBLEMS ... It was quite interesting listening to Mr Greenspan explain to Congress that the army of PHDs employed by the Fed (which he claimed were the best in the world) didn't see any problems brewing in the housing market....
READ MORE
MEMBERS ONLY

STOCKS HIT WITH BROAD DECLINE -- LACK OF FOLLOW THROUGH STYMIES THE BULLS -- BEARISH MOMENTUM FOR DIA AND QQQQ -- PERFCHARTS FAVOR DEFENSIVE SECTORS -- EURO REACTS TO POTENTIAL RATE CUTS -- GOLD FOLLOWS EURO
by John Murphy,
Chief Technical Analyst, StockCharts.com
BROAD SELLING HITS WALL STREET... Today's Market Message was written by Arthur Hill. John Murphy will return tomorrow. - Editor
Stocks were hammered on Wednesday with across the board selling pressure. All nine sectors were down sharply on the day. All 30 Dow components were down and breadth was...
READ MORE
MEMBERS ONLY

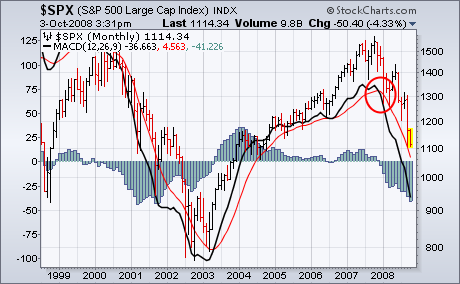
MAJOR AVERAGES APPEAR TO BE FORMING SHORT-TERM TRIANGLES -- THAT REDUCES THE ODDS THAT A LOW HAS BEEN SEEN AND SUGGESTS ONE MORE MOVE INTO NEW LOWS MAY BE NEEDED
by John Murphy,
Chief Technical Analyst, StockCharts.com
CONVERGING TRENDLINES ... One of our readers pointed out that the short-term pattern of the last eight trading days has a triangular look. A "triangle" is a trading pattern that is characterized by two converging trendlines. I've applied them to hourly bars in the following charts....
READ MORE
MEMBERS ONLY

HIGH-YIELDING FOREIGN CURRENCIES CONTINUE TO TUMBLE -- THE RISING DOLLAR KEEPS COMMODITIES UNDER PRESSURE -- ALUMINUM AND COPPER SUFFER FROM GLOBAL WEAKNESS -- DOLLAR AND YEN ARE ONLY TWO RISING CURRENCES
by John Murphy,
Chief Technical Analyst, StockCharts.com
FOREIGN WEAKNESS HURTS CURRENCIES ... The Fed started lowering interest rates more than a year ago to stem the financial crisis in the U.S. Foreign central banks didn't follow along, while some even raised rates. With foreign economies weakening along with the US, the belief is that foreign...
READ MORE
MEMBERS ONLY

RISE IN 3-MONTH T-BILL RATE AND DROP IN LIBOR SUGGEST CREDIT FREEZE IS THAWING -- THAT INCREASES THE ODDS FOR A STOCK MARKET BOUNCE
by John Murphy,
Chief Technical Analyst, StockCharts.com
T-BILLS SHOW MORE CONFIDENCE ... One of the side-effects of the market meltdown since early September has been the sharp drop in the 3-month T-bill rate. Chart 1 shows the 3-month rate falling to zero over the last month as scared investors flocked to the safety...
READ MORE
MEMBERS ONLY
IS THIS THE BUFFETT-BOTTOM?
Warren Buffett said he was buying stocks this past week. Should you? Well, it depends. If you buy stocks on a regular basis as part of a disciplined strategy - say in your 401(k) plan - then keep buying. The idea of buying stocks over the long haul is not only...
READ MORE
MEMBERS ONLY
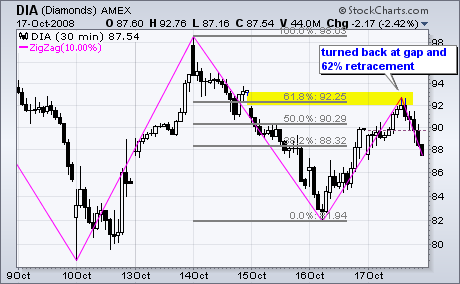
DIA RETURNS TO THE GAP
In a volatile week with huge swings, the Dow Industrials ETF (DIA) returned to Wednesday's gap with another 10% move. The magenta lines on the 30-minute chart show the zigzag indicator, which measures movements that are 10% or more. As you can see, there was an advance...
READ MORE
MEMBERS ONLY
VERY OVERSOLD MARKET
To say that the market is very oversold is not exactly breaking news because it has been oversold for at least a few weeks; however, the oversold condition has been steadily getting worse over that time, and we have perhaps reached the limit of how oversold the indicators will get...
READ MORE
MEMBERS ONLY
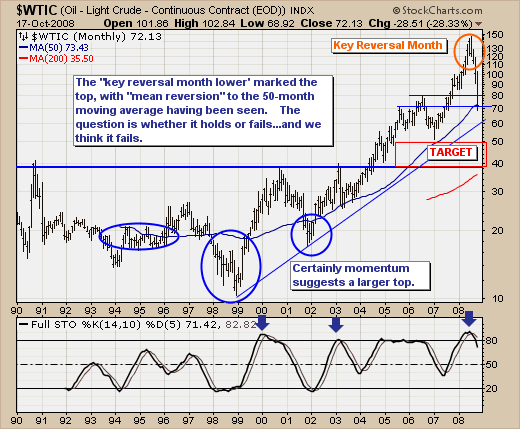
"JUMP OFF POINT" FOR CRUDE OIL?
Quite simply, the trend is sharply lower. The massive de-leveraging taking place in the capital markets has not spared crude oil at all; however, this shouldn't be a surprise given the "bell ringing" at the top was none other than a "key reversal month&...
READ MORE
MEMBERS ONLY
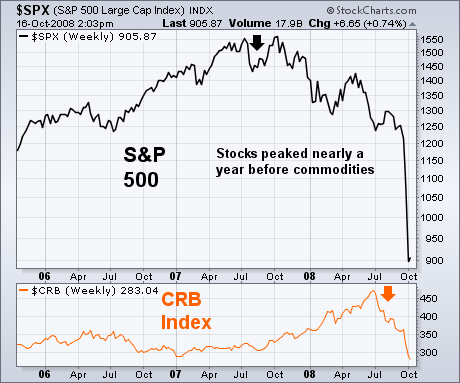
COMMODITES ARE LAST ASSET TO PEAK
A number of readers have asked if I thought the U.S. was in a recession or heading into one. Others have asked if I thought this recession would be worse than most. Although I'm not an economist, it is possible to make some judgements about the direction...
READ MORE
MEMBERS ONLY
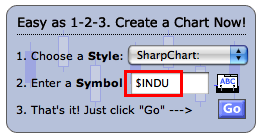
DISPLAYING MORE THAN ONE STOCK ON A CHART
Hello Fellow ChartWatchers,
Recently we've gotten several questions about how someone can display more than one stock on a single chart. I thought I'd take time this week to go over the steps you can take to do that with our SharpCharts Workbench. Let's...
READ MORE
MEMBERS ONLY

FALLING COMMODITIES ARE SIGN OF RECESSION -- SO ARE FALLING MATERIAL AND ENERGY STOCKS -- IT'S IMPORTANT THAT MARKET STAY ABOVE 2002 LOW -- WATCHING BANDS FOR OVERHEAD RESISTANCE
by John Murphy,
Chief Technical Analyst, StockCharts.com
COMMODITES ARE LAST ASSET TO PEAK... A number of readers have asked if I thought the U.S. was in a recession or heading into one. Others have asked if I thought this recession would be worse than most. Although I'm not an economist, it is possible to...
READ MORE
MEMBERS ONLY

ECONOMIC REPORTS CLOBBER STOCKS -- SPY FILLS MONDAY'S GAP -- DOW REMAINS OVERSOLD -- RETAILERS TAKE A DIVE -- OIL HITS NEW LOW -- U.S. DOLLAR INDEX GAINS
by John Murphy,
Chief Technical Analyst, StockCharts.com
STOCKS HIT WITH TRIPLE WHAMMY ... Today's Market Message was written by Arthur Hill. John Murphy will return tomorrow. - Editor
Bailout hopes gave way to economic realities as stocks were broadsided with selling pressure on Wednesday. First, the Commerce Department reported a sharp decline (1.2%) in September retail...
READ MORE
MEMBERS ONLY

MASSIVE GLOBAL SUPPORT FOR BANKS PRODUCES STRONG STOCK RALLY -- TODAY'S GAINS REPRESENT THE BEST DAY SINCE THE CRISIS STARTED
by John Murphy,
Chief Technical Analyst, StockCharts.com
GLOBAL STOCKS SCORE BIG GAINS ... A huge international rescue plan for banks has finally ingited a strong global stock rally. European gains average 10%. The same is true in Hong Kong. The U.S. market is just following along. This is clearly the best market day since the crisis started...
READ MORE
MEMBERS ONLY

ORIGINAL VOLATILITY INDEX HASN'T REACH 1987 PEAK -- DOLLAR IS RISING BECAUSE FOREIGN CURRENCIES ARE FALLING -- SCARED MONEY FAVORS BILLS OVER BONDS -- GOLD SELLS OFF ON HEAVY VOLUME -- OIL HITS 12-MONTH LOW
by John Murphy,
Chief Technical Analyst, StockCharts.com
MORE ON VOLATILITY INDEX ... There seems to be a lot of confusion regarding the unusually high readings in the VIX. This may help. The CBOE Volatility (VIX) is currently trading at 75 which is the highest level in its history. That history, however, doesn't extend back to 1987....
READ MORE
MEMBERS ONLY

THE NEXT MAJOR SUPPORT LEVELS GO BACK TO THE 2002-2003 LOWS -- WATCH BOLLINGER BAND WIDTH FOR SIGNS OF A REBOUND -- MARKET STILL DROPPING
by John Murphy,
Chief Technical Analyst, StockCharts.com
NEXT MAJOR SUPPORT ... One of our readers suggested that we get back to basics and simply point out where the next major support levels are located. To do that we have to rely on monthly price charts. In a major bear market, the best way to look for potential support...
READ MORE
MEMBERS ONLY

STOCKS BALK AT COORDINATED RATE CUTS -- DOW REMAINS OVERSOLD -- GOLD BENEFITS AS SAFE HAVEN -- GOLD MINERS ETF SURGES -- BONDS FALL AFTER BIG RATE CUT -- WATCH TBILL RATES FOR CREDIT CRISIS CLUES
by John Murphy,
Chief Technical Analyst, StockCharts.com
GLOBAL RATE CUTS FAIL TO INSPIRE... Today's Market Message was written by Arthur Hill. John Murphy will return tomorrow. - Editor
The Fed, European Central Bank, Bank of England, Bank of Canada and other central banks cut interest rates in an effort to thwart the global financial crisis. In...
READ MORE
MEMBERS ONLY

GLOBAL MARKETS PLUNGE ON CREDIT FEARS -- COMMODITIES ALSO FALL ALONG WITH THE EURO -- THE ONLY WINNERS WERE BONDS, THE DOLLAR, GOLD, AND THE YEN -- STOCKS MAKE BACK HALF OF DAY'S LOSSES IN THE AFTERNOON
by John Murphy,
Chief Technical Analyst, StockCharts.com
BONDS, GOLD, THE DOLLAR, AND YEN BENEFIT... First the good news. With global stocks and commodities falling sharply today, there were only a few markets that actually made money. Treasury bonds and notes rose as yields tumbled (Chart 1). The U.S. Dollar Index also gained ground as foreign currencies...
READ MORE
MEMBERS ONLY
SEPTEMBER WEAKNESS SPILLING OVER
Two weeks ago, I said to buy the bottom. Sometimes, you're just wrong. I was wrong. Technical analysis is to the study of price action to increase the odds of predicting future price action. It's not an exact science, there are no guarantees, and there are...
READ MORE
MEMBERS ONLY
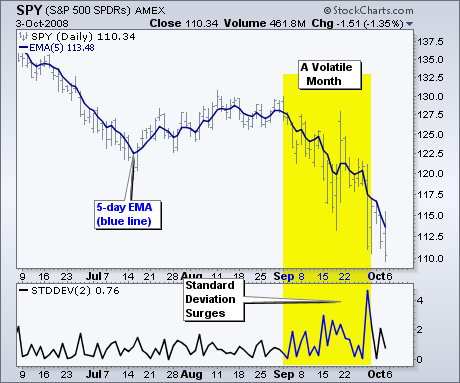
FILTERING THE NOISE
September was one of the most volatile months in recent memory. Bar charts and candlestick charts are great, but the wild high-low swings can interfere with basic trend analysis. Moving averages provide a good means to smooth this volatility by cutting through the daily noise. For those who want...
READ MORE
MEMBERS ONLY
BUYING OPPORTUNITY?
In my September 19 article I said: "Our indicators and price action suggest strongly that we are beginning a rally that should last at least a couple of weeks. I also think that this week's deep low needs to be retested, and I am not convinced that...
READ MORE
MEMBERS ONLY
WHERE ARE WE NOW?
The bear market reasserted itself last week in a violent manner; trading sharply higher and lower in a matter of hours and days. This isn't your garden variety bear market as this one smells and feels much different given the enormity of the credit crisis. And there is...
READ MORE
MEMBERS ONLY
SELLING SHOULD HAVE BEEN DONE MONTHS AGO
Over the past couple of weeks, I've suggested taking no new action in the stock market. Part of my reasoning is that we've been recommending a bearish strategy for the past year and see no reason to change that. Selling should have been done earlier in...
READ MORE
MEMBERS ONLY
THE NEW LANDSCAPE
With all the changes happening in the financial world right now it's gotten really hard to keep up with the latest news. This bank is failing. That company is merging with this one. That sector is over exposed to the credit crunch. Etc., etc., etc.
One of the...
READ MORE
MEMBERS ONLY

WHY OCTOBER ISN'T A GOOD TIME TO SELL -- SO MANY BOTTOMS HAVE FORMED DURING OCTOBER THAT IT'S KNOWN AS A BEAR KILLER -- MARKET HITS NEW LOW TODAY AS HOUSE PASSES BAILOUT PLAN
by John Murphy,
Chief Technical Analyst, StockCharts.com
SELLING SHOULD HAVE BEEN DONE MONTHS AGO... Over the past couple of weeks, I've suggested taking no new action in the stock market. Part of my reasoning is that we've been recommending a bearish strategy for the past year and see no reason to change that....
READ MORE
MEMBERS ONLY

MORE ON MOVING AVERAGES -- DAILY AND WEEKLY EMAS REMAIN NEGATIVE -- MONTHLY EMAS TURN NEGATIVE FOR FIRST TIME IN SEVEN YEARS -- STOCKS AND COMMODITIES HAVE ANOTHER BAD DAY
by John Murphy,
Chief Technical Analyst, StockCharts.com
SMOOTHING OUT PRICE TRENDS ... Arthur Hill wrote yesterday how moving average trends smooth out the market's intra-day swings and help us keep our eye on the over-riding trend which is still down. One of the nice things about moving averages is that they remove emotion from...
READ MORE
MEMBERS ONLY

RAILS AND TRUCKERS PULL TRANSPORTS SHARPLY LOWER -- FALLING EURO HURTS COMMODITIES
by John Murphy,
Chief Technical Analyst, StockCharts.com
TRANSPORTS FALL TO NINE-MONTH LOW... Up until this week, transportation stocks had held up much better than the rest of the market. Not anymore. Today's plunge in the Dow Transports has pushed that barometer below its July low to the lowest level since January. Its relative strength...
READ MORE
MEMBERS ONLY

FINANCIALS SURGE AHEAD OF SENATE VOTE -- BIG BANKS TAKE THE LEAD -- USING MOVING AVERAGES TO LOWER THE NOISE -- DOWN SWING RESISTANCE FOR SPY -- RETRACEMENT TARGETS FOR SPY
by John Murphy,
Chief Technical Analyst, StockCharts.com
FINANCIAL SECTOR SHOWS RELATIVE STRENGTH... Today's Market Message was written by Arthur Hill. John Murphy will return tomorrow. - Editor
The market was mixed on Wednesday as investors waited for the Senate's vote on the bailout package. Despite overall indecisiveness, the Financials SPDR (XLF) showed strength by...
READ MORE
MEMBERS ONLY

EURO HAS BIGGEST DROP IN ITS HISTORY -- JUMP IN 3-MONTH T-BILL RATES SHOWS LESS FEAR -- MARKET REGAINS HALF OF YESTERDAY'S DROP -- FATE OF FINANCIALS MAY REST WITH CONGRESS
by John Murphy,
Chief Technical Analyst, StockCharts.com
EURO PLUNGES ON EUROPEAN BAILOUTS ... I've mentioned several times that the recent rebound in the U.S. Dollar was mainly the result of falling foreign currencies, especially the Euro. Never was that more true than today. The Euro's -2.5% plunge against the dollar was the...
READ MORE
MEMBERS ONLY

MARKET PLUNGES ON FAILURE TO PASS RESCUE PLAN -- BONDS AND GOLD RISE IN FLIGHT TO SAFETY -- PLUNGE IN EUROPEAN CURRENCIES PUSHES DOLLAR HIGHER -- MOST COMMODITIES FALL SHARPLY -- VIX SPIKES TO HISTORIC HIGH
by John Murphy,
Chief Technical Analyst, StockCharts.com
BONDS, GOLD, AND DOLLAR RISE ... Even before this afternoon's announcement that Congress rejected the massive rescue plan, stock prices were trading sharply lower. That announcement made a bad day even worse and pushed stocks into one of the biggest drops in recent memory. While all market sectors and...
READ MORE
MEMBERS ONLY

MARKETS WAIT ON RESCUE PLAN -- S&P 500 NEEDS TO CLEAR SEPTEMBER PEAK TO CONFIRM A BOTTOM -- WATCHING THE VIX FOR MARKET CLUES -- HOUSING STOCKS SHOW IMPROVEMENT FOR THE FIRST TIME IN THREE YEARS -- SIT TIGHT
by John Murphy,
Chief Technical Analyst, StockCharts.com
MARKETS ARE HOSTAGE TO GOVERNMENT ACTION... I can't ever remember a time when financial markets were so dependent on government action. Like everyone else, I watched with great interest the Congressional negotiations being played out behind closed doors (and in front of TV cameras). The consensus view is...
READ MORE
MEMBERS ONLY

BANKS LEAD STOCK RALLY ON HOPE RESCUE PLAN IS NEAR PASSAGE -- BONDS AND GOLD ARE ON THE DEFENSIVE -- VIX WEAKENS
by John Murphy,
Chief Technical Analyst, StockCharts.com
STOCKS ATTEMPT RALLY ... It was exactly a week ago that the stock market started to rally on news that a massive government rescue plan was in the works. That led to two strong updays at last week's end on huge volume. The fact that major stock indexes scored...
READ MORE
MEMBERS ONLY

STOCKS DRIFT AS MARKET WAITS -- DIA REMAINS IN A DOWNTREND -- IWM TURNS ERRATIC AT RESISTANCE -- HEALTHCARE SPDR FORMS HARAMI AT SUPPORT -- RESISTANCE REPULSES RETAIL ETFS
by John Murphy,
Chief Technical Analyst, StockCharts.com
STOCKS DRIFT LOWER ... Today's Market Message was written by Arthur Hill. John Murphy will return tomorrow. - Editor
The stock market lacked direction today as stocks drifted most of the day. It seems that the market is waiting on something. Hmm, what could it be? With a huge bailout...
READ MORE
MEMBERS ONLY

BONDS COULD BE A CASUALTY OF BAILOUT PLAN -- STOCKS SELL OFF AGAIN ON LIGHT VOLUME
by John Murphy,
Chief Technical Analyst, StockCharts.com
MORE SUPPLY ISN'T GOOD FOR BONDS... One of the side-effects of the massive government bailout plan is that it is going to have to sell a lot of bonds to raise that money. That means the supply of Treasury bonds is going to increase. When the supply...
READ MORE
MEMBERS ONLY

DOLLAR PULLBACK BOOSTS COMMODITY-RELATED ASSETS -- GOLD AND ENERGY PRICES ARE BOUNCING ALONG WITH RELATED SHARES
by John Murphy,
Chief Technical Analyst, StockCharts.com
DOLLAR PULLS BACK FROM RESISTANCE... On September 12, I wrote about how an overbought U.S. dollar was up against chart resistance. Chart 1 is an updated version of that earlier chart. It shows the U.S. Dollar Index backing off from chart resistance at 80 which was the low...
READ MORE
MEMBERS ONLY
BUY THIS BOTTOM
Market bottoms come in all shapes and sizes, but most have a few key ingredients. Without exception, critical market bottoms are borne out of excessive fear and panic. On Thursday, the VIX shot past 42. The last time we've seen the VIX that high, we were carving out...
READ MORE
MEMBERS ONLY
VOLUME AND VOLITILITY SURGE
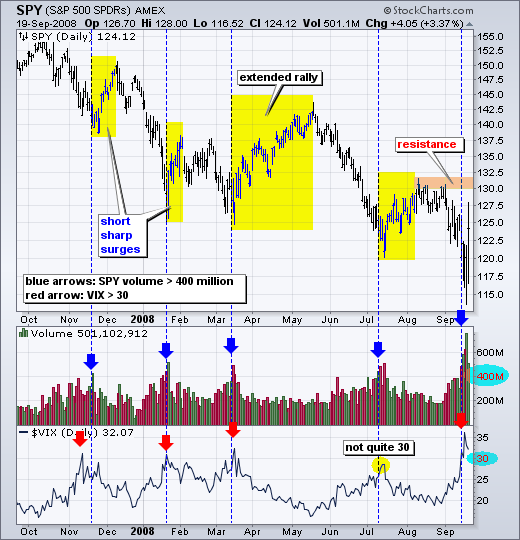
Volume and volatility surges foreshadowed bear market rallies in November, January and March. Both surged again this week and the market took notice with a huge bounce over the last two days. The chart below shows the S&P 500 ETF (SPY) with volume and the S&P...
READ MORE
