MEMBERS ONLY

FED LEAVES RATES ALONE AS EXPECTED -- RECENT COMMODITY DROP SHOULD ALLEVIATE INFLATION CONCERNS -- FIRM DOLLAR HURTS GOLD -- FINANCIALS, RETAILERS, AND AIRLINES LEAD MARKET BOUNCE -- DESPITE SHORT-TERM IMPROVEMENT, NO CONVINCING SIGNS OF A BOTTOM YET

by John Murphy,
Chief Technical Analyst, StockCharts.com
COMMODITY DROP SHOULD EASE INFLATION ... The Fed left the short-term rate unchanged at 2% today as expected. It did, however, cite growing inflation concerns along with a weakening economy. That's a bad combination. Most of the inflation increases, however, have come from rising commodities. With commodity markets...
READ MORE
MEMBERS ONLY

COMMODITIES AND THEIR RELATED STOCKS CONTINUE TO DROP -- GOLD AND OIL SERVICE INDEXES BREAK SUPPORT -- COPPER DROP HURTS FCX -- JOHNSON & JOHNSON HITS NEW RECORD AND LEADS DRUGS
by John Murphy,
Chief Technical Analyst, StockCharts.com
ALL COMMODITIES ARE IN THE RED ... The CRB Index is trading 12 points lower today with all seventeen commodities in the red. Chart 1 shows the DB Commodities ETF (DBC) falling to a three-month low. The other charts show losses in energy (Chart 2), precious metals (Chart 3), agriculture...
READ MORE
MEMBERS ONLY
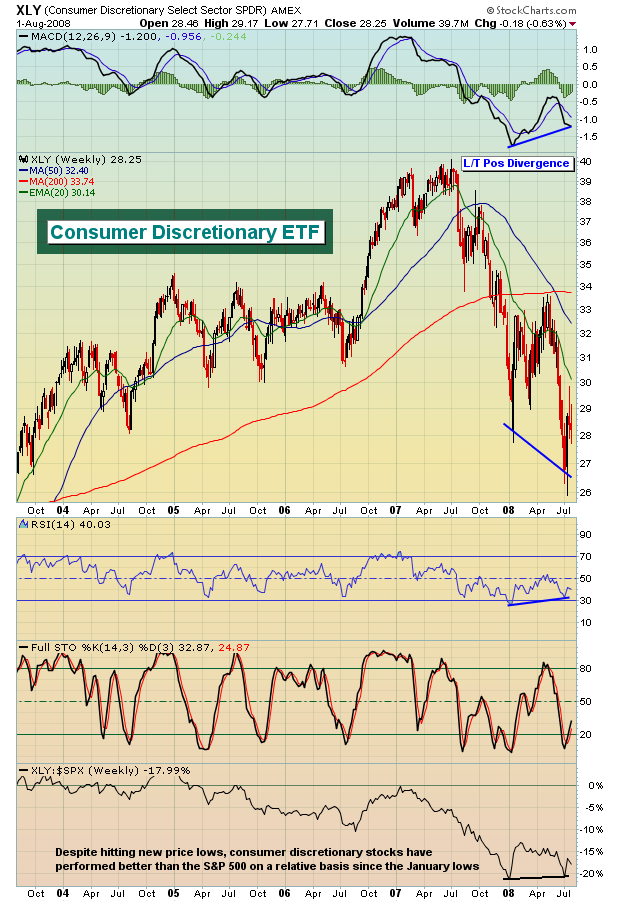
EARLY BULLISH SIGNS EMERGING?
Spotting tops and bottoms is perhaps the best reason for utilizing technical and sentiment indicators in your investing and trading arsenal. The first signs of a bottom forming can be subtle and I'm beginning to see a few. Consumer discretionary stocks, which have been relative laggards during the...
READ MORE
MEMBERS ONLY
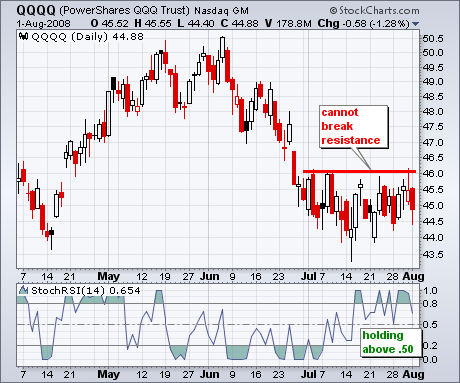
IWM AND QQQQ HIT RESISTANCE
The Russell 2000 ETF (IWM) and Nasdaq 100 ETF (QQQQ) were stifled at resistance this week and the bulls are getting a test. After surging above 69, IWM met resistance at broken support and the 62% retracement mark. QQQQ met resistance at 46 in early July and this level held...
READ MORE
MEMBERS ONLY
RALLY LACKS CONVICTION
The rally that began nearly three weeks ago, out of the jaws of a potential crash, has become rather unimpressive in the last two weeks. As I said in my last article, the rally seemed to be contrived from the beginning, and support for the rally has faded rather than...
READ MORE
MEMBERS ONLY
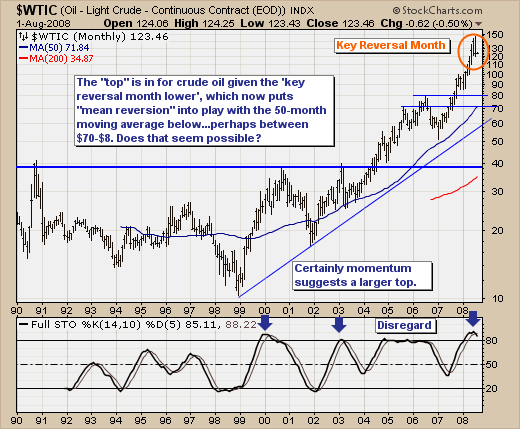
QUESTIONS FOR THE FUTURE
This past July-2008 was a very important month for the capital markets; crude oil peaked and traded lower by -11%. This is rather substantial to be sure, and one would be reasonable to believe that the demand/supply equation coupled with a daily technical oversold condition would push crude...
READ MORE
MEMBERS ONLY
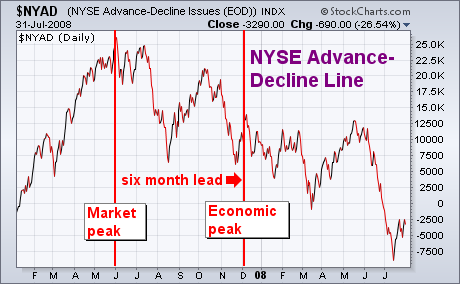
ECONOMISTS ARE LATE AS USUAL
In a recent Market Message, I discussed how the stock market is a leading indicator of the economy and why it isn't a good idea to use economic forecasting to trade the stock market. Historically, the market turns down at least six months before the economy. Chart 1...
READ MORE
MEMBERS ONLY

USING KELTNER CHANNELS
Hello Fellow ChartWatchers!
Let's start the month of August off right with a good, old-fashioned education article about the modern version of a good, old-fashioned chart overlay, Keltner Channels! Here we go...
Keltner Channels are a set of three lines that are overlaid on top of...
READ MORE
MEMBERS ONLY

BAD ECONOMIC NEWS IS LATE AS USUAL -- LOW PUT-CALL RATIO IS BEARISH WARNING -- SENTIMENT INDICATOR SHOWS IMPROVEMENT BUT NO UPTREND -- WHY I PREFER ETFS TO INDIVIDUAL STOCKS -- RAILS AND TRUCKERS WEIGH ON TRANSPORTS
by John Murphy,
Chief Technical Analyst, StockCharts.com
ECONOMISTS ARE LATE AS USUAL... In a recent Market Message, I discussed how the stock market is a leading indicator of the economy and why it isn't a good idea to use economic forecasting to trade the stock market. Historically, the market turns down at least six months...
READ MORE
MEMBERS ONLY

QQQQ AND TECHNOLOGY ARE LAGGING -- QQQQ REMAINS BELOW RESISTANCE -- SURGING OIL LIFTS OVERSOLD ENERGY ETFS -- LONG-TERM TRENDS FOR ENERGY ETFS REMAIN UP
by John Murphy,
Chief Technical Analyst, StockCharts.com
QQQQ SHOWS RELATIVE WEAKNESS ... Today's Market Message was written by Arthur Hill. John Murphy will return tomorrow. - Editor
The stock market bottomed on 15 July and surged over the last 11 trading days. Despite this big surge, performance has been unequal among the major index ETFs. Chart 1...
READ MORE
MEMBERS ONLY

FALLING OIL BOOSTS AIRLINES -- SOUTHWEST REMAINS AIRLINE LEADER -- BIOTECHS HAVE BEEN JULY'S STRONGEST GROUP -- AMGEN HAS BEEN A BIOTECH LEADER FOR NEARLY A MONTH -- A STRONGER DOLLAR IS HURTING COMMODITIES AND HELPING STOCKS
by John Murphy,
Chief Technical Analyst, StockCharts.com
OIL RESUMES DOWNTREND... A bounce in the dollar today is causing more selling in commodities. Gold, grains, and oil are all falling as a result. A $3 drop in the price of crude has pushed the United States Oil ETF (Chart 1) below its early June low near 100 and...
READ MORE
MEMBERS ONLY

A LOOK AT FOREIGN STOCK ETFS -- EMERGING MARKET ETF IS HOLDING ABOVE ITS MARCH LOW -- FALLING OIL PRICES ARE HURTING BRAZIL AND RUSSIA BUT HELPING TO STABILIZE CHINA AND INDIA -- MEDCO HEALTH SOLUTIONS TURNS UP
by John Murphy,
Chief Technical Analyst, StockCharts.com
A LOOK AT FOREIGN ETFS... One of our readers asked me to take a look at foreign ETFs. So here they are. Chart 1 shows the EAFE iShares (EFA) having lost 23% from their November peak. That puts them in bear market territory. The EFA chart doesn't look...
READ MORE
MEMBERS ONLY

HEALTHCARE CONTINUES TO ATTRACT NEW MONEY -- BIOGEN IDEC AND JOHNSON & JOHNSON ARE LEADERS -- THREE NEW ONES ARE ABC, BCR, AND VAR -- HOUSING AND FINANCIAL GROUPS LEAD MARKET LOWER -- DOW BACKS OFF FROM INITIAL RESISTANCE BARRIERS
by John Murphy,
Chief Technical Analyst, StockCharts.com
HEALTHCARE SPDR SHOWS RELATIVE STRENGTH ... Healthcare remains the only defensive group showing relative strength. Chart 1 shows the Health Care SPDR (XLV) moving up to challenge its spring highs. Its relative strength line (below chart) is much more impressive. The RS turned up during May (when the last market rally...
READ MORE
MEMBERS ONLY

RUSSELL 2000 REACHES 200-DAY -- A LONG-TERM HEAD-AND-SHOULDERS FOR THE DOW UTILITIES -- MATERIALS SECTOR SHOWS RELATIVE WEAKNESS -- STEEL ETF BREAKS 200-DAY -- LOOKING AT RETRACEMENTS IN THE LAST BEAR MARKET
by John Murphy,
Chief Technical Analyst, StockCharts.com
RUSSELL 2000 SURGES TO 200-DAY ... Today's Market Message was written by Arthur Hill. John Murphy will return tomorrow. - Editor
The Russell 2000 surged to its 200-day moving average with an extremely sharp move over the last seven days. This small-cap index showed less weakness by...
READ MORE
MEMBERS ONLY

AIRLINES AND FINANCIALS LEAD MARKET HIGHER -- AMR, CAL, AND LUV BOUNCE OFF LONG-TERM SUPPORT LINES -- SOUTHWEST IS UPSIDE LEADER --AIRLINE RALLY MAY BE ANOTHER SIGN THAT OIL HAS PEAKED
by John Murphy,
Chief Technical Analyst, StockCharts.com
AIRLINE INDEX CLEARS 50-DAY LINE ... Another possible sign that oil prices have peaked was today's spectular rally in airline shares. Chart 1 shows the AMEX Airline Index (XAL) jumping 22% today to make it day's strongest group by far. In addition, the XAL clearled its...
READ MORE
MEMBERS ONLY

MOST COMMODITIES ARE IN CORRECTIONS -- GOLD MAY ALSO BE VULNERABLE AS DOLLAR ETF BOUNCES OFF MARCH LOW -- A POTENTIAL BOTTOM IN US BOND YIELDS MAY HELP STABILIZE THE DOLLAR -- THAT COULD PUT THE COMMODITY UPTREND IN JEOPARDY
by John Murphy,
Chief Technical Analyst, StockCharts.com
ENERGY IS THE LAST COMMODITY GROUP TO ROLL OVER ... I've gotten a lot of questions regarding my article last week about commodities having entered into a downside correction. One reader asked if there were any commodity ETFs in existence. There are several of them. Chart 1 shows the...
READ MORE
MEMBERS ONLY
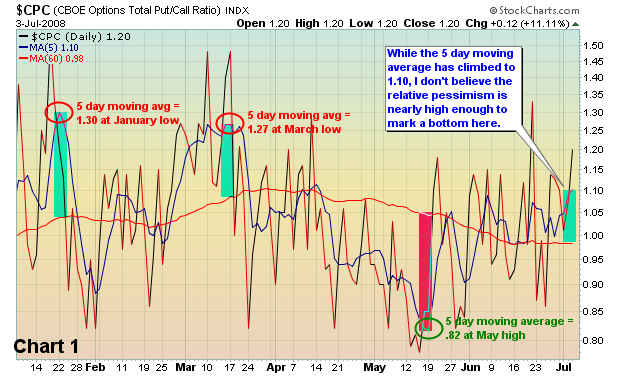
POOR SENTIMENT, MAX PAIN AND THE BOWLEY TREND
Tuesday afternoon marked a short-term bottom. In my opinion, we're going to print AT LEAST one more low in time; however, the sentiment had deteriorated on Tuesday to a point where we normally we see a rebound. In addition, there was TONS of net put premium (in-...
READ MORE
MEMBERS ONLY
BAD NEWS FOR BONDS
After the Producer Price Index (PPI) surged on Tuesday, it was little surprise to see big gains in the Consumer Price Index (CPI) on Wednesday. Bernanke warned of inflation in his congressional testimony last week and the PPI-CPI figures confirm. The CPI surged 5% year-on-year and 1....
READ MORE
MEMBERS ONLY
DISASTER AVERTED, SO FAR
In my July 3 article I warned that the market was oversold, dangerous, and vulnerable to a crash. On Tuesday of this week, the S&P 500 opened down, breaking significant support, and kept moving lower. I thought to myself, "This is it. Crash in progress." Then...
READ MORE
MEMBERS ONLY

RALLY FORTHCOMING IN HOUSING MARKET?
Last week may very well have been an important turning point in the US stock market, with the Dow Industrials and the Russell 2000 Small Caps as forming bullish "key reversal" patterns to the upside. This would suggest an increased probability of further strength on the order of...
READ MORE
MEMBERS ONLY
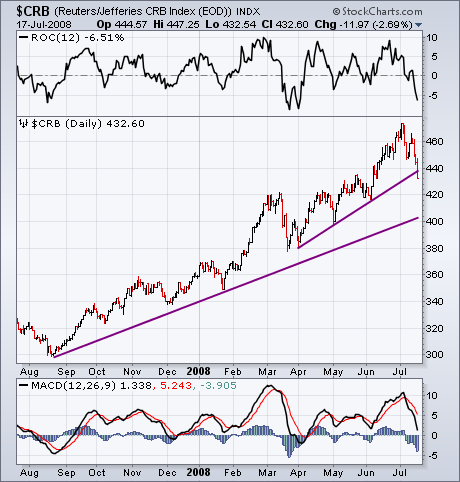
SHORT-TERM SELL SIGNALS GIVEN
This week's downturn in crude oil prices has had a depressing effect on the entire commodity group. Chart 1 shows the CRB Index (plotted through Thursday) breaking a three-month up trendline (and its 50-day moving average). The 12-day Rate of Change (ROC) line (top of...
READ MORE
MEMBERS ONLY

PINNING DOWN YOUR ANNOTATIONS
Hello Fellow ChartWatchers!
This week I wanted to tell you about a new feature we've just rolled out in our ChartNotes chart annotation tool. It is called "pinning" and it allows you to prevent any of your saved annotations from scrolling to the left over time....
READ MORE
MEMBERS ONLY

COMMODITIES MAY HAVE PEAKED FOR NOW -- WEEKLY AND MONTHY CHARTS SHOW OVERBOUGHT COMMODITIES IN NEED OF A CORRECTION -- COMMODITIES ARE TOO HIGH RELATIVE TO STOCKS
by John Murphy,
Chief Technical Analyst, StockCharts.com
SHORT-TERM SELL SIGNALS GIVEN ... This week's downturn in crude oil prices has had a depressing effect on the entire commodity group. Chart 1 shows the CRB Index (plotted through Thursday) breaking a three-month up trendline (and its 50-day moving average). The 12-day Rate of...
READ MORE
MEMBERS ONLY

ANOTHER OIL DROP BOOSTS MARKET -- ENERGY SPDR BREAKS 200-DAY LINE -- FINANCIALS AND CONSUMER DISCRETIONARY STOCKS LEAD REBOUND -- NASDAQ AND RUSSELL 2000 BOUNCE OFF MARCH LOWS -- MOVING AVERAGE TREND IS STILL DOWN BUT IMPROVING
by John Murphy,
Chief Technical Analyst, StockCharts.com
CRUDE OIL BREAKS SUPPORT... On Tuesday I suggested that the downside correction in energy shares warned of possible weakening in the price of crude. The drop in energy shares became more serious today. So did the drop in crude. Crude oil fell another $4.91 (-3.6%) today. Chart 1...
READ MORE
MEMBERS ONLY

RUSSELL 2000 AND NASDAQ LEAD REBOUND -- FINANCIAL AND CONSUMER DISCRETIONARY SECTORS GET BIG OVERSOLD BOUNCES -- SURGING CPI WEIGHS ON BONDS -- DOW THEORY REMAINS ON SELL SIGNAL
by John Murphy,
Chief Technical Analyst, StockCharts.com
SMALL-CAPS AND TECHS SHOW RELATIVE STRENGTH ... Today's Market Message was written by Arthur Hill. John Murphy will return tomorrow. - Editor
It has been a tale of two markets over the last few months. On one side, the Dow Industrials and S&P 500 were weighed down...
READ MORE
MEMBERS ONLY

ENERGY STOCKS CORRECT FURTHER -- THAT MAY HINT AT OIL WEAKNESS -- DEFENSIVE LEADERSHIP STILL FAVORS STAPLES, HEALTHCARE, AND UTILITIES -- NO SIGN OF A BOTTOM YET IN FINANCIALS
by John Murphy,
Chief Technical Analyst, StockCharts.com
ENERGY STOCKS CONTINUE DOWNSIDE CORRECTION ... A big drop in energy prices made energy the day's weakest sector. Actually, energy stocks have been correcting for the past two weeks. Chart 1 shows that the Energy SPDR (XLE) broke its 50-day average a couple of weeks back on heavy...
READ MORE
MEMBERS ONLY

MARKET OFF TO ANOTHER BAD START -- FOREIGN CURRENCIES SURGE AGAINST DOLLAR -- BIOTECHS AND DRUGS CONTINUE TO ATTACT DEFENSIVE MONEY -- DNA BOOSTS BIOTECH HOLDERS -- ABT AND JNJ ARE BIG PHARMA LEADERS
by John Murphy,
Chief Technical Analyst, StockCharts.com
FOREIGN CURRENCIES JUMP ... The U.S. Dollar is coming under a lot of pressure. The most significant drop is against the Euro which touched a new record today (Chart 1). In fact, all major currencies are rallying against the dollar. Charts 2 through 4 show upturns in the British Pound,...
READ MORE
MEMBERS ONLY

FINANCIALS LEAD MARKET LOWER AGAIN -- S&P 500 EMA TREND IS STILL DOWN -- GOLD STOCK ETF BREAKS OUT -- CELGENE AND GENZYME ARE BIOTECH LEADERS -- VIX STILL NOT HIGH ENOUGH TO SIGNAL A BOTTOM
by John Murphy,
Chief Technical Analyst, StockCharts.com
REGIONAL BANKS TUMBLE ... The rout in financial shares continues. Chart 1 shows Bank Regional Holders tumbling to the lowest level in six years. That contributed to more big losses in the entire financial sector. Chart 2 shows the RHK bearing down on its 2002 lows. As has been suggested herein...
READ MORE
MEMBERS ONLY

THE LONG-TERM PICTURE FOR DIA, SPY AND QQQQ -- BREADTH REMAINS WEAK AND WITHOUT A DIVERGENCE -- XLF APPROACHES ITS 2002-2003 LOWS -- ITB STILL UNDERPERFORMING -- BIOTECHS SHOW RELATIVE STRENGTH
by John Murphy,
Chief Technical Analyst, StockCharts.com
TAKING A BIG STEP BACK... Today's Market Message was written by Arthur Hill. John Murphy will return next week. - Editor
The stock market is oversold, but just getting even more oversold. Chart 1 shows the Dow Industrials ETF (DIA) moving to a new low for 2008. The Commodity...
READ MORE
MEMBERS ONLY

QQQQ AND IWM MANAGE TO FIRM -- CONSUMER DISCRETIONARY SPDR AND RETAIL SPDR RECORD NEW LOWS -- GOLD SURGES AS DOLLAR SAGS - SECTOR PERFORMANCE SINCE THE OCTOBER AND MAY HIGHS
by John Murphy,
Chief Technical Analyst, StockCharts.com
TO BOUNCE OR NOT TO BOUNCE... Today's Market Message was written by Arthur Hill. John Murphy will return next week. - Editor
The major indices surged on Tuesday, pulled back sharply on Wednesday and then firmed on Thursday. Needless to say, there is a serious tug-o-war underway...
READ MORE
MEMBERS ONLY

STOCKS GET COLD FEET -- FINANCIALS ABOUT FACE AND LEAD THE WAY LOWER - HEALTHCARE SHOWS RELATIVE STRENGTH -- USING STOCHASTICS WITH THE SECTOR CARPET
by John Murphy,
Chief Technical Analyst, StockCharts.com
EASY COME EASY GO ... Today's Market Message was written by Arthur Hill. John Murphy will return next week. - Editor
After a big rebound in the financial sector on Tuesday, stocks got cold feet on Wednesday and retreated. The major indices closed sharply lower with small-caps and techs...
READ MORE
MEMBERS ONLY

MAJOR INDEX ETFS REBOUND -- IWM AND QQQQ LEAD -- GENTLE BEN FIRES UP FINANCIALS -- U.S. DOLLAR INDEX GETS A BOUNCE -- OIL FALLS FOR SECOND DAY
by John Murphy,
Chief Technical Analyst, StockCharts.com
TECHS AND SMALL-CAPS LEAD MARKET REBOUND ... Today's Market Message was written by Arthur Hill. John Murphy will return next week. - Editor
The stock market rebounded on Tuesday with the Russell 2000 ETF (IWM) and the Nasdaq 100 ETF (QQQQ) leading the charge. IWM surged over 3%, while...
READ MORE
MEMBERS ONLY
PANIC AND FEAR? NO SIGNS JUST YET
I'm the conservative type. I'm also nervous. I never like to see the market fall precipitously while market participants yawn. In a nutshell, that's what we've been seeing. Yes, the talking heads will say the sky is falling, but unfortunately for bulls,...
READ MORE
MEMBERS ONLY
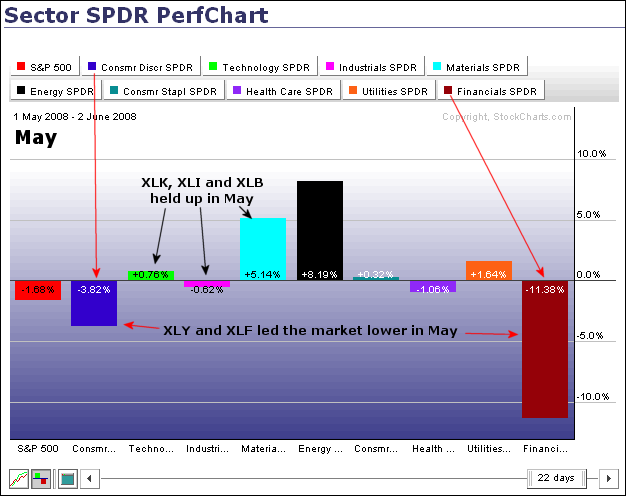
BEAR MARKET EXPANDS!
Sector performance in May and June shows the bear extending its grip into other key sectors. The Financials SPDR (XLF) and the Consumer Discretionary SPDR (XLY) woke up the bear with dismal performances in May. The first PerfChart shows sector performance from 1-May until 2-June, which is basically...
READ MORE
MEMBERS ONLY
VERY DANGEROUS MARKET
A bullish take on the stock market would be that (1) market indicators are very oversold, (2) there is a triple bottom setup on the S&P 100 Index, and (3) sentiment polls show a lot of bearishness. I agree that those conditions exist, but we are in a...
READ MORE
MEMBERS ONLY
SITE NEWS: "UNIVERSAL LOGIN" NOW WORKING
"UNIVERSAL LOGIN" NOW WORKING - We've finally, finally, finally fixed something that has been bugging lots of people for a long time. In the past, we had two very different ways to log into our website. People who subscribed to our Extra or Basic charting service logged...
READ MORE
MEMBERS ONLY
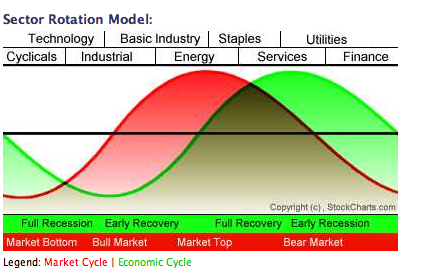
SECTOR ROTATION SAYS BEARISH
SECTOR ROTATION MODEL... One of our readers asked where we are in the Sector Rotation Model. That model shows the normal sector rotation that takes place at various stages in the business cycle. The chart shows that basic materials and energy are market leaders at a market peak. As the...
READ MORE
MEMBERS ONLY
UNAVOIDABLE BAD NEWS (AND HOW TO AVOID IT)
Hello Fellow ChartWatchers!
This week's edition of ChartWatchers is full of important information including a lively debate about the health of the market - Tom Bowley is actually optimistic (well... somewhat), Arthur Hill not so much. But first, I have several items that are super important for our members:...
READ MORE
MEMBERS ONLY

DEFENSIVE LEADERS ARE KROGER, AMGEN, AND EXELON -- SECTOR ROTATION MODEL FAVORS STAPLES, HEALTHCARE, AND UTILITIES -- WITH MATERIALS PEAKING, ENERGY STOCKS MAY BE VULNERABLE -- WEAK ECONOMIC NEWS IS CONFIRMING WHAT THE MARKET TOLD US SIX MONTHS AGO
by John Murphy,
Chief Technical Analyst, StockCharts.com
DEFENSIVE STOCK LEADERS ... Arthur Hill pointed out again yesterday that defensive groups like consumer staples, healthchare, and utilities have been attracting new money over the past month. By using our Sector Market Carpet, I've isolated a leading stock in each of those three groups. They should offer some...
READ MORE
MEMBERS ONLY

RUSSELL 2000 AND SMALL-CAPS LEAD BROAD DECLINE -- MATERIALS SECTOR BREAKS DOWN -- STEEL STOCKS FEEL THE HEAT -- RAILROADS LEAD THE DOW TRANSPORTS SHARPLY LOWER -- DEFENSIVE SECTORS SHOW RELATIVE STRENGTH
by John Murphy,
Chief Technical Analyst, StockCharts.com
SMALL-CAPS LEAD THE MARKET LOWER ... Today's Market Message was written by Arthur Hill. John Murphy will return tomorrow. - Editor
The Russell 2000 led the market lower on Wednesday as selling intensified in small-caps. Chart 1 shows the Russell 2000 relative to the S&P 100,...
READ MORE
