MEMBERS ONLY

RUSSELL 2000 AND SMALL-CAPS LEAD BROAD DECLINE -- MATERIALS SECTOR BREAKS DOWN -- STEEL STOCKS FEEL THE HEAT -- RAILROADS LEAD THE DOW TRANSPORTS SHARPLY LOWER -- DEFENSIVE SECTORS SHOW RELATIVE STRENGTH

by John Murphy,
Chief Technical Analyst, StockCharts.com
SMALL-CAPS LEAD THE MARKET LOWER ... Today's Market Message was written by Arthur Hill. John Murphy will return tomorrow. - Editor
The Russell 2000 led the market lower on Wednesday as selling intensified in small-caps. Chart 1 shows the Russell 2000 relative to the S&P 100,...
READ MORE
MEMBERS ONLY

FRANCE AND GERMANY ARE IN BEAR MARKETS -- COMMODITY EXPORTERS HOLD UP WHILE IMPORTERS FALL -- GOLD ACHIEVES BULLISH BREAKOUT -- FEDEX AND UPS HIT MULTI-YEAR LOWS -- LOW VIX AND CPC READINGS SUGGEST MORE SELLING TO COME
by John Murphy,
Chief Technical Analyst, StockCharts.com
THE FALL OF EUROPE... European markets have done even worse than the U.S. Of the three biggest countries there, the weakest have been France and Germany. Chart 1 shows the CAC-40 trading 28% off last year's high. Today's drop put the French market at...
READ MORE
MEMBERS ONLY

MARKET DROP IS JUST SHY OF AN OFFICIAL BEAR MARKET AS S&P 500 RETESTS MARCH LOW -- OVERSOLD MARKET MAY GET A JULY 4 BOUNCE
by John Murphy,
Chief Technical Analyst, StockCharts.com
MARKET HASN'T REACHED 20% THRESHOLD YET... A lot was made in the media over the weekend about the Dow Industrials having lost 20% from its October peak which is bear market territory. It is true that a 20% drop from a previous peak qualifies as an "official&...
READ MORE
MEMBERS ONLY

MONEY ROTATES TOWARD DEFENSIVE GROUPS -- GOLD STOCKS ARE WEEK'S TOP GROUP -- LONG-TERM CHARTS SHOW STOCKS STILL IN A MAJOR BEAR MARKET
by John Murphy,
Chief Technical Analyst, StockCharts.com
MONEY MOVES TOWARD DEFENSIVE GROUPS ... It's no secret that the market's weakest groups have been financials and consumer discretionary stocks that include autos, homebuilders, and retailers. Those groups have been leading the market lower. It's interesting to see where some money has been going...
READ MORE
MEMBERS ONLY

GENERAL MOTORS PLUNGES TO TWO-DECADE LOW -- RESEARCH IN MOTION TUMBLES 12%
by John Murphy,
Chief Technical Analyst, StockCharts.com
US AUTOMAKERS LOOK SICK ... One of our readers asked how the chart of General Motors looked. Rather than analyzing it, I'm just going to show it to you. The chart doesn't need any explanation. Today's 11% plunge in GM has pushed the stock to...
READ MORE
MEMBERS ONLY

DOW HITS TWO-YEAR LOW AS GM AND FINANCIALS LEAD IT LOWER -- RIMM LEADS BIG SELLOFF IN NASDAQ 100 -- TIPS LEAD BOND BOUNCE -- FALLING DOLLAR GIVES BIG BOOST TO GOLD AND OTHER COMMODITIES
by John Murphy,
Chief Technical Analyst, StockCharts.com
DOW BREAKS MARCH LOW -- NASDAQ 100 TUMBLES ... The market is under heavy selling pressure today. Chart 1 shows the Dow Industrials trading below its March low which is the lowest level in nearly two years. Other big board indexes are bearing down on their March lows. Autos and financials are...
READ MORE
MEMBERS ONLY

BOND YIELDS PREDICT FED POLICY -- CHEMICAL STOCKS AND PROFITS UNDER PRESSURE -- USO HOLDS THE GAP -- XLE FORMS TRIANGLE -- RUSSELL 2000 BREAKS SUPPORT -- SMALL-CAPS VERSUS LARGE-CAPS
by John Murphy,
Chief Technical Analyst, StockCharts.com
FED LEAVES RATES UNCHANGED ... Today's Market Message was written by Arthur Hill. John Murphy will return tomorrow. - Editor
As widely expected, the Fed left the federal funds rate and the discount rate unchanged. Inflationary pressures were cited for the decision. Way back in August, the Fed began cutting...
READ MORE
MEMBERS ONLY

SAME OLD STORY -- FALLING FINANCIALS AND RISING OIL HURT MARKET -- FINANCIALS ARE PULLING THE DOW DOWN -- OIL SERVICE AND NATURAL GAS ETFS HIT NEW HIGHS -- STEEL STOCKS HAVE STRONG DAY -- UTILITIES ARE BOUNCING WHILE TRANSPORTS CONTINUE TO WEAKEN
by John Murphy,
Chief Technical Analyst, StockCharts.com
FINANCIALS WEIGH ON DOW ... One of our readers asked why the Dow is acting so much worse than the Nasdaq 100. Chart 1 shows the disparity. While the Dow is nearing a test of its March low, the Powershares QQQ Trust (QQQQ) has held up much better. To answer that...
READ MORE
MEMBERS ONLY
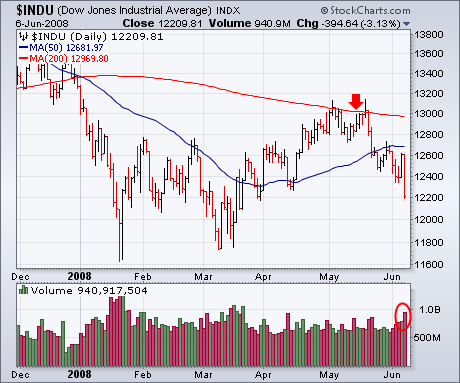
FINANCIALS LENDING NO SUPPORT
On May 19th, I discussed what appeared to be a topping market. Since that time, the Dow has lost 8.82%. The S&P 500 has lost 7.51%. The NASDAQ has lost 4.86%. The SOX has lost 9.24%. The XLF (an ETF that tracks financials) has...
READ MORE
MEMBERS ONLY
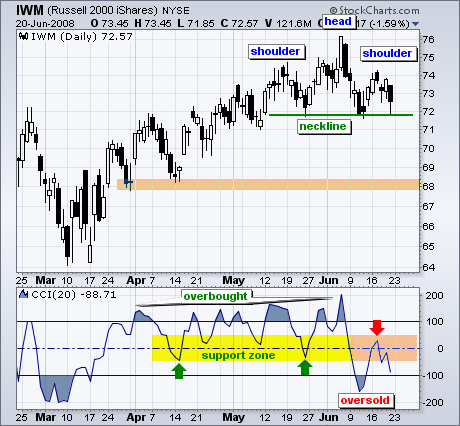
A LITTLE DANDRUFF FOR IWM
Despite a big decline in the S&P 500 ETF (SPY) over the last five weeks, the Russell 2000 ETF (IWM) has been holding up pretty well. However, a bearish reversal pattern and weakening momentum suggest that IWM will ultimately follow its big brother lower.
On the price chart,...
READ MORE
MEMBERS ONLY
IT'S STILL A BEAR & THE OIL BUBBLE
Discussions about the price of oil are in the news every day, but my observation is that, for the most part, these discussions serve only to confuse the public more. Most popular are the conspiracy theories, blaming the high prices on shadowy behind-the-scenes manipulators. These theories have one...
READ MORE
MEMBERS ONLY
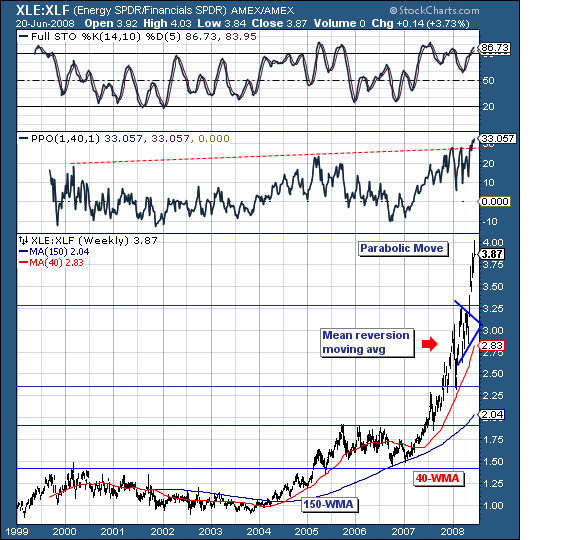
FOCUSING ON S&P ENERGY/FINANCIALS
As the world stock markets have embarked on what arguably is another "leg lower"; we are left to wonder aloud what the relative rotation beneath the surface of this decline will look like in terms of tactical allocation. Our focus has been upon the S&P Energy...
READ MORE
MEMBERS ONLY
FED'S IN A BOX, AND BEAR FUNDS ARE RISING
THE FED'S IN A BOX ... I've written recently about the Fed turning its attention away from the economy and back to inflation. Unfortunately, this week's market downturn is going to make its job a lot harder. The Fed apparently concluded that its easing program...
READ MORE
MEMBERS ONLY
CHARTNOTES IMPROVEMENTS
This weekend we've updated our ChartNotes chart annotation tool. On the surface everything looks the same, but for frequent ChartNotes users that are willing to remember a couple of new keyboard/mouse combinations, things should be much better. We've also thrown in some extra Fibonacci Lines...
READ MORE
MEMBERS ONLY

STOCKS ARE HEADED FOR A TEST OF MARCH LOWS -- THE FED'S IN A BOX -- IT CAN'T LOWER RATES OR RAISE THEM -- STAGFLATION IS THE REASON WHY
by John Murphy,
Chief Technical Analyst, StockCharts.com
MARCH LOWS IN SIGHT... The stock market keeps going from bad to worse. Arthur Hill wrote on Wednesday that the market appeared to have begun another downleg. It sure looks that way. At the very least, we can say with some degree of confidence that the March lows are going...
READ MORE
MEMBERS ONLY

SEMIS WEIGH ON THE NASDAQ -- RELATIVE WEAKNESS IN FINANCIALS AND CONSUMER DISCRETIONARY CONTINUES -- BULLISH PERCENTS DIP BELOW 50% - DOWNSIDE TARGETS FOR THE DOW -- USING THE MEASURED MOVE
by John Murphy,
Chief Technical Analyst, StockCharts.com
SEMIS DRAG NASDAQ LOWER... Today's Market Message was written by Arthur Hill. John Murphy will return tomorrow. - Editor
The Nasdaq dropped over 1% on Wednesday with weakness in the semis. Chart 1 shows the Nasdaq breaking back below the 50-day moving average with a gap down today....
READ MORE
MEMBERS ONLY

CAN'T BLAME RISING GRAIN PRICES ON TRADERS -- ENERGY ETFS STILL IN UPTRENDS -- REGIONAL BANKS LEAD FINANCIALS LOWER -- HOMEBUILDERS AND RETAILERS WEIGH ON CONSUMER DISCRETIONARY SECTOR -- 13 AND 34 DAY EMAS ARE NEGATIVE
by John Murphy,
Chief Technical Analyst, StockCharts.com
RAIN KEEPS GRAIN PRICES RISING... With all of the focus on energy and precious metals, let's not forget the strong price action in agriculatural markets. chart 1 shows the DB Agriculatural ETF climbing again today after recently exceeding its April high. The DBA is second only to energy...
READ MORE
MEMBERS ONLY

RISING US RATES SHOULD HELP THE DOLLAR AND COULD HURT COMMODITIES -- WITH RATES RISING BECAUSE OF GLOBAL INFLATION, BONDS AND STOCKS MAY RECOUPLE FOR THE FIRST TIME IN A DECADE
by John Murphy,
Chief Technical Analyst, StockCharts.com
US RATES ARE HEADED HIGHER... All signs are pointing to the idea that U.S. interest rates have bottomed and are heading higher. Today's May CPI report (the real one, not the fake core rate) showed a monthly increase of 0.6%. That's a gain of...
READ MORE
MEMBERS ONLY

FINANCE AND TECH LEAD MARKET LOWER -- NEW LOWS EXPAND ON NASDAQ AND NYSE -- TRUCKERS AND RAILS DRAG TRANSPORTS LOWER -- AGRICULTURE ETF SURGES
by John Murphy,
Chief Technical Analyst, StockCharts.com
FINANCE LEADS THE MARKET LOWER - AGAIN... Today's Market Message was written by Arthur Hill. John Murphy will return tomorrow. - Editor
The stock market took another hit on Wednesday with downside leadership coming from the financial and technology sectors. Relative weakness in the financial sector continues to plague the...
READ MORE
MEMBERS ONLY

RISING RATES BOOST THE DOLLAR WHICH PUSHES COMMODITIES LOWER -- MR BERNANKE IS NOW MORE CONCERNED ABOUT INFLATION
by John Murphy,
Chief Technical Analyst, StockCharts.com
BOND YIELDS RISE ON INFLATION CONCERNS ... Comments from the Fed head that inflation was now his bigger concern sent bond yields sharply higher today on expectations that the Fed may start raising rates to keep inflation under control. Chart 1 shows the 10-Year T-Note Yield closing at the...
READ MORE
MEMBERS ONLY
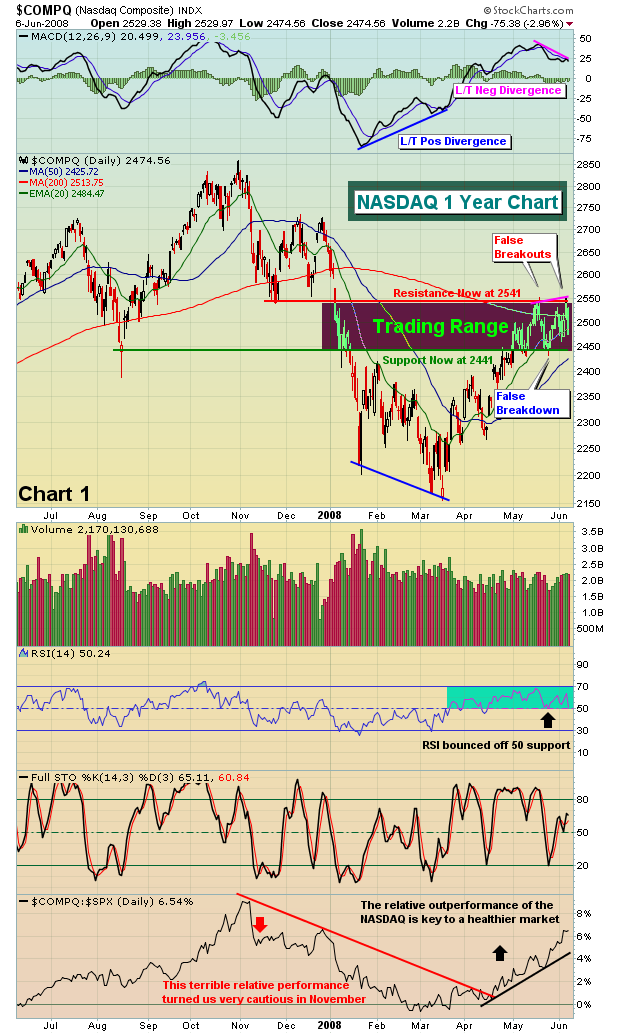
RESISTANCE HOLDING, BAD NEWS FOR BULLS
Let's focus first on one of the strongest indices, the NASDAQ. Technology stocks have been performing quite well and there's been a challenge for the tech-heavy NASDAQ to pierce price resistance at 2541. Thursday's close of 2549 was enticing, but volume was just...
READ MORE
MEMBERS ONLY

SMACK DOWN AT RESISTANCE
Even though techs and small-caps have been showing relative strength the last several weeks, the Nasdaq and the Russell 2000 are running into stiff resistance of their own. Their charts show similar setups that point to a medium-term peak.
First, let's look at the reasons for...
READ MORE
MEMBERS ONLY
THREE MARKET VIEWS
There are three market indexes that capture the most attention: The Dow Jones Industrial Average (DJIA), the S&P 500 Index (SPX), and the Nasdaq 100 Index (NDX). Together they represent about 80% of the total U.S. market capitalization. While they are normally more or less in sync...
READ MORE
MEMBERS ONLY
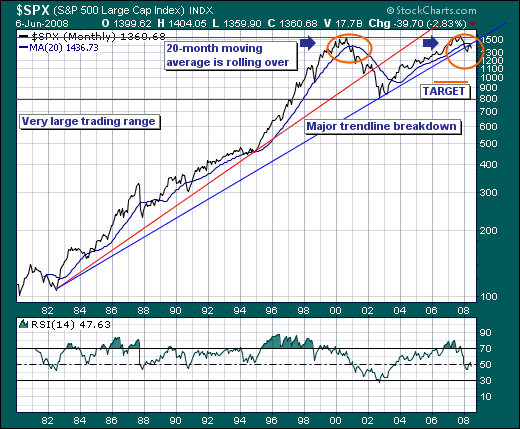
LOOKING TOWARDS THE HORIZON
When markets become as volatile as they have in the past week; it is best to stand back and take a look at the longer-term time horizon. We like to use the S&P 500 as our proxy; and as week look at the monthly chart - we find...
READ MORE
MEMBERS ONLY
BEARISH FORCES RETAKE THE MARKET
There have been two consistent themes that myself and Arthur Hill have been stressing in recent Market Messages. One has been that the rally from mid-March is a bear market rally. The other has been that the rally has probably ended. That dual reality was brought into sharper focus...
READ MORE
MEMBERS ONLY
TIME INDEPENDENT CHARTS REDUCE EMOTIONAL INVESTING
StockCharts now has four different "time independent" forms of charting. I thought I'd take some time this week to introduce you to all four.
A "Time Independent" chart is a chart that doesn't have a consistent horizontal axis. On a typical price...
READ MORE
MEMBERS ONLY

BEARS ARE BACK IN CONTROL -- BONDS BOUNCE OFF 200-DAY LINES AS STOCKS DROP -- GOLD BENEFITS FROM FALLING DOLLAR AND WEAK STOCK MARKET -- TAKING OUT BEAR MARKET INSURANCE -- VIX SURGES
by John Murphy,
Chief Technical Analyst, StockCharts.com
BEARISH FORCES RETAKE THE MARKET... There have been two consistent themes that myself and Arthur Hill have been stressing in recent Market Messages. One has been that the rally from mid-March is a bear market rally. The other has been that the rally has probably ended. That dual reality...
READ MORE
MEMBERS ONLY

BIG JUMP IN UNEMPLOYMENT RATE SINKS MARKET -- DROP IN DOLLAR GIVES BIG BOOST TO COMMODITIES AS GOLD AND OIL SURGE -- BIGGEST STOCK LOSERS ARE AIRLINES, FINANCIALS, AND HOMEBUILDERS
by John Murphy,
Chief Technical Analyst, StockCharts.com
EURO SURGES AGAINST THE DOLLAR ... The Euro surged against the dollar yesterday on expectations for a European rate hike next month. The dollar is falling today because of the biggest jump in the U.S. unemployment rate in more than two decades (from 5% to 5.5%). Chart 1 shows...
READ MORE
MEMBERS ONLY

ECB RATE HIKE TALK BOOSTS OIL AND MOST OTHER COMMODITIES -- MARKET STILL HAS STRONG DAY -- WAL-MART HITS SIX-YEAR HIGH
by John Murphy,
Chief Technical Analyst, StockCharts.com
EURO SURGE BOOSTS COMMODITIES ... Today's report that the ECB may raise European rates next month to combat inflation pushed the Euro sharply higher today and the dollar lower. Chart 1 shows the Euro jumping 1% today and bouncing off its May low. That lit a spark under most...
READ MORE
MEMBERS ONLY

SMALL-CAPS LEADING LARGE-CAPS -- NASDAQ LEADING NY COMPOSITE -- DIA AND SPY ARE LAGGING -- SEMIS HOLDING STRONG -- AMD SURGES ON GOOD VOLUME
by John Murphy,
Chief Technical Analyst, StockCharts.com
A TALE OF TWO MARKETS... Today's Market Message was written by Arthur Hill. John Murphy will return tomorrow. - Editor
The stock market is split in many ways. Small-caps are leading large-caps and techs are leading non-techs. Put another way, large-caps are lagging small-caps...
READ MORE
MEMBERS ONLY

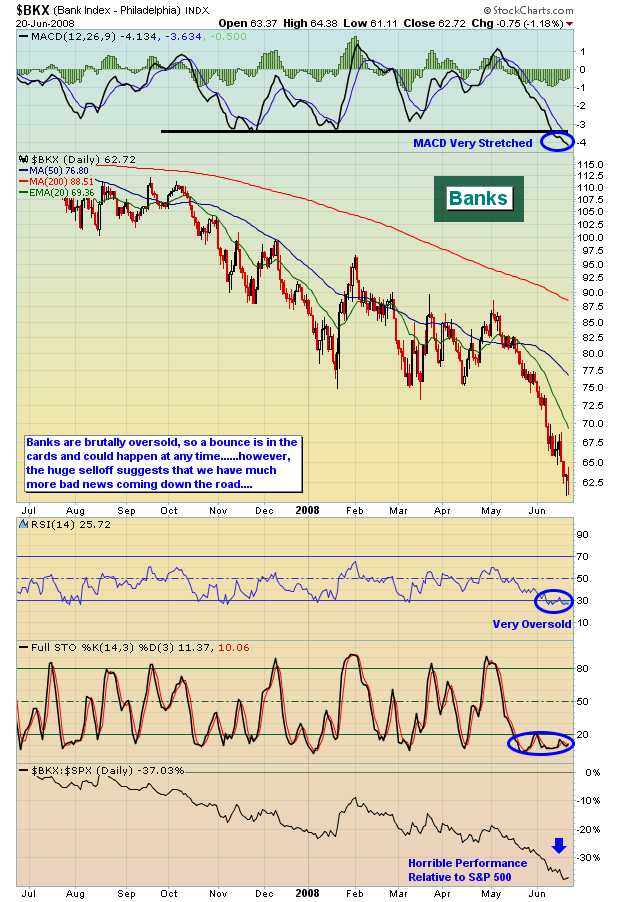
BANK INDEX HITS FIVE-YEAR LOW -- THE S&P 500 IS IN DANGER OF BREAKING 50-DAY AVERAGE -- BOND ETF BOUNCES OFF 200-DAY LINE
by John Murphy,
Chief Technical Analyst, StockCharts.com
BANK INDEX HITS FIVE-YEAR LOW... The market has suddenly taken a turn for the worse. I suspect part of the reason for the afternoon selling has to do with the fact that the PHLX Bank Index is on the verge of closing at a new five-year low. Chart...
READ MORE
MEMBERS ONLY

IT STILL LOOKS LIKE THE BEAR MARKET RALLY IS ENDING -- SHORT-TERM ROC LINES HAVE TURNED NEGATIVE -- LONG-TERM ROC SHOWS MARKET STILL IN BEAR MARKET -- VIX JUMPS 10% -- NASDAQ FAILS AT 200-DAY AVERAGE FOR SECOND TIME
by John Murphy,
Chief Technical Analyst, StockCharts.com
NASDAQ FAILS AGAIN AT 200-DAY LINE... The Nasdaq has been one of the strongest parts of the market during the recent rally. Today, however, it was the weakest. And it's coming at a bad time. Chart 1 shows the Nasdaq Composite failing for the second time in...
READ MORE
MEMBERS ONLY

OIL MARKET SUFFERS DOWNSIDE REVERSAL DAY -- RISING BOND YIELDS COINCIDE WITH GOLD DROP
by John Murphy,
Chief Technical Analyst, StockCharts.com
HEAVILY SELLING OF OVERBOUGHT OIL... Earlier today I wrote that energy was the only commodity group that hadn't yet entered into a downside correction. Today may be the day the oil correction finally started. Chart 1 shows the United States Oil Fund (USO) closing 3% lower after trading...
READ MORE
MEMBERS ONLY

BOND YIELDS HAVE BOTTOMED -- THAT'S BOOSTING THE DOLLAR AND PUSHING COMMODITIES LOWER -- THE IMPACT ON STOCKS IS LESS CLEAR
by John Murphy,
Chief Technical Analyst, StockCharts.com
BOND YIELDS BREAKOUT TO THE UPSIDE ... On May 13 and 15, I wrote about bond yields forming an apparent "double bottom" pattern and in the process of turning higher. To confirm that view, yields had to exceed their February highs. Charts 1 shows the 10-Year Treasury Note...
READ MORE
MEMBERS ONLY

BANKS KEEP BULLS IN CHECK -- INFORMATION TECHNOLOGY SECTOR OVERTAKES FINANCIAL SECTOR -- S&P 500 SECTOR WEIGHTINGS -- THE 200-DAY FLEXES ITS MUSCLE
by John Murphy,
Chief Technical Analyst, StockCharts.com
BANKS WEIGH ON MARKET... Today's Market Message was written by Arthur Hill. John Murphy will return tomorrow. - Editor
Banks kept the stock market in check on Wednesday as the Regional Bank HOLDRS (RKH) declined over 1%. Chart 1 shows RKH meeting resistance at the 200-day moving average...
READ MORE
MEMBERS ONLY

DROP IN OIL GIVES MARKET A BOOST -- WEEKLY AND MONTHLY INDICATORS, HOWEVER, REMAIN BEARISH
by John Murphy,
Chief Technical Analyst, StockCharts.com
S&P 500 BOUNCES OFF 50-DAY AVERAGE... A big drop in oil today gave the stock market a boost. A selloff in bond prices boosted bond yields and supported the dollar. That in turn contributed to profit-taking in commodities. Chart 1 shows the S&P 500...
READ MORE
MEMBERS ONLY

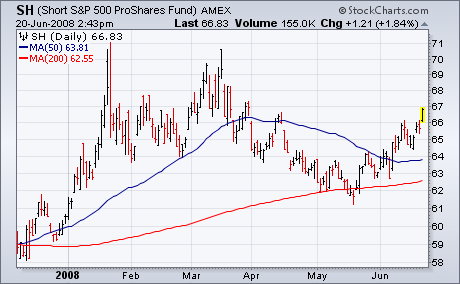
MARKET AVERAGES ROLL OVER ON BAD HOUSING NEWS -- BONDS RALLY AS DOLLAR WEAKENS -- VIX BOUNCES OFF SUPPORT -- BUYING BEAR FUND INSURANCE
by John Murphy,
Chief Technical Analyst, StockCharts.com
SHORT-TERM SELL SIGNALS ARE GIVEN ... The stock market is on the verge of suffering a downside weekly reversal at important resistance. After failing at its 200-day moving average, the S&P 500 has broken a two-month up trendline and is bearing down on its 50-day...
READ MORE
MEMBERS ONLY

UTILITIES ATTRACT NEW MONEY AS MARKET WEAKENS -- SO DO OTHER DEFENSIVE STOCKS LIKE ANHEUSER BUSCH AND BROWN-FORMAN -- MEDTRONIC SHOWS LEADERSHIP IN HEALTCHARE GROUP
by John Murphy,
Chief Technical Analyst, StockCharts.com
DEFENSIVE UTILITIES ATTRACT NEW MONEY... With the market showing every sign of rolling over this week, it's no surprise that three of the steadiest market sectors (outside of energy) have been consumer staples, healthcare, and utilities. Of those three, utilities have been the strongest. Chart 1 shows the...
READ MORE
MEMBERS ONLY

TECHNOLOGY, FINANCE AND CONSUMER DISCRETIONARY SECTORS WEIGH -- DOW FAILS AT 200-DAY -- A BAD START IN MAY -- LONG-TERM BREADTH INDICATOR HITS RESISTANCE -- INFLATION INDEXED BONDS SHOW RELATIVE STRENGTH
by John Murphy,
Chief Technical Analyst, StockCharts.com
KEY SECTORS LEAD BROAD DECLINE... Today's Market Message was written by Arthur Hill. John Murphy will return tomorrow. - Editor
The Dow lost over 200 points on Monday with major weakness coming from the Finance, Consumer Discretionary and Technology sectors. Finance represents the banks, brokers and insurers, which form...
READ MORE
MEMBERS ONLY

DOW TRANSPORTS ARE UP AGAINST OLD HIGHS -- TRUCKERS ALSO RUN INTO RESISTANCE IN BROADENING TOP FORMATION -- FINANCIALS LEAD MARKET SHARPLY LOWER IN WHAT COLD BE THE END OF TWO-MONTH RALLY -- HIGH APRIL PPI IS EVEN WORSE THAN REPORTED
by John Murphy,
Chief Technical Analyst, StockCharts.com
DOW TRANSPORTS TEST OLD HIGH... While the Dow Industrials are backing off from their 200-day moving average after recovering about half of their October/March decline (Chart 1), the Dow Transports are testing an important resistance barrier of their own. Chart 2 shows the Dow Transports testing their July...
READ MORE
