MEMBERS ONLY
WHERE ARE WE IN THE CYCLE?
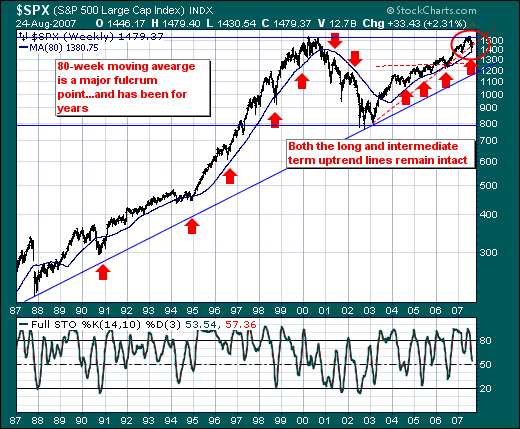
Given the volatility of the capital markets these past two weeks, we think it instructive to step back and take a longer-term viewpoint of the stock market to discern where we may be in the cycle. In doing so, we find the S&P 500 large caps - the...
READ MORE
MEMBERS ONLY
DATA FEED UPGRADE UPDATE
We are continuing to make progress in our efforts to get a second data feed into our offices. A second data feed should help us avoid the kind of problems we had several weeks back. Unfortunately, two things are conspiring to slow our progress: the phone companies and the stock...
READ MORE
MEMBERS ONLY
WHERE'S THE VOLUME?
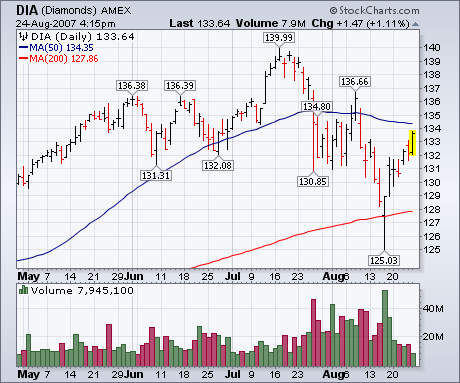
Friday's higher prices continued the market rally that started the previous Thursday. The three charts below show major market ETFs all back above their 200-day moving averages, which removes any immediate threat of a bear market. All have recovered more than half of their July/August decline,...
READ MORE
MEMBERS ONLY
DOW TECHNICALS TURNING POSITIVE, BUT...
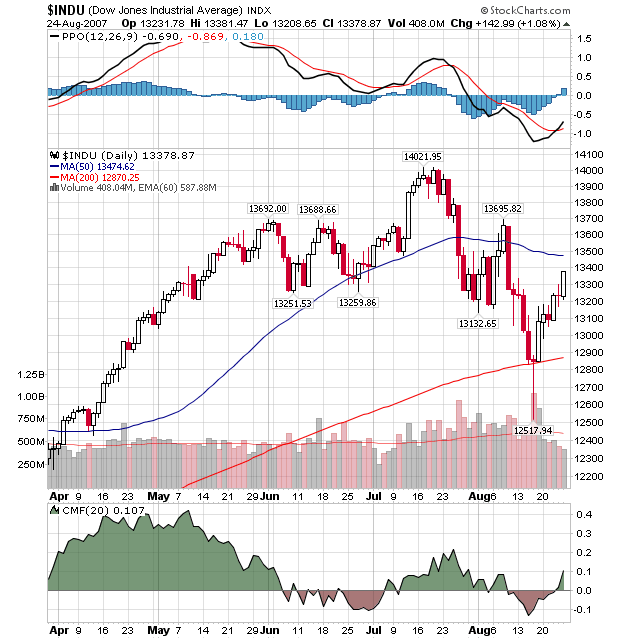
Last week, some significant positive technical developments occurred on our GalleryView chart of the Dow:
After recovering to remain above the 200-day moving the previous week (see the red candle whose shadow dipped all the way to 12,517?), the Dow has rebounded nicely with a nice string of...
READ MORE
MEMBERS ONLY

MARKET RALLY CONTINUES, BUT ON LOW VOLUME -- BOND YIELDS STAY FLAT WHILE T-BILL RATE JUMPS

by John Murphy,
Chief Technical Analyst, StockCharts.com
WHERE'S THE VOLUME... Friday's higher prices continued the market rally that started the previous Thursday. The three charts below show major market ETFs all back above their 200-day moving averages, which removes any immediate threat of a bear market. All have recovered more than half...
READ MORE
MEMBERS ONLY

GRAIN MARKETS LEAD AGRICULATURAL GROUP HIGHER -- GOLD HOLDS UP AS WELL -- OIL SERVICE HOLDERS LEAD ENERGY SECTOR HIGHER -- PULLBACK IN YEN HELPS MARKET -- BUT WHERE'S THE VOLUME
by John Murphy,
Chief Technical Analyst, StockCharts.com
AGRICULATURALS ARE STRONGEST OF COMMODITIES... Commodity markets have come under pressure along with stocks over the past month -- but not by equal amounts. The CRB Index lost -7% during the liquidity crisis. The hardest hit group was the economically-sensitive industrial metals which fell -15%. The energy group lost -8%...
READ MORE
MEMBERS ONLY

PULLBACK IN VOLATILITY INDEX SUPPORTS SHORT-TERM MARKET BOUNCE -- S&P 500 CLOSES BACK ABOVE 200-DAY AVERAGE, BUT VOLUME IS LIGHT -- FINANCIALS AND SMALL CAPS STILL NEED TO CLEAR THEIR AUGUST HIGHS
by John Murphy,
Chief Technical Analyst, StockCharts.com
VIX INDEX IS PULLING BACK... True to its history of trending in the opposite direction of stocks, the CBOE Volatility (VIX) Index continues to weaken after hitting a four-year high last Thursday (when the market bottomed). Chart 1 shows the VIX falling back to 23 and testing a short-...
READ MORE
MEMBERS ONLY

INTEREST RATES FELL WITH STOCKS IN 1998 AND 1987, BUT THEN BOTTOMED WITH THEM AS WELL -- THE INABILITY OF BOND YIELDS TO BOUNCE IN 2000 LED TO MUCH BIGGER STOCK LOSSES -- RIGHT NOW, BOND YIELDS AREN'T BOUNCING WITH STOCKS
by John Murphy,
Chief Technical Analyst, StockCharts.com
POSSIBLE LINK BETWEEN RATES AND STOCKS ... When volatility rises, asset classes become highly correlated. That's especially true with bonds and stocks. I'm referring here to bond "yields" instead of prices. Chart 1 shows that the 10-year T-Note yield (green line) and the...
READ MORE
MEMBERS ONLY

FOREIGN STOCK MARKETS LOOK EVEN WEAKER THAN THE U.S. -- IF THAT'S THE CASE, HOW ARE THEY GOING TO SUPPORT THE U.S. MARKET -- COMPARISON OF 2007 AND 1998 SUMMER PEAKS -- DETERMINING HOW LONG A RIGHT SHOULDER SHOULD LAST
by John Murphy,
Chief Technical Analyst, StockCharts.com
MAYBE GLOBAL GROWTH ISN'T THAT STRONG ... One of the mantras we keep hearing on TV is that strong global markets and economies will prevent the U.S. economy (and stock market) from suffering a serious slowdown. Since I happen to be of the belief that stock markets are...
READ MORE
MEMBERS ONLY

IT'S NOT CLEAR IF THIS WEEK'S BOUNCE IS THE BEGINNING OF THE END OF THE MARKET CORRECTION OR THE END OF THE BEGINNING OF A BEAR MARKET -- WHY THE CURRENT REBOUND COULD BE PART OF A HEAD AND SHOULDERS TOPPING PATTERN
by John Murphy,
Chief Technical Analyst, StockCharts.com
MARKET BOUNCES OFF IMPORTANT CHART SUPPORT ... Yesterday I showed the S&P 500 bouncing off its March low (after correcting 10%) and also the 400-day moving average (green line) which has ended every downside correction since the bull market started more than four years ago. I also pointed...
READ MORE
MEMBERS ONLY

COMMODITY MARKETS TUMBLE ON GLOBAL STOCK SELLING -- REBOUND IN FINANCIALS, HOWEVER, STEADIES MARKET IN AFTERNOON -- OVERSOLD S&P 500 BOUNCES OFF ITS MARCH LOW SUGGESTING THE WORST MAY BE OVER FOR NOW
by John Murphy,
Chief Technical Analyst, StockCharts.com
CRB INDEX TUMBLES ... The global stock rout spilled over to the commodity pits. The CRB Index fell 10 points to close well under its 200-day average (Chart 1). Several newswires suggested that investors were selling commodities to finance stock losses. Earlier today, I showed sizeable losses in copper and...
READ MORE
MEMBERS ONLY

RISING YEN IS ACTUALLY HELPING THE DOLLAR WHILE HURTING FOREIGN CURRENCIES -- AUSTRALIAN DOLLAR PLUNGES 5% -- GOLD AND GOLD SHARES ARE BEING SOLD ALONG WITH OTHER COMMODITIES -- S&P 500 REACHES 10% CORRECTION AND APPEARS HEADED FOR TEST OF MARCH LOW
by John Murphy,
Chief Technical Analyst, StockCharts.com
GOLD SUCCUMBS TO SELLING PRESSURE... My optimism on gold as a potential safe haven is being severely challenged today. Gold shares are being hit especially hard. Chart 1 shows the XAU Index falling more than 5% and falling to a new 2007 low. Earlier in the week I suggested the...
READ MORE
MEMBERS ONLY

DOW TRANSPORTS AND DOW INDUSTRIALS BREAK SUPPORT -- TREND IDENTIFICATION -- PRIOR DOW THEORY BUY SIGNAL -- CURRENT DOW THEORY STATUS -- LOOKING OUTSIDE DOW THEORY FOR CONFIRMATION -- BREADTH REMAINS WEAK
by John Murphy,
Chief Technical Analyst, StockCharts.com
DOW THEORY REVIEW... Today's Market Message was written by Arthur Hill. John Murphy will be back tomorrow. - Editor
Today I would like to review Dow Theory and look at the current signal. The "Dow Theory" evolved from the writings of Charles Dow at the turn of...
READ MORE
MEMBERS ONLY

MARKET HAS ANOTHER BAD DAY AS 200-DAY AVERAGES ARE BROKEN -- RETAILERS AND HOMEBUILDERS LEAD DAY'S DECLINE -- YEN RALLY THREATENS CARRY TRADE --
by John Murphy,
Chief Technical Analyst, StockCharts.com
RETAILERS LEAD DAY'S DECLINE ... Spooked by tumbles in big retail chains like Wal Mart and Home Depot, retail stocks fell -3.5% today and led the rest of the market lower. Other big losers were homebuilders (-4%) and REITS (-3%). Heavy selling in homebuilders and retailers made Consumer...
READ MORE
MEMBERS ONLY

WAL MART AND HOME DEPOT PLUNGE ON WEAK HOUSING AND HIGH ENERGY PRICES -- THAT'S WHY IT'S DANGEROUS TO EXCLUDE ENERGY FROM INFLATION -- COLLAPSE IN CONSUMER DISCRETIONARY SECTOR HINTS AT WEAKER CONSUMER SPENDING
by John Murphy,
Chief Technical Analyst, StockCharts.com
PRODUCER INFLATION WAS UP -- NOT DOWN AS REPORTED ... One of the major newswires reported this morning that inflation at the producer level came in lower than expected during July. The article was referring to the "core inflation" number (excluding food and energy) which was 0.1% (lower than...
READ MORE
MEMBERS ONLY

SECTOR ROTATION MODEL SHOWS THAT STOCK MARKET IS LEADING INDICATOR FOR THE ECONOMY -- WHY RECENT SECTOR ROTATIONS MAY CARRY A WARNING -- MARKET'S RALLY ATTEMPT FADES AS 200-DAY LINE REMAINS THREATENED
by John Murphy,
Chief Technical Analyst, StockCharts.com
STOCKS LEAD THE ECONOMY... Over the weekend, I explained why we can't use the economy to predict the stock market. Because stocks turn down six to nine months before the economy. That doesn't mean that every market downturn leads to an economic slowdown or recession. That&...
READ MORE
MEMBERS ONLY

SHORT-TERM MARKET TREND MAY BE STABILIZING -- BUT LONG-TERM TREND MAY BE WEAKENING -- WHY ECONOMISTS SHOULDN'T BE ASKED ABOUT THE STOCK MARKET
by John Murphy,
Chief Technical Analyst, StockCharts.com
GLOBAL STOCKS ARE TESTING 200-DAY AVERAGES... With the all recent market turmoil, it's important not to lose sight of the big picture. We all know by now that the stock market has suffered a sharp downturn over the last month on record volume. And we all know...
READ MORE
MEMBERS ONLY

MARKET BOUNCE ENDS IN DECISIVE FASHION -- NEXT DOWNLEG APPEARS TO HAVE STARTED -- WHY WATCHING CABLE TV ISN'T GOOD FOR YOUR WEALTH
by John Murphy,
Chief Technical Analyst, StockCharts.com
RESISTANCE KICKS IN... Over the past week, I've been plotting Fibonacci retracement lines over the major stock indexes to show where potential resistance levels (renewed selling) could be expected. A normal short-term bounce usually carries anywhere from a third (38%) to half (50%) of the previous downturn....
READ MORE
MEMBERS ONLY

FINANCIALS AND RETAILERS LEAD MARKET DECLINE AS MORE SUBPRIME PROBLEMS ARISE
by John Murphy,
Chief Technical Analyst, StockCharts.com
BANKS AND BROKERS ARE BIGGEST LOSERS... More subprime problems emerging from Europe have caused heaving selling in stocks around the world. Most of that scared money is contining to flow into Treasury Bonds which are up today. As has been the case recently on down days, financial stocks are the...
READ MORE
MEMBERS ONLY

SMALL-CAPS VERSUS BIG TECHS -- RUSSELL 2000 GETS OVERSOLD BOUNCE -- NASDAQ 100 MAINTAINS UPTREND -- CISCO POWERS BIG TECHS -- THE SUB-PRIME PROGRESSION -- REITS AND HOMEBUILDERS SURGE -- TARGETS FOR OVERSOLD BOUNCES
by John Murphy,
Chief Technical Analyst, StockCharts.com
A TALE OF TWO MARKETS ... Today's Market Message was written by Arthur Hill. John Murphy will be back tomorrow. - Editor
Stocks rebounded over the last three days, but these rebounds need to be considered in the context of prior price action. While the advance in the Russell 2000...
READ MORE
MEMBERS ONLY

CONSUMER STAPLES WERE MONTH'S TOP SECTOR -- CONSUMER STAPLE LEADERS -- S&P 500 BULLISH PERCENT INDEX TESTS IMPORTANT CHART SUPPORT -- S&P 500 REGAINS ITS 200-DAY LINE -- FINANCIAL REBOUND STILL HAS A LONG WAY TO GO TO REPAIR RECENT CHART DAMAGE
by John Murphy,
Chief Technical Analyst, StockCharts.com
CONSUMER STAPLES MONTH'S TOP SECTOR... As usually happens when the stock market sells off sharply, money tends to flow to stocks with defensive characteristics. These are stocks that usually fall less during a market downturn -- and, hopefully, even gain ground while the rest of the market drops. The...
READ MORE
MEMBERS ONLY
BULL/BEAR BATTLE THIS WEEK
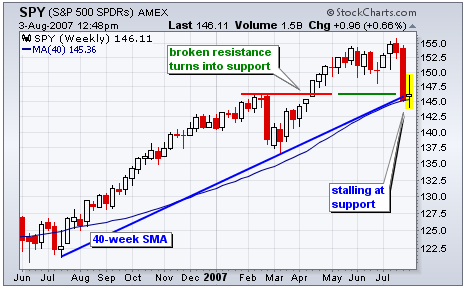
The S&P 500 ETF (SPY) firmed this week and found some support. The ETF hit support from the 40-week moving average and broken resistance. The 40-week moving average is equivalent to the 200-day moving average and this level is important to the long-term trend....
READ MORE
MEMBERS ONLY
MARKET OVERSOLD AND DANGEROUS
A month ago I wrote an article stating that I thought that the 20-Week Cycle was cresting and that we should expect a decline into the cycle trough that would probably break down through the support provided by the bottom of the trading channel, setting up a bear trap....
READ MORE
MEMBERS ONLY
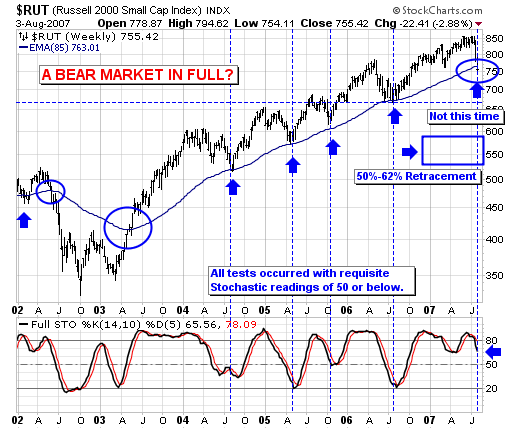
A BEAR MARKET IN FULL?
Last week was a treacherous week indeed, with stock prices falling universally. That said, one of the "weakest indices" was related to the US small cap arena, and specifically to the Russell 2000 Index ($RUT). In the past, RUT led the market higher, but that changed last year...
READ MORE
MEMBERS ONLY
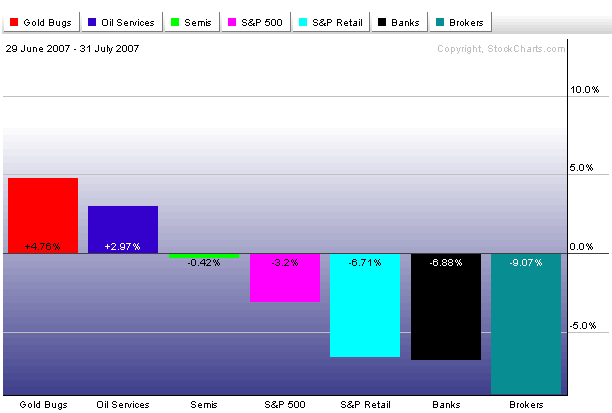
JULY PERFORMANCE FIGURES CARRY A MESSAGE
The chart above shows "John's Latest Performance Chart" that reflects the market's stronger and weaker groups during the hightly volatile month of July. All are plotted around the S&P 500 which lost 3.2% during July. [The S&P can also...
READ MORE
MEMBERS ONLY

THE BATTLE OF 13,200
The troops are mustered. The swords are out. The orders have been posted. The pieces are in place. The die has been cast. (The metaphors are getting lame.
) However you want to say it, the battle line for the Bulls and the Bears has been drawn. Can you spot it...
READ MORE
MEMBERS ONLY

USING PERFORMANCE CHARTS TO FIND GROUP LEADERS AND LAGGARDS -- WHY RECENT PREFERENCE FOR BLUE CHIPS ISN'T A GOOD SIGN -- WEAK JOBS REPORT PUSHES DOLLAR AND BOND YIELDS LOWER - BONDS AND GOLD ARE DAY'S WINNERS AS STOCKS DROP
by John Murphy,
Chief Technical Analyst, StockCharts.com
JOHN'S LATEST PERFORMANCE CHART... Each week I post a performance chart under the headline shown above. It can be found on the John Murphy page. I usually show which market sectors, or industry group, are doing better than the S&P 500 (which is the industry benchmark...
READ MORE
MEMBERS ONLY

A COMPARISON OF GOLD AND STOCKS -- GOLD HAS BEEN THE STRONGER ASSET SINCE 2000 -- NOT ALL FUNDAMENTALS ARE BULLISH -- SHORT-TERM MARKET REBOUND CONTINUES -- BUT DAILY AND WEEKLY INDICATORS AREN'T IN SYNC
by John Murphy,
Chief Technical Analyst, StockCharts.com
SHORT-TERM VIEW... I've received a large number of questions as to how gold holds up when stocks fall. What makes a firm answer to that difficult is that gold and stocks often trend together over the short run. Gold has also shown a tendency to correct along...
READ MORE
MEMBERS ONLY

SPY FIRMS AFTER BIG DOWN WEEK -- TECHNOLOGY STILL SHOWING RELATIVE STRENGTH -- CONSUMER DISCRETIONARY BREAKS MARCH LOW -- CISCO MAINTAINS BREAKOUT -- NIKKEI LEADS LOWER -- RISING YEN WEIGHS ON NIKKEI -- OIH TESTS 50-DAY -- VOLUME BASED INDICATORS
by John Murphy,
Chief Technical Analyst, StockCharts.com
SPY BATTLES 40-WEEK MOVING AVERAGE ... Today's Market Message was written by Arthur Hill. John Murphy will be back tomorrow. - Editor
The S&P 500 ETF (SPY) is trying to firm this week and find support. The ETF declined sharply last week on record weekly volume (over...
READ MORE
MEMBERS ONLY

AUGUST AND SEPTEMBER ARE USUALLY WEAK MONTHS -- THAT WOULD BE A LOGICAL TIME FOR MARKET CORRECTION TO RESUME -- CLARIFYING MOVING AVERAGE LINES AND SIGNALS-- MARKET RALLY FADES AS 50-DAY AVERAGES BECOME NEW RESISTANCE
by John Murphy,
Chief Technical Analyst, StockCharts.com
AUGUST THROUGH OCTOBER IS MOST DANGEROUS TIME... In my weekend analysis, I closed with the comment that I thought the market could suffer a 10% correction "between now and the autumn". I chose that time period for a very good reason. By the end of July, any summer...
READ MORE
MEMBERS ONLY

REASONS WHY THIS MARKET CORRECTION MAY BE BIGGER THAN PREVIOUS ONES
by John Murphy,
Chief Technical Analyst, StockCharts.com
FIRST A SURVEY OF THE WEEK'S DAMAGE... It was the market's worst week since the bull market began more than four years ago -- both in terms of percentage losses, downside volume, and bad breadth. All market sectors and industry groups fell. Every single market index closed...
READ MORE
MEMBERS ONLY

MARKET FALLS AGAIN ON FRIDAY -- S&P 500 IS HEADED FOR TEST OF 200-DAY AVERAGE -- VIX HITS HIGHEST LEVEL SINCE BULL MARKET BEGAN IN 2003 -- THAT SUGGESTS THAT THIS CORRECTION COULD BE BIGGER THAN PREVIOUS ONES -- EXPECT SATURDAY MESSAGE
by John Murphy,
Chief Technical Analyst, StockCharts.com
S&P 500 HEADED FOR TEST OF 200-DAY LINE... The stock market had another bad day on Friday as all major stock indexes closed below Thurday's intra-day lows (and again on heavy volume). The first three charts show the week's technical damage done...
READ MORE
MEMBERS ONLY

HOMEBUILDING CHARTS SUGGESTS HOUSING SITUATION IS GOING TO GET A LOT WORSE -- DR HORTON AND LENNAR BREAK NECKLINES IN MAJOR HEAD AND SHOULDER TOPS -- VIX HITS NEW 2007 HIGH -- RISING YEN THREATENS GLOBAL RALLY
by John Murphy,
Chief Technical Analyst, StockCharts.com
HOUSING SECTOR CONTINUES TO WEAKEN ... I've suggested for some time that those calling for a housing bottom look at the long-term chart of homebuilders. If they had, they wouldn't be as surprised as they seem to be. [That includes the heads of the Fed and...
READ MORE
MEMBERS ONLY

MARKET CONTINUES TO FALL ON BAD BREADTH -- NYSE INDEX BREAKS JUNE LOW -- DOW AND NASDAQ UNDERCUT 50-DAY AVERAGES -- RUSSELL 2000 SMALL CAP INDEX TRADES BELOW 200-DAY LINE -- WEAKEST GROUPS ARE AIRLINES BROKERS, AND HOMEBUILDERS
by John Murphy,
Chief Technical Analyst, StockCharts.com
SUPPORT LEVELS ARE BEING BROKEN... The market continues to drop on very bad breadth. Losers on the big board are swamping gainers by a 10 to 1 ratio. The same is true of downside volume versus upside volume. [The NYSE AD line hit a three-month low on Tuesday]. The...
READ MORE
MEMBERS ONLY

VALUE STOCKS DRAG DOWN RUSSELL 2000 -- XLU BREAKS FLAG SUPPORT-- NEW LOWS EXPAND ON NYSE AND NASDAQ -- US DOLLAR INDEX HAS A BIG DAY -- GOLD DECLINES ON DOLLAR STRENGTH -- APPLIED MATERIALS REMAINS STRONG -- RF MICRO DEVICES GAPS HIGHER
by John Murphy,
Chief Technical Analyst, StockCharts.com
VALUE LEADING THE WAY DOWN... Today's Market Message was written by Arthur Hill. John Murphy will be back tomorrow. - Editor
The Russell 2000 broke below its June lows this week and this break can be attributed to the "value" components. The Russell 2000 can be divided...
READ MORE
MEMBERS ONLY

MARKET FALLS HARD ON BAD BREADTH AND HEAVY VOLUME -- NYSE ADVANCE-LINE TURNS DOWN -- FINANCIALS AND SMALL CAPS LEAD THE WAY -- THE S&P 500 BREAKS ITS 50-DAY AVERAGE
by John Murphy,
Chief Technical Analyst, StockCharts.com
FINANCIALS AND SMALL CAPS LED THE WAY ... Earlier today I showed heavy selling in the Russell 2000 iShares (IWM) and the Financials Select Sector SPDR (XLF). [Please see Market Message posted earlier today]. Unfortunately, things got worse as the day progressed. Chart 1 shows the IWM closing 2.8% lower...
READ MORE
MEMBERS ONLY

FINANCIAL STOCKS APPROACH TEST OF MAJOR SUPPORT -- SMALL CAPS CONTINUE TO WEAKEN ALONG WITH MARKET BREADTH -- THE 13-AND 34-DAY EMA COMBINATION SHOWS S&P TREND STILL UP BUT STARTING TO WEAKEN
by John Murphy,
Chief Technical Analyst, StockCharts.com
FINANCIAL SPDR NEARS TEST OF SPRING LOW ... One of our readers asked me recently if the daily chart of the Financials SPDR looked like a bullish "triangle" or a bearish "double top". This week's downside action has pretty much ruled out the "triangle&...
READ MORE
MEMBERS ONLY
DON'T IGNORE HISTORY
We discuss so many different technical scenarios that sometimes we lose sight of what history has taught us. It's time to pause for a bit after a very nice rally in the equity markets and see what history has to say. For purposes of this discussion, all numbers...
READ MORE
MEMBERS ONLY
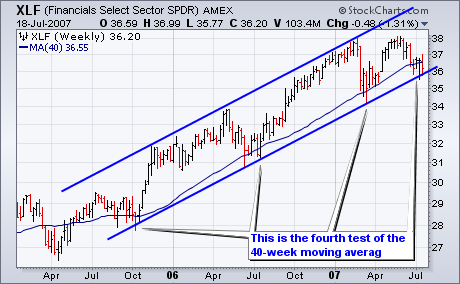
THE MOMENT-OF-TRUTH FOR FINANCE
Despite a sharp decline over the last six weeks, the Finance SPDR (XLF) remains in a long-term uptrend on the weekly chart and support is at hand. The Finance SPDR (XLF) met resistance at 38 twice this year and declined to around 36-36.5 in June and July....
READ MORE
MEMBERS ONLY
GOLD: LONG-TERM PICTURE LOOKING SHAKEY
On Thursday our trend model for gold switched to a buy, which means our medium-term posture is bullish on gold; however, when I looked at a very long-term chart of gold I saw something that gave me a slightly queasy feeling. What I saw was that gold is...
READ MORE
