MEMBERS ONLY
KEY SECTORS SHOW RELATIVE WEAKNESS
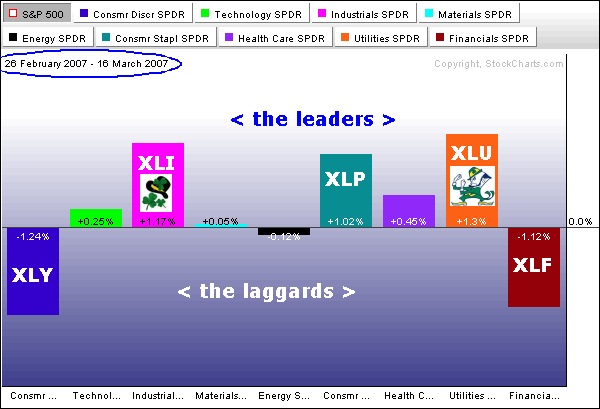
The sector rotations since 26-Feb reflect a defensive and nervous market. Things started changing on Wall Street with the sharp decline on 27-Feb and the PerfChart below shows sector performance since this decline. The Utility SPDR (XLU), the Industrials SPDR (XLI) and the Consumer Staples SPDR (XLP) are...
READ MORE
MEMBERS ONLY
ARE WE BEAR YET?
One of my colleagues has been harassing me (in a friendly way) for not yet having declared myself a bear. The truth is that top picking is a treacherous business, and I have given it up in favor of letting trend models make my declarations for me. For example, I...
READ MORE
MEMBERS ONLY
REVIEWING THE "YEN-CARRY TRADE"
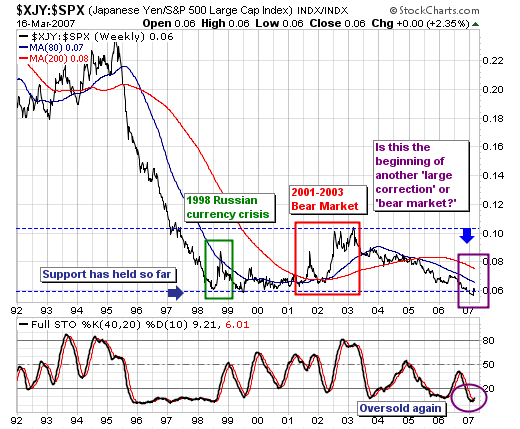
The recent focus of the equity markets is upon the "sub-prime" mortgage problem; and upon the "yen-carry trade". We think both are valid concerns; however, the question of the "yen-carry trade" is more important in our mind than the "sub-...
READ MORE
MEMBERS ONLY
FINANCIALS HOLD THE KEY TO THE MARKET
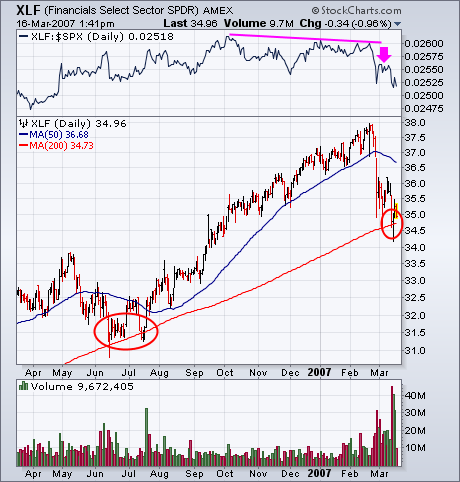
It's no secret that one of the main problems pulling the market down over the last month has been the fallout from subprime mortages. It's also no surprise to read that financial stocks (mainly banks and brokers) have been the weakest part of the market over...
READ MORE
MEMBERS ONLY
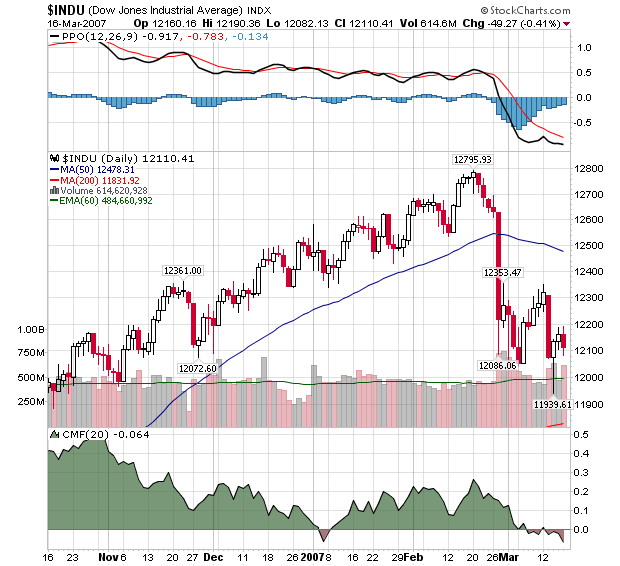
MARKET'S FIRST RECOVERY ATTEMPT FAILS
Hello Fellow Chartwatchers!
Last week's recovery rally was crushed by Tuesday's big decline and while the Dow quickly rose back above 12,000, the technical damage was done. The chart below shows the important technical developments for the Dow in recent days. See if you can...
READ MORE
MEMBERS ONLY

SOME CONSUMER STAPLE AND ENERGY LEADERS -- HOW TO BENEFIT FROM FALLING DOLLAR -- FINANCIALS TEST LONG-TERM SUPPORT -- P&F TRENDS ARE STILL DOWN

by John Murphy,
Chief Technical Analyst, StockCharts.com
CONSUMER STAPLES DOING RELATIVELY WELL... Last Friday I wrote about new signs of relative strength in the consumer staples sector. When I refer to relative strength, I mean how a group is doing relative to the S&P 500. That doesn't necessarily mean that a group is...
READ MORE
MEMBERS ONLY

GOLD IS TESTING SUPPORT LINE, BUT IS STILL BEING EFFECTED BY THE YEN -- RISING COPPER BOOSTS FREEPORT MCMORAN COPPER & GOLD
by John Murphy,
Chief Technical Analyst, StockCharts.com
GOLD STILL TESTING SUPPORT LINE ... I got an unusually large number of questions on the gold market. Actually, very little has changed since the last time we looked at it. Chart 1 shows the streetTracks Gold Trust Shares (GLD) still testing an uptrend line drawn under its October/January lows....
READ MORE
MEMBERS ONLY

NASDAQ TESTS EARLY MARCH LOW - RUSSELL 2000 RECOVERS AFTER SUPPORT BREAK - QUALCOM GAPS HIGHER- APPLE SHOWS RELATIVE STRENGTH - ORACLE CAUGHT IN MOVING AVERAGE SANDWICH - ENERGY ETF'S SURGE ON GOOD VOLUME -- SCHLUMBER FORMS P&F TRIPLE TOP
by John Murphy,
Chief Technical Analyst, StockCharts.com
TESTING THE EARLY MARCH LOWS... Today's Market Message was written by Arthur Hill. John Murphy will be back tomorrow. - Editor
The major indices moved lower in early trading, but recovered in the afternoon and closed strong. Tuesday's decline marked a test of the early March lows...
READ MORE
MEMBERS ONLY

REPLAY OF LATE FEBRUARY -- BANKS, BROKERS, AND HOMEBUILDERS LEAD STOCK SELLOFF ON SUBPRIME CONCERNS -- MARKET MAY BE STARTING SECOND DOWNLEG AS VOLATILITY SURGES
by John Murphy,
Chief Technical Analyst, StockCharts.com
MORE OF THE SAME ... I posted a market message earlier today to the effect that the same global intermarket problems that started exactly two weeks ago are re-surfacing. The sequence includes falling Chinese stocks, falling emerging markets, falling global stocks, a flight to safety into Treasury bonds, buying of...
READ MORE
MEMBERS ONLY

BANKS AND BROKERS PULL MARKET LOWER AS MORTGAGE CONCERNS GROW -- HOMEBUILDERS ARE ALSO FALLING HARD -- SHORT TERM MARKET BOUNCE APPEARS TO HAVE ENDED
by John Murphy,
Chief Technical Analyst, StockCharts.com
SUBPRIME MORTAGE CONCERNS SPREAD ... To no one's surprise outside of Wall Street (and the Fed), subprime mortgage concerns continue to spread to financial shares and the rest of the market. Brokers are down more than 3% today and are threatening their 200-day average (Chart 1). Another downleg...
READ MORE
MEMBERS ONLY

CONSUMER STAPLE LEADERS INCLUDE COORS, HERSHEY, AND KELLOGG -- WHY CONSUMER STAPLE LEADERSHIP ISN'T A GOOD SIGN FOR THE MARKET
by John Murphy,
Chief Technical Analyst, StockCharts.com
CONSUMER STAPLES ARE HOLDING UP RELATIVELY WELL ... One of the well-known market maxims is that consumer staples generally hold up better than the rest of the market in a market downturn. That has certainly been the case recently. Not the consumer staples haven't lost money over the...
READ MORE
MEMBERS ONLY

MARKET CONTINUES LOW-VOLUME BOUNCE -- EMERGING MARKET ISHARES BOUNCE TO 50-DAY LINE -- THAT'S AN IMPORTANT TEST OF RALLY'S STRENGTH
by John Murphy,
Chief Technical Analyst, StockCharts.com
NOT A VERY IMPRESSIVE BOUNCE ... The market continued its low-volume bounce today. Light volume during a price bounce betrays a lack of bullish enthusiasm and doesn't inspire much confidence that the current bounce is anything more than a reflex rally from an oversold condition. The market also...
READ MORE
MEMBERS ONLY

STOCKS CLOSE WEAK -- NASDAQ STAYS OVERSOLD -- ENERGY STOCKS SHOW SOME STRENGTH -- CONOCOPHILIPS AND BJ SERVICES LEAD -- SURGE IN OIL FUELS ENERGY GROUP -- AIRLINES GROUNDED WITH RISING OIL PRICES
by John Murphy,
Chief Technical Analyst, StockCharts.com
LATE SELLING PUSHES STOCKS LOWER... Today's Market Message was written by Arthur Hill. John Murphy will be back tomorrow. - Editor
A wave of selling pressure hit the market this afternoon and the major indices closed lower. Even though the declines were modest, the inability to hold gains shows...
READ MORE
MEMBERS ONLY

NYSE BULLISH PERCENT INDEX TURNS DOWN -- SO DOES SHORT-TERM MOVING AVERAGE SYSTEM -- MARKET STARTS OVERSOLD BOUNCE -- COMPARING DAILY AND WEEKLY SIGNALS FOR GUIDANCE
by John Murphy,
Chief Technical Analyst, StockCharts.com
NYSE BULLISH % INDEX TURNS DOWN ... One of our readers asked for an update on the NYSE Bullish Percent Index. The BPI represents the number of stocks in an index that are on point & figure buy signals. Readings over 70 are considered overbought. Drops below 70 are usually associated with...
READ MORE
MEMBERS ONLY

MORTGAGE CONCERNS CONTINUE TO PLAGUE MARKET -- BROKERS AND REITS LEAD DECLINE -- RISING YEN HELPS EXPLAIN GOLD DROP -- DOW AND S&P 500 ARE HEADED TOWARD 200-DAY AVERAGES
by John Murphy,
Chief Technical Analyst, StockCharts.com
MORTAGE SITUATION WORSENS... Since the market meltdown started last week, the economic community (aided by a willing TV media) keeps telling us that the subprime mortage problems are relatively limited and shouldn't impact on the economy or the stock market. And each day everything tied to housing and...
READ MORE
MEMBERS ONLY
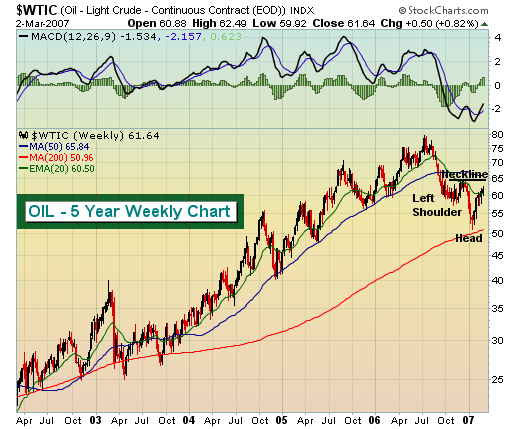
ENERGY - A BULLISH VIEW
We have been in the bearish camp on energy and over the past several months and for now remain on the bearish side. But anytime you take a position on the bullish or bearish side, you need to realize patterns that could change your view. The price of oil broke...
READ MORE
MEMBERS ONLY
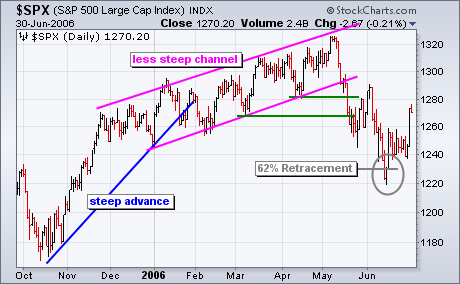
CORRECTION AHEAD FOR S&P 500?
The current breakdown in the S&P 500 looks quite similar to the May-June 2006 breakdown. Let's look at the May-June 2006 break down first. The S&P 500 surged from mid October to mid December (2005) and then began a slower zigzag higher...
READ MORE
MEMBERS ONLY
UPDATED CRASH ANALYSIS
In light of this week's sharp decline (mini-crash?), the most obvious subject for discussion in this week's article is to question whether or not we are on the verge of another major crash. In my 12/8/2006 article, Crash Talk Is Premature, I stated:...
READ MORE
MEMBERS ONLY
RECENT DECLINE MORE THAN JUST A CORRECTION?
Last week's market decline was quite interesting from a number of perspectives. First, the decline clearly mirrors the movement in Japanese Yen as the "carry-trade" is unwound; if one watches these closely, one will see that stock traders are cleary focused on the yen. We...
READ MORE
MEMBERS ONLY
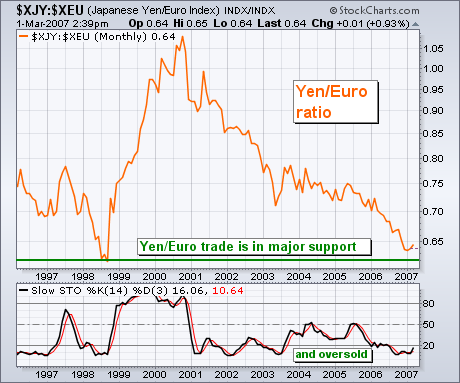
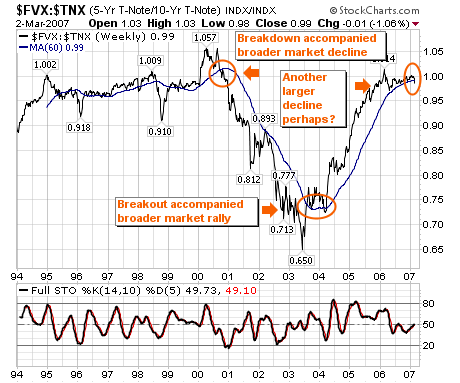
YEN/EURO IS IN MAJOR SUPPORT AREA AND OVERSOLD
Our main concern here is the relationship between the world's strongest currencies and the Japanese yen. Since 2000, the world's strongest currency has been the Euro (followed by the Swiss Franc, Canadian and Aussie Dollars, and the British Pound. The yen has been the weakest global...
READ MORE
MEMBERS ONLY
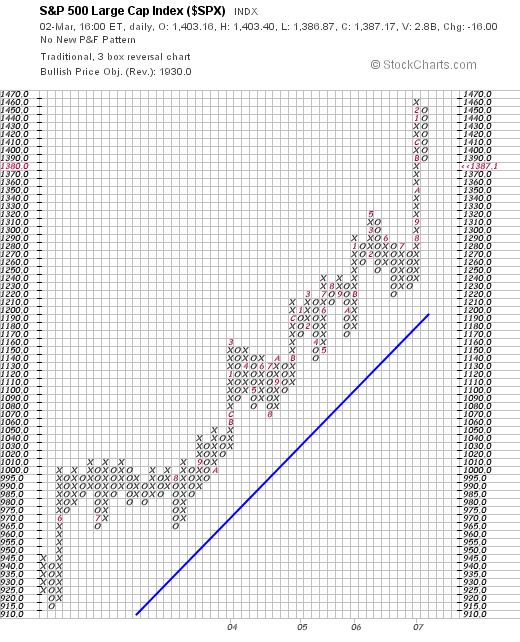
P&F CHARTS PROVIDE PERSPECTIVE
Hello Fellow Chartwatchers!
This week's market gyrations have caused many people to stop and question the market's current position - sometimes quite emotionally. In times like this I like to go back to basics and look at some of the most impartial charts out there - Point and...
READ MORE
MEMBERS ONLY

CHINA LEADS GLOBAL STOCK DECLINE AS BONDS AND THE YEN RISE -- STOCKS APPEAR HEADED FOR FIRST 10% CORRECTION IN FOUR YEARS
by John Murphy,
Chief Technical Analyst, StockCharts.com
BONDS SURGE AS GLOBAL STOCKS FALL... A plunge in Chinese stocks started the sharpest global stock downturn in four years. Emerging markets lost 8% on the week while foreign stocks in general fell 5.6%. By contrast, the U.S. lost a little over 4%. The hardest hit market sector...
READ MORE
MEMBERS ONLY

WHY RISING YEN POSES A GLOBAL THREAT -- UNWINDING THE CARRY TRADE -- SHORT-TERM OVERSOLD CONDITION STABILIZES US MARKET --BUT DOWNSIDE RISK STILL REMAINS
by John Murphy,
Chief Technical Analyst, StockCharts.com
YEN RALLIES AGAINST ALL MAJOR CURRENCIES ... In the middle of Tuesday's global selloff, I showed bond prices rising as stocks were selling off. I mentioned that falling U.S. yields were hurting the U.S. Dollar, especially against the Japanese yen which had rallied to a new six-...
READ MORE
MEMBERS ONLY

MAJOR INDEX ETFS FIND SUPPORT -- MOMENTUM TURNS BEARISH FOR SPX -- ANALYZING A PRIOR CORRECTION -- SPX SUPPORT AND TARGETS -- SPRINT-NEXTEL BOUNCES BACK -- STEEL STOCKS SHOW STRENGTH
by John Murphy,
Chief Technical Analyst, StockCharts.com
STOCKS FIRM AFTER BIG DECLINE... Today's Market Message was written by Arthur Hill. John Murphy will be back tomorrow. - Editor
A day after the biggest decline in years, the S&P 500 ETF (SPY), Nasdaq 100 ETF (QQQQ) and Russell 2000 ETF (IWM) firmed on Wednesday. SPY...
READ MORE
MEMBERS ONLY

MARKET HAS WORST DAY IN YEARS -- VIX SOARS 60% -- PUT/CALL RATIO HITS FOUR-YEAR HIGH -- WEEKLY MACD LINES TURN NEGATIVE
by John Murphy,
Chief Technical Analyst, StockCharts.com
VOLATILITY INDEX SURGES ON PUT BUYING ... When investors get nervous about the stock market, they buy puts. That negative sentiment is reflected in rising volatility indexes. And the two most closely watched volatility indexes soared today as the market fell heavily. Chart 1 shows the CBOE Volatility (VIX) Index soaring...
READ MORE
MEMBERS ONLY

PLUNGE IN CHINA CAUSES GLOBAL SELLOFF AND MOVE INTO TREASURIES -- DOW AND S&P 500 ARE TRADING BELOW 50-DAY AVERAGES
by John Murphy,
Chief Technical Analyst, StockCharts.com
CHINA PLUNGE PUNISHES EMERGING MARKETS ... A 9% plunge in the Chinese stock market has caused a global stock selloff and a continuing shift to the safety of Treasury bonds. Chart 1 shows Chinese iShares (FXI) gapping down below its 50-day moving average on very heavy volume. The day'...
READ MORE
MEMBERS ONLY

M ORGAN STANLEY IS BIGGEST LOSER IN FALLING BROKERAGE GROUP -- WHY LOSS OF BROKER LEADERSHIP ISN'T GOOD FOR THE MARKET
by John Murphy,
Chief Technical Analyst, StockCharts.com
MORGAN STANLEY IS LATEST CASUALTY ... On Friday I wrote about selling in brokerage stocks and showed chart breakdowns in Lehman Brothers and Merrill Lynch. The brokerage group was today's weakest industry, and the biggest percentage loser in the group was Morgan Stanley. The daily bars in Chart 1...
READ MORE
MEMBERS ONLY

MORTGAGE CONCERNS HURT FINANCIALS BUT BOOST BONDS AND UTILITIES -- COMMODITY PRICES ARE RISING AGAIN -- WHY RISING GOLD IS GOOD FOR JAPAN -- KLA TENCOR NEARS BULLISH BREAKOUT
by John Murphy,
Chief Technical Analyst, StockCharts.com
MORTGAGE CONCERNS WEAKEN HOUSING SECTOR ... On February 12, I showed a chart of Countrywide Financial starting to break down on rising volume. It's fallen even further since then and is now threatening its 200 day moving average (Chart 1). I took its earlier weakness as a sign that...
READ MORE
MEMBERS ONLY

SILVER ASSETS ARE DOING EVEN BETTER THAN GOLD -- SEMICONDUCTOR SURGE HELPS KEEP THE NASDAQ IN THE BLACK
by John Murphy,
Chief Technical Analyst, StockCharts.com
SILVER EXCEEDED SPRING PEAK MONTHS AGO ... Precious metals surged to new nine-month highs on Wednesday on heavy volume. Although a lot has been made about the fact that gold was testing its spring high (which it broke yesterday), the fact is that silver exceeded that chart barrier in late...
READ MORE
MEMBERS ONLY

TECHS AND SMALL-CAPS EKE OUT GAINS -- APPLE LEADS TECHS HIGHER -- CPI REPORT WEIGHS ON BONDS -- GOLD AND OIL HAVE BIG DAYS -- S&P EXTENDS PNF STRING
by John Murphy,
Chief Technical Analyst, StockCharts.com
TECHS AND SMALL-CAPS HOLD UP... Today's Market Message was written by Arthur Hill. John Murphy will be back tomorrow. - Editor
The market ended mixed on Wednesday. The S&P 500 and Dow edged lower, but the Nasdaq and Russell 2000 closed slightly higher. Techs and small-...
READ MORE
MEMBERS ONLY

FALLING RATES WEAKEN DOLLAR AND BOOST COMMODITIES -- JAPAN ISHARES ARE WEEK'S TOP ETF -- INTERNATIONAL PAPER BREAKS OUT -- CONSUMER STAPLES ARE STAGING COMEBACK -- BROADBAND HOLDERS HAVE STRONG WEEK
by John Murphy,
Chief Technical Analyst, StockCharts.com
IT STARTS WITH FALLING BOND YIELDS... The main feature of the week was a falling dollar, which was the result of falling bond yields. Chart 1 shows the 10-year T-note yield trading at the lowest level in a month. Falling U.S. rates weaken the dollar. Chart 2...
READ MORE
MEMBERS ONLY

MARKET SHRUGS OFF BAD NEWS -- BOND YIELDS AND DOLLAR DROP -- COMMODITIES AND FOREIGN ETFS GAIN -- JAPAN IS TOP PERFORMER -- CONSUMER STAPLES AND HEALTHCARE SHOW NEW LEADERSHIP -- WELLPOINT BREAKS OUT
by John Murphy,
Chief Technical Analyst, StockCharts.com
WEEKLY WRAPUP ... The market shrugged off some bad news on Friday from Microsoft and the housing sector to end either flat or modestly higher. That's actually a pretty good performance. Bond yields and the dollar continued to weaken which boosted commodities (especially gold and oil) and foreign ETFs....
READ MORE
MEMBERS ONLY

BREWERS KEEP GETTING AHEAD -- SOME DOW BREAKOUTS -- JB HUNT SHOWS NEW TRANSPORTATION LEADERSHIP -- QUALCOMM LEADS NASDAQ 100 HIGHER -- BOUNCING YEN BOOSTS JAPAN ISHARES
by John Murphy,
Chief Technical Analyst, StockCharts.com
BUDWEISER TESTS RECORD HIGHS ... Brewers have become consumer staple leaders. Last Friday I showed Molson Coors (TAP) breaking out to a new high (Chart 1). The beer stock is up 5% today and is the strongest stock in the Consumer Staples SPDR (XLP). Right behind it is Anheuser Busch (BUD)...
READ MORE
MEMBERS ONLY
SEMICONDUCTORS FINALLY PROVIDING A LIFT
We have been very bullish the equity market for months and we continue to be. But one wild card has been the semiconductors. In order to truly sustain a nice market rally, we felt the semiconductors would need to participate. Well, we've been waiting...and waiting...and waiting....
READ MORE
MEMBERS ONLY
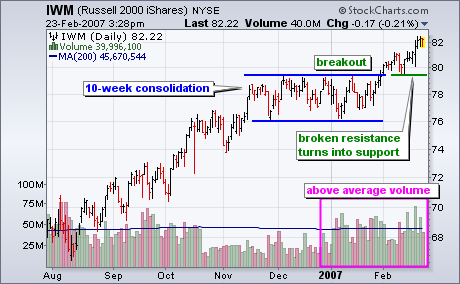
STRONG BUYING PRESSURE IN IWM
The Russell 2000 iShares (IWM) broke consolidation resistance this month and two key volume-based indicators point to strong buying pressure.
The first chart shows the Russell 2000 iShares (IWM) and volume. The ETF surged from mid August to mid November and then consolidated for 10 weeks. This consolidation represents...
READ MORE
MEMBERS ONLY
A NEW OPINION ON RYDEX CASH FLOW
In my 2/16/2007 article, Cash Flow Shows Wall of Worry, I asserted that the dearth of bullish Rydex cash flow was a sign that the rally would probably continue because the bulls were still not committing in a big way. For the sake of variety I try not...
READ MORE
MEMBERS ONLY
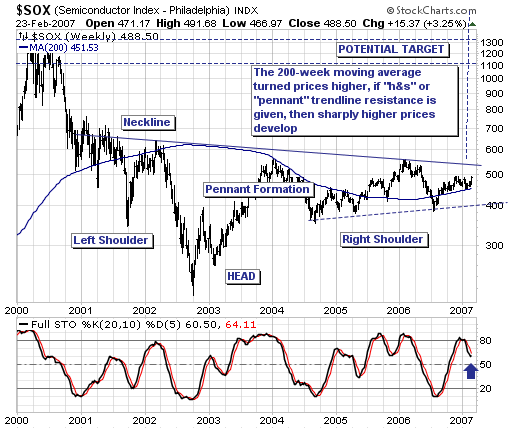
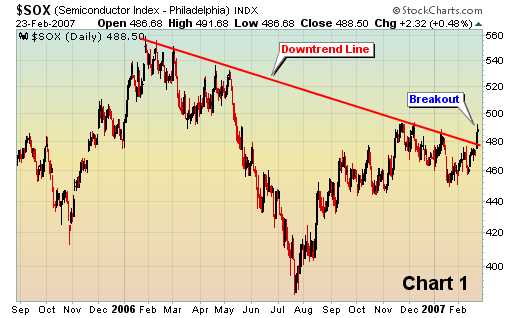
HAVE THE SEMICONDUCTORS BECOME "DEAD MONEY"?
The technology rally from July-to-present has occurred without the participation of the Semiconductor Index ($SOX). We find this rather "odd" to be sure, for one of the basic tenets of any broader market rally were that they were led in general by the technology sector, and...
READ MORE
MEMBERS ONLY
ONE OF THE NICEST KUDOS WE'VE SEEN!
Someone, we honestly don't know who exactly, sent us the following feedback earlier this week. It completely blew us away:
"I'm astonished at how customer friendly your service, website, and daily charts are. Thank you, thank you, thank you. This is my first day with...
READ MORE
MEMBERS ONLY
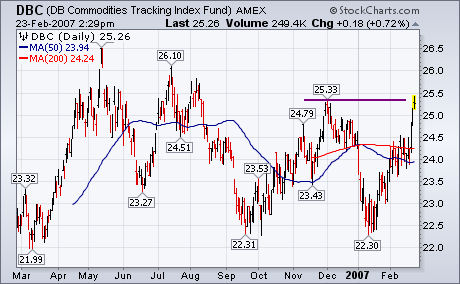
COMMODITY PRICES ARE RISING AGAIN
Just when it seemed like inflation was on the wane, another rally in commodity markets suggests just the opposite. [This week's unexpected jump in the core CPI also caught the market's attention]. Chart 1 shows the DB Commodities Tracking Fund (DBC) challenging its late November peak...
READ MORE
MEMBERS ONLY
PERCENTAGE ABOVE/BELOW THE EXPONENTIAL MOVING AVERAGE
Mary W. writes "I'd like to see how much above or below the 200-day moving average a stock currently is. Does your charting system show that?"
While we don't have a specific indicator for "Percentage above/below the Moving Average", clever...
READ MORE
