MEMBERS ONLY

DOW HITS ANOTER NEW RECORD -- NASDAQ SURGES OFF 50-DAY -- THREE BIG TECHS TAKE THE LEAD -- SOX STILL TRENDING LOWER - BONDS SURGE -- US DOLLAR INDEX BREAKS SUPPORT

by John Murphy,
Chief Technical Analyst, StockCharts.com
GENTLE BEN SPARKS THE DOW... Today's Market Message was written by Arthur Hill. John Murphy will be back tomorrow. - Editor
Comments from Fed Chairman Ben Bernanke sparked a rally on Wall Street and the Dow surged to another record high on Wednesday. The Fed Chairman indicated that inflationary...
READ MORE
MEMBERS ONLY

RECORD US TRADE DEFICIT BOOSTS FOREIGN CURRENCIES -- THAT'S HELPING CANADIAN AND JAPANESE ETFS -- RELATIVE STRENGTH CHARTS SUGGEST THAT JAPAN IS STARTING TO RISE AGAIN -- CHARTING GOLD IN FOREIGN CURRENCIES
by John Murphy,
Chief Technical Analyst, StockCharts.com
CANADIAN DOLLAR AND JAPANESE YEN ARE BOUNCING ... Two of the weaker foreign currencies of late have been the Canadian Dollar and the Japanese yen. [Both are included in the Dollar Index basket]. Today's announcement of a record U.S. trade deficit for 2006 (which was even higher than...
READ MORE
MEMBERS ONLY

ENERGY ETFS WEAKEN WITH OIL -- MORTGAGE LENDER AND REITS SELLOFF -- COVENTRY HEALTHCARE AND TYSON HAVE STRONG DAYS
by John Murphy,
Chief Technical Analyst, StockCharts.com
ENERGY ETFS ARE AVERAGING DOWN... On Friday, crude oil breached the important $60 resistance barrier intra-day, but couldn't hold the gain. In today's trading, crude is down more than $2. Energy ETFs are struggling with some resistance barriers of their own. Chart 1 shows the...
READ MORE
MEMBERS ONLY

GOLD HITS SIX-MONTH HIGH AS OIL CLEARS $60 -- PULLBACK IN HOMEBUILDERS SOFTENS MARKET -- BIG TECHS WEIGH ON NASDAQ -- SO DOES THE SOX -- S&P 500 MAY RETEST ITS 50-DAY AVERAGE -- EXELON BREAKS OUT WITH UTILITIES
by John Murphy,
Chief Technical Analyst, StockCharts.com
COMMODITIES CONTINUE TO RALLY ... Commodity markets continue the rally that started a month ago. Thirteen of the nineteen commodities in the Reuters/Jefferies CRB Index are in the black. Among the day's CRB leaders are copper, wheat, sugar, gold, aluminum, crude oil and silver. Crude exceeded $60 for...
READ MORE
MEMBERS ONLY

WHY EURO IS MORE CLOSELY CORRELATED WITH DOLLAR INDEX THAN THE YEN -- YEN CONTINUES TO WEAKEN AGAINST DOLLAR AND EURO -- TRENDS IN FOREIGN CURRENCIES IMPACT RELATIVE PERFORMANCE OF THEIR STOCK ETFS
by John Murphy,
Chief Technical Analyst, StockCharts.com
WHY YEN AND USD SOMETIMES DROP TOGETHER ... Normally when I discuss the direction of the U.S. Dollar, I use the U.S. Dollar Index (USD). The USD measures the dollar against six foreign currecies. In my view, it gives a truer picture of dollar trends. Following my dollar article...
READ MORE
MEMBERS ONLY

NASDAQ 100 RECAPTURES 1800 -- CISCO GAPS HIGHER -- INTERNET STOCKS TAKE THE LEAD -- NYSE AD LINE SHOWS BROAD PARTICIPATION -- USING THE STOCHASTIC OSCILLATOR -- NASDAQ OVERBOUGHT AND BULLISH -- DOW MIRRORS NASDAQ SITUATION
by John Murphy,
Chief Technical Analyst, StockCharts.com
NASDAQ 100 MAKES A MOVE... Today's Market Message was written by Arthur Hill. John Murphy will be back tomorrow. - Editor
The Nasdaq 100 took the lead on Wednesday with a surge above 1800. This move reinforces support at 1750 and keeps the medium-term uptrend alive. Support around...
READ MORE
MEMBERS ONLY

DOLLAR DIRECTION IMPACTS FOREIGN STOCKS AS WELL AS GOLD -- BOND YIELDS BACK DOWN AS UTILITIES BREAKOUT -- FALLING SOX WEIGHS ON NASDAQ -- INTERNATIONAL PAPER AND MEADWESTVACO JOIN PAPER RALLY
by John Murphy,
Chief Technical Analyst, StockCharts.com
FALLING DOLLAR FAVORS FOREIGN STOCKS ... One of our readers asked why I haven't mentioned the impact of the dollar on foreign stocks. Actually, I've done so several times. Since the dollar is at a crucial juncture, however, this is as good a time as any to...
READ MORE
MEMBERS ONLY
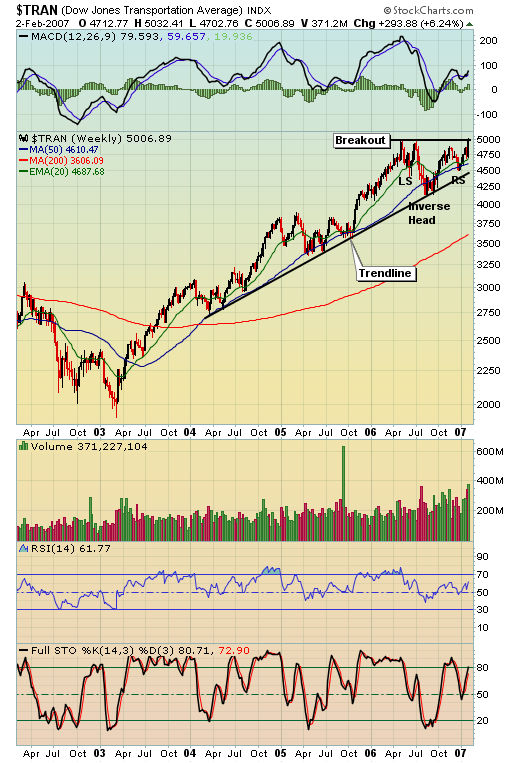
TRANSPORTS LOOKING SOLID
Money generally rotates from one sector to another. Identifying the rotation early in the cycle can make a big difference in trading successfully. If you look at a long-term chart of the Dow Jones Transportation Index (below), you'll see that the group has been trending higher for...
READ MORE
MEMBERS ONLY
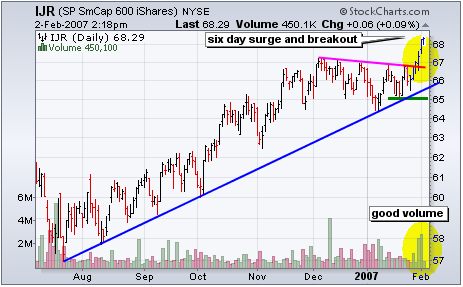
GETTING CHOOSY
The S&P Small-Cap iShares (IJR) hit a new all time high this week and led the market higher over the last six days. Just a few weeks ago, this group was lagging and relative weakness hung over the market The ETF broke above its December high and...
READ MORE
MEMBERS ONLY
BOND TIMING
Timer Digest has ranked Decision Point #1 Bond Timer for the 52-week period ending 1/26/2007. We were also ranked #3 Bond Timer for the year 2006, and #5 Bond Timer for the last five years. Since past performance does not guarantee future results, this information is not...
READ MORE
MEMBERS ONLY
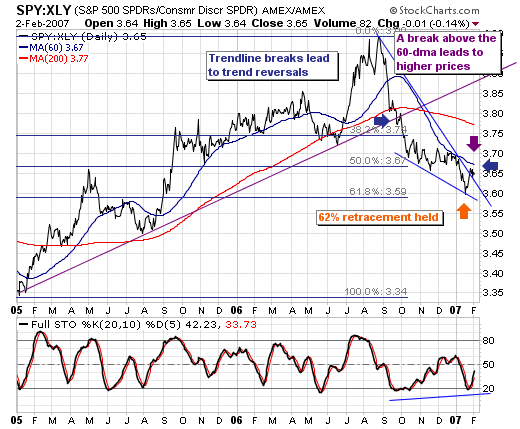
SPY OUTPERFORMING XLY
From our vantage point; the S&P 500 SPDR (SPY) is poised to outperform the Consumer Discrectionary SPDR (XLY) in all-time frames (short-intermediate-long), with a new highs expected to be reached in the late-2007 to 2008 time frame. Our reasoning is such:
* First, the fibonacci...
READ MORE
MEMBERS ONLY
SERVER ROOM, DATA FEED, CHARTSCHOOL
SERVER ROOM PROGRESS REPORT - We've had a bit of a set back on the construction front for our new server facilities. The building management team veto'd some of our construction plans at the last second (Chip was livid) and we are redesigning some things as a...
READ MORE
MEMBERS ONLY
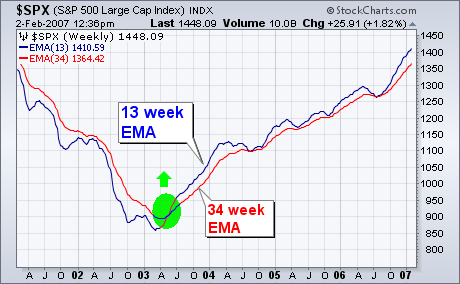
REVUE OF A SUCCESSFUL MOVING AVERAGE TECHNIQUE
Last July, I reviewed a moving average technique that used weekly exponential moving averages. [I first described this system in October 2005]. I'm revisiting it today because it continues to do remarkably well. And I'd like to suggest expanding its usefulness. The technique is a moving...
READ MORE
MEMBERS ONLY

CORRECTION ON CHART 6 OF FRIDAY MESSAGE
by John Murphy,
Chief Technical Analyst, StockCharts.com
WRONG AVERAGE... Some of you with really sharp eyes may have noticed a mistake in the monthly S&P 500 chart that I posted on Friday. The chart was intended to show how the 13- and 34- month exponential moving averages (EMAs) had worked on the S&P...
READ MORE
MEMBERS ONLY

REVUE OF A SUCCESSFUL MOVING AVERAGE TECHNIQUE -- 13 AND 34 PERIOD EMAS ALSO WORK ON DAILIES AND MONTHLIES -- PLOT THE EMA SPREAD FOR BETTER TIMING
by John Murphy,
Chief Technical Analyst, StockCharts.com
WEEKLY EMAS STILL WORK... Last July, I reviewed a moving average technique that used weekly exponential moving averages. [I first described this system in October 2005]. I'm revisiting it today because it continues to do remarkably well. And I'd like to suggest expanding its usefulness. The...
READ MORE
MEMBERS ONLY

DOLLAR INDEX STALLS AT 200-DAY AVERAGE -- GOLD ETF HITS SIX-MONTH HIGH -- ENERGY BPI TURNS UP WITH ENERGY STOCKS -- ALL THREE DOW AVERAGES ARE RISING -- TRANSPORTS ARE CLOSE TO NEW RECORD HIGH
by John Murphy,
Chief Technical Analyst, StockCharts.com
FED STATEMENT WEAKENS THE DOLLAR ... Yesterday's Fed wording about moderating inflation pressures weakened the U.S. dollar (because it virtually ruled out any Fed tightening in the near future). This comes at an important time for the dollar. Chart 1 shows the U.S. Dollar Index (plotted through...
READ MORE
MEMBERS ONLY

SMALL-CAPS ATTEMPT A BREAKOUT -- TRANSPORTS SURGE IN JANUARY -- TRUCKERS AND RAILROADS ROLL -- US DOLLAR AND BONDS CONTINUE INVERSE RELATIONSHIP -- EURO SURGES OFF SUPPORT -- BONDS GET OVERSOLD BOUNCE -- DOW JONES INDUSTRY GROUPS
by John Murphy,
Chief Technical Analyst, StockCharts.com
RUSSELL 2000 CHALLENGES DECEMBER HIGH... Today's Market Message was written by Arthur Hill. John Murphy will be back tomorrow. - Editor
The Russell 2000 is making a breakout bid that would bode well for the overall market. While the Dow and the S&P 500 moved higher in...
READ MORE
MEMBERS ONLY

TELECOM LEADERSHIP CONTINUES AS VERIZON ACHIEVES BULLISH BREAKOUT -- RISING RATES FUND IS RISING WITH BOND YIELDS -- NATURAL GAS STOCKS LEAD ENERGY SECTOR HIGH -- APACHE CORP IS BREAKING OUT
by John Murphy,
Chief Technical Analyst, StockCharts.com
TELECOM LEADERSHIP CONTINUES... I wrote a positive article on the telecom group on June 19 of last year with headlines like "AT&T Leads Telecom Group Higher" and "Telecom Holders Are Having a Good Year". Chart 1 is an updated version of a chart I...
READ MORE
MEMBERS ONLY

LONGER TERM INDICATORS SUGGEST OVERBOUGHT MARKET AND SOME LOSS OF UPSIDE MOMENTUM -- INITIAL SUPPORT LEVELS, HOWEVER, ARE STILL HOLDING
by John Murphy,
Chief Technical Analyst, StockCharts.com
OVERLAYING RSI ON PRICE BARS ... Most chartists place indicators like RSI either above or below corresponding price bars. I like to overlay the indicator right on the price. To me, that makes for easier comparison between the two lines. Take Chart 1 for example. It overlays the 14-week RSI...
READ MORE
MEMBERS ONLY

UPSIDE BREAKOUT IN BOND YIELD WEIGHS ON HOMEBUILDERS AND MAY THREATEN MARKET RALLY -- MARKET SELLS OFF ON HEAVY VOLUME -- NASDAQ CLOSES BELOW 50-DAY AVERAGE
by John Murphy,
Chief Technical Analyst, StockCharts.com
BOND YIELDS REACH FIVE-MONTH HIGH ... The upturn in bond yields that started during December is starting to look more serious. Chart 1 shows the 10-year T-note yield trading over its late October peak (4.85%) and its 200-day moving average for the first time since August....
READ MORE
MEMBERS ONLY

NASDAQ REBOUNDS WITH GAP -- MEASURING RELATIVE STRENGTH -- DISK DRIVE STOCKS POWER TECHS HIGHER -- FINANCE LEADS NY COMPOSITE TO ALL TIME HIGH -- RUSSELL MIDCAP ETF HITS ALL TIME HIGH -- USING RSI FOR TREND IDENTIFICATION
by John Murphy,
Chief Technical Analyst, StockCharts.com
NYSE COMPOSITE AND NASDAQ CONTINUE THEIR BATTLE... Today's Market Message was written by Arthur Hill. John Murphy will be back tomorrow. - Editor
Two weeks ago I wrote that the Nasdaq was holding up well and outperforming the NYSE Composite. The Nasdaq held firm the first five trading days...
READ MORE
MEMBERS ONLY

OVERSOLD COMMODITIES START RALLY ATTEMPT -- WEAKER DOLLAR PUSHES GOLD INTO TEST OF OVERHEAD RESISTANCE -- BOX SIZE MATTERS
by John Murphy,
Chief Technical Analyst, StockCharts.com
DB COMMODITY ETF IS RALLYING ... Last Friday I suggested that an overbought US Dollar Index was starting to back off potential resistance at its 200-day average. The dollar is dropping today against the Euro and is giving a boost to oversold commodity markets. I also suggested on Friday that...
READ MORE
MEMBERS ONLY
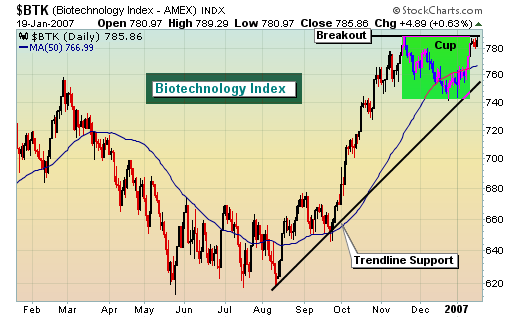
BULLISH ON BIOTECHS
Healthcare stocks have been performing quite nicely over the past few weeks. Looking at the Biotech Index, it appears more bullishness is on the way for this sub-sector. After a nasty 20% selloff from March through May, biotechs stabilized during the summer months before beginning an uptrend that netted...
READ MORE
MEMBERS ONLY

USO: OVERSOLD AND AT SUPPORT
The U.S. Oil Fund ETF (USO) remains in a clear downtrend on the daily chart, but became oversold and reached long-term support on the monthly chart. The combination of oversold conditions and support argue for at least a consolidation and quite possibly an oversold bounce back to broken...
READ MORE
MEMBERS ONLY
ENERGY SECTOR CORRECTION ALMOST OVER
Energy stocks as represented by the Energy Spider (XLE) have been moving in a more or less sideways direction since crude oil topped out in July and entered a bear market. I find it peculiar that energy stocks have consolidated at the same time that crude oil was crashing, but...
READ MORE
MEMBERS ONLY
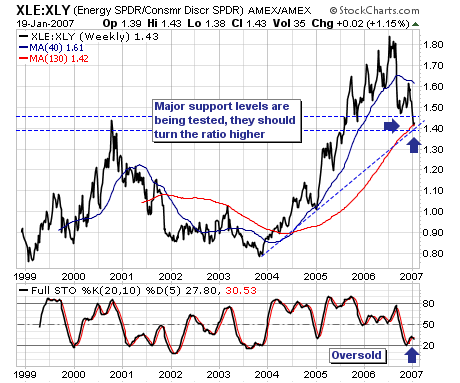
LOOKING AT A PAIRS TRADE
Today we want to look at a "pairs trade" theme we think has good fundamental and technical merit; it is a "long energy/short consumer discretionary shares" trade. Recently, we have begun to put this trade on in various ways; and one that we intend on...
READ MORE
MEMBERS ONLY
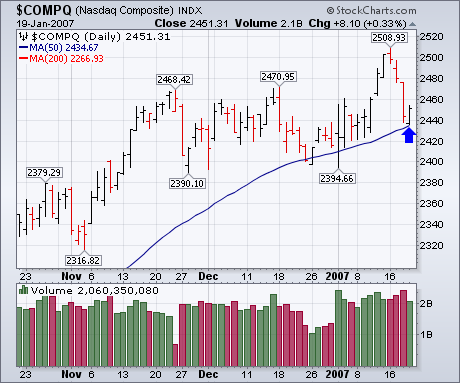
NASDAQ HOLDS 50-DAY LINE...NYSE NEARS HIGH
The market closed the week on an upnote. The most important action took place in the Nasdaq market which bounced off its 50-day moving average (Chart 1). Broader market measures have held up much better. Chart 2 shows the NYSE Composite Index ending the week just shy of its...
READ MORE
MEMBERS ONLY
WEATHER, WEATHER EVERYWHERE
Hopefully things have been better at your house than they have been here in the Pacific Northwest. So far this winter we've had record rainfall, huge windstorms, long power outages, lots of snow, tsunami warnings, icy roads and record cold. The joke these days is "What else?...
READ MORE
MEMBERS ONLY

BULLISH PERCENT STILL UP BUT OVERBOUGHT -- ENERGY BPI IS STILL DOWN BUT OVERSOLD -- COMMODITY SELLING APPEARS OVERDONE -- CHEMICALS BENEFIT FROM DROP IN OIL PRICES
by John Murphy,
Chief Technical Analyst, StockCharts.com
NYSE BULLISH PERCENT HISTORY ... I've received a few requests to update my December 8 article on the NYSE Bullish Percent Index. There are two ways of looking at it. One is a line chart as shown in Chart 1. The second, and more common way, is with a...
READ MORE
MEMBERS ONLY

DRUG STOCKS ARE LEADING HEALTHCARE HIGHER -- ABBOTT LABS BREAKS OUT -- CHIPS PULL NASDAQ LOWER -- NASDAQ 100 BREAKS INITIAL SUPPORT ON HEAVY VOLUME
by John Murphy,
Chief Technical Analyst, StockCharts.com
HEALTHCARE RS LINE MAY BE BOTTOMING ... On January 4, I wrote a message entitled: "Heathcare is Starting to Look Better". I showed the Healthcare SPDR (XLV) hitting a new record high. [It's doing so again today]. I pointed out, however, that its relative strength line was...
READ MORE
MEMBERS ONLY

NASDAQ TAKES A BREATHER -- CISCO AND INTEL LEAD THE WAY LOWER -- SEMIS REMAIN RANGE BOUND -- HEALTHCARE SHOWS RELATIVE STRENGTH -- BRISTOL MEYERS BREAKS RESISTANCE -- ECONOMIC REPORTS PRESSURE BONDS
by John Murphy,
Chief Technical Analyst, StockCharts.com
NASDAQ PAUSES AFTER BREAKOUT ... Today's Market Message was written by Arthur Hill. John Murphy will be back tomorrow. - Editor
After breaking consolidation resistance last week, the Nasdaq took a breather and fell back below 2500 over the last two days. The pullback is relatively mild thus far and...
READ MORE
MEMBERS ONLY

RAILS AND TRUCKERS JOIN TRANPORT RALLY -- TRANSPORTATION ISHARES SURGE -- AIRLINE INDEX HITS THREE-YEAR HIGH -- TRANSPORTS PUSH INDUSTRIAL SPDR TO NEW HIGH
by John Murphy,
Chief Technical Analyst, StockCharts.com
DOW TRANSPORTS CONTINUE TO RALLY ON FALLING OIL ... With oil falling sharply today, transportation stocks are continuing their recent surge. Chart 1 shows the Dow Transports gaining 2% and trading at the highest level in nearly two months. The TRAN crossed over its 50-day moving average on Friday. Its...
READ MORE
MEMBERS ONLY

POINT & FIGURE CHARTS PROVIDE PRECISION, SIMPLICITY, AND DISCIPLINE TO TRADING DECISIONS -- BOX SIZE DOES MATTER -- USE THEM IN CONJUNCTION WITH BAR CHARTS
by John Murphy,
Chief Technical Analyst, StockCharts.com
EXTREME SIMPLICITY ... One of our readers asked that I review some current point & figure charts. The beauty of p&f charts is the precision of buy and sell signals and their extreme simplicity. [P&F is also the oldest form of charting in the U.S.]. I...
READ MORE
MEMBERS ONLY

COMMODITIES ARE OVERSOLD AND BOUNCING -- SO ARE STOCKS TIED TO COMMODITIES -- THE DOLLAR PULLS BACK FROM 200-DAY LINE -- BOND YIELDS REACH TWO-MONTH HIGH -- UPSIDE TARGETS FOR THE NASDAQ AND S&P 500
by John Murphy,
Chief Technical Analyst, StockCharts.com
COMMODITY TRACKING FUND BOUNCES OFF CHART SUPPORT ... Commodities have been the weakest asset class over the last half year. Since last May, the Reuters/Jefferies CRB Index has lost 20%. Most of those losses, however, have come from the energy sector (with crude oil losing 30%). Smaller losses of 10%...
READ MORE
MEMBERS ONLY

BIOTECHS AND TECHS GIVE NASDAQ NEW SIGNS OF UPSIDE LEADERSHIP -- GENENTECH, MICROSOFT, AND YAHOO HAVE GOOD CHART DAYS -- NASDAQ HITS NEW SIX-YEAR HIGH -- EMERGING MARKETS STABILIZE -- THE VIX FALLS
by John Murphy,
Chief Technical Analyst, StockCharts.com
NEW NASDAQ LEADERSHIP ... The first part of the headline posted above is the same one I used last Thursday. At the time the Nasdaq Composite Index had bounced impressively off its 50-day moving average. And its relative strength line (versus the S&P 500) had turned up for...
READ MORE
MEMBERS ONLY

A TALE OF TWO MARKETS -- TECH SPDR CHALLENGES RESISTANCE -- INTEL LEADS SEMICONDUCTORS -- ALCOA SURGES ON BIG VOLUME -- THE RUSSELL 2000 IS STILL LAGGING
by John Murphy,
Chief Technical Analyst, StockCharts.com
NASDAQ LEADS THE WAY... It has been a tale of two markets in 2007. The Nasdaq has been working its way higher this year, but the NYSE Composite has been working its way lower. Even though we are only talking six trading days, something is happening here and we should...
READ MORE
MEMBERS ONLY

KEEP AN EYE ON VOLATILITY -- 50 DAY MOVING AVERAGES ARE STILL HOLDING
by John Murphy,
Chief Technical Analyst, StockCharts.com
VIX IS TESTING OVERHEAD RESISTANCE ... One of the hallmarks of last year's strong stock market was unusually low market volatility. Some market strategists expect volatility to pick up this year. If it does, it could make for a more difficult year for stocks. That's because rising...
READ MORE
MEMBERS ONLY

RISING RATES COULD LEAD TO STOCK MARKET CORRECTION -- DROP IN SMALL CAPS AND EMERGING MARKETS IS ANOTHER SHORT-TERM WARNING -- DOLLAR STRENGTHENS -- STOCK MARKET INDICATORS WEAKEN
by John Murphy,
Chief Technical Analyst, StockCharts.com
RISING RATES POSE A THREAT TO STOCKS ... On December 28, Arthur Hill showed an earlier version of Chart 1 which demonstrated that the stock market advance since mid-year had coincided with a drop in bond yields. As Mr. Hill pointed out, however, the TNX had already broken its six-...
READ MORE
MEMBERS ONLY

AIRLINES FLYING HIGH
Don't look now, but the airlines have found their wings. After drifting lower for the better part of 7-8 years, something strange has happened. Could it be? Yes, airlines are breaking out! I know it sounds impossible, but airlines for the first time in nearly a decade...
READ MORE
MEMBERS ONLY
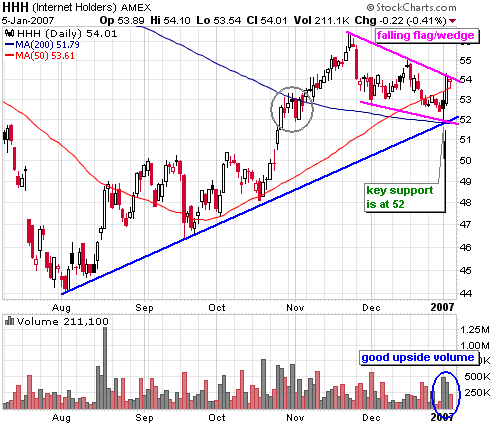
HHH STARTS 2007 WITH A BANG
The Internet HOLDRS (HHH) started 2007 with strong move on good volume, but the ETF was knocked back on Friday and remains just short of breakout. Follow through is the key.
The Internet HOLDRS (HHH) formed a falling flag/wedge over the last six weeks. These are typical for mild...
READ MORE
