MEMBERS ONLY
NEW NYSE COMMON STOCK ONLY INDICATORS
The purpose of this article is to introduce a new set of market indicators that DecisionPoint.com has recently released, indicators constructed from only common stocks listed on the NYSE.
A little background, at its inception The NYSE Composite Index was composed of all the issues listed on the New...
READ MORE
MEMBERS ONLY

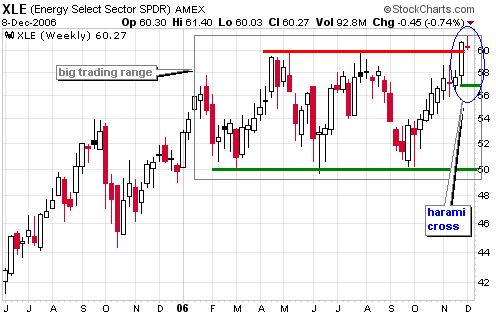
KEEPING AN EYE ON ENERGY
With the first week of the year out of the way; we have seen a rather sharp and violent sell-off in a number of asset classes including energy. Our interest is energy stocks: we think the sell-off has gotten a bit "overdone" to be sure as...
READ MORE
MEMBERS ONLY
SERVER ROOM IMPROVEMENTS STATUS REPORT
Back in November, work started in earnest on our new server facility. The new facility will have much more power and cooling capacity and will allow us to install bigger and better computers to drive our website. December's big wind storm set the schedule back by a week...
READ MORE
MEMBERS ONLY
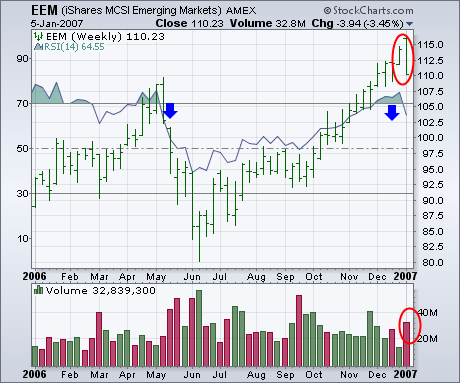
EMERGING MARKETS SUFFER WEEKLY REVERSAL
The MSCI Emerging Markets iShares (EEM) suffered a downside weekly reversal on heavy volume as shown in the chart below. In fact, the EEM had its biggest weekly fall in more than three months. At the very least, that suggests that a pullback of some type is probably in store....
READ MORE
MEMBERS ONLY
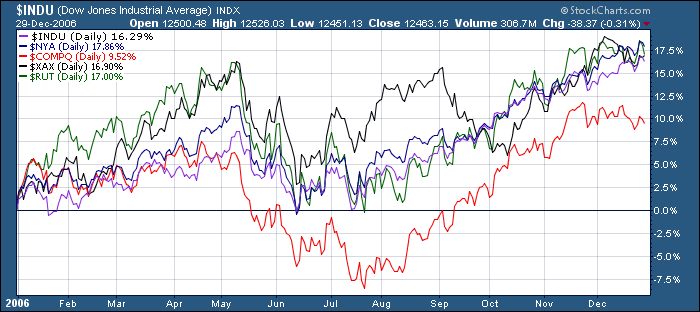
2006 REVIEW, 2007 PREVIEW
Happy New Year's ChartWatchers!
Hopefully the start of 2007 finds you more prosperous than you were at the start of 2006. That's always the goal and, given the performance of the major averages during 2006, it looks like many people achieved it.
Basically, everything was up...
READ MORE
MEMBERS ONLY

STRONG JOBS NUMBER PUSHES RATES HIGHER ALONG WITH THE DOLLAR -- GOLD IS HIT HARD -- FALLING COMMODITIES CAUSE SELLING IN EMERGING MARKETS -- SMALL CAPS WEAKEN -- LOOK FOR WEEKEND UPDATE

by John Murphy,
Chief Technical Analyst, StockCharts.com
JUMP IN JOBS AND WAGES BOOST INTEREST RATES ... Today's report of an unexpected jump in new jobs during the month of December -- combined with a 0.5% jump in wages (for an annual rate of 4.2%)-- raised inflation concerns and is causing a jump in interest rates...
READ MORE
MEMBERS ONLY

BIOTECHS AND TECHS GIVE NASDAQ NEW SIGNS OF UPSIDE LEADERSHIP -- INTEL LEADS CHIP BOUNCE -- SOX BOUNCES OFF 200-DAY AVERAGE -- NETWORKERS HIT NEW HIGHS -- INTERNET AND SOFTWARE GROUPS MAY BE NEXT
by John Murphy,
Chief Technical Analyst, StockCharts.com
NASDAQ LEADS MARKET HIGHER... Two good things happened today regarding the Nasdaq market. One is that it gained over a percentage point and bounced sharply off its 50-day moving average as shown in Chart 1. [The Nasdaq 100 did even better]. That kept the Nasdaq uptrend intact. The second...
READ MORE
MEMBERS ONLY

HEALTHCARE IS STARTING TO LOOK BETTER -- BIOTECHS AND DRUGS RALLY -- LEADERS ARE ABBOTT LABS, AMGEN, GENZYME, AND JNJ
by John Murphy,
Chief Technical Analyst, StockCharts.com
HEALTHCARE WAS WEAKEST SECTOR IN 2006 ... Healthcare was the stock market's weakest sector during 2006. The Healthcare Sector SPDR (XLV) gained 5.4% for the entire year which put it -6.2% behind the S&P 500 which rose 11.6%. Possibly for that reason, a number...
READ MORE
MEMBERS ONLY

A NEW BRIC ETF TRACKS WORLD'S LARGEST EMERGING MARKETS -- ASIA CONTINUES TO LEAD GLOBAL RALLY -- FALLING OIL PULLS COMMODITIES LOWER -- BUT BOOSTS AIRLINES
by John Murphy,
Chief Technical Analyst, StockCharts.com
BRIC ETF LEADS FOURTH QUARTER GAINS... Global markets continued to lead the U.S. market higher through the end of 2006 (and the first couple of days of the new year). Every region in the world did better than the U.S. during the fourth quarter. That includes (in order...
READ MORE
MEMBERS ONLY

NYSE COMPOSITE LEADS 2006 -- NASDAQ 100 LAGS -- TOP PERFORMING SECTORS -- HEALTHCARE LAGS -- GOLD LEADS INTER-MARKET GROUP -- OIL REMAINS WEAK - LOOKING TO 2007
by John Murphy,
Chief Technical Analyst, StockCharts.com
NYSE TAKES TOP HONORS......
NOTE: Today's update is provided by Arthur Hill of TDTrader.com.
The NYSE Composite gained over 15% in 2006 and was the best performing index for the year. That's a pretty good feat for such a broad index. This feat is even...
READ MORE
MEMBERS ONLY

DOW HITS RECORD HIGH - ECONOMIC NEWS SINKS BONDS - INTEREST RATES SURGE - STOCKS VERSUS RATES - HOUSING STOCKS STALL - GOLD GAPS HIGHER
by John Murphy,
Chief Technical Analyst, StockCharts.com
DOW MAKES IT SIX STRAIGHT......
NOTE: Today's update is provided by Arthur Hill of TDTrader.com.
Barring a 280 point decline on Friday, the Dow is set to close higher in December and finish the year with a bang. The Dow is now up 6 consecutive months and...
READ MORE
MEMBERS ONLY

HOLIDAY VOLUME KICKS IN -- NASDAQ BOUNCES OFF 50-DAY -- SMALL-CAPS GET INTO THE SPIRIT -- OIL FALLS SHARPLY -- OIL SERVICE STOCKS FOLLOW CRUDE LOWER -- AIRLINES GET A LIFT -- JETBLUE LEADS AIRLINE STOCKS
by John Murphy,
Chief Technical Analyst, StockCharts.com
STOCKS FIRM ON HOLIDAY VOLUME......
NOTE: Today's update is provided by Arthur Hill of TDTrader.com.
After a three day fall leading up to Christmas, stocks firmed in thin trading on Tuesday. The NYSE Composite ended the day with modest gains and NYSE volume was less than half...
READ MORE
MEMBERS ONLY

TRANSPORT DROP MAY WARN OF PROBLEMS FOR THE DOW -- A HISTORICAL LOOK AT DOW THEORY
by John Murphy,
Chief Technical Analyst, StockCharts.com
THE DOW TRANSPORTS ARE SHOWING NEGATIVE DIVERGENCE ... One of the more notable patches of weakness over the last week was the transportation stocks. On the week, the Dow Transports fell more than 4% and were by far the market's weakest group. At the same time, the Dow Industrials...
READ MORE
MEMBERS ONLY

COPPER FALLS TO EIGHT-MONTH LOW ON SLOWING ECONOMY -- COMMODITIES ARE UNDER PRESSURE -- WATCH THE 50 -DAY MOVING AVERAGE FOR BUY AND SELL SIGNALS
by John Murphy,
Chief Technical Analyst, StockCharts.com
FALLING COPPER HINTS AT ECONOMIC WEAKNESS... Copper prices are usually viewed as a measure of economic strength. That's because it's used in things like autos and housing. It may not be a coincidence then to read that copper prices have fallen to the lowest level in...
READ MORE
MEMBERS ONLY

THE CHART RULES FOR SELLING ARE THE SAME AS THE ONES FOR BUYING -- ENERGY SPDR IS RETESTING ITS RECENT BREAKOUT POINT --
by John Murphy,
Chief Technical Analyst, StockCharts.com
USE THE SAME INDICATORS ... One of readers asked how to determine sell signals for stocks and stock groups. The answer is to use the same chart criteria for selling that are used for buying. Take moving averages for example. A stock in a long-term uptrend gives a buy signal...
READ MORE
MEMBERS ONLY

EMERGING MARKET SELLOFF STABILIZES -- PRECIOUS METALS BOUNCE ON FALLING DOLLAR -- NASDAQ STILL IN TRADING RANGE -- SMALL CAP INDEX TESTS ITS 50-DAY AVERAGE
by John Murphy,
Chief Technical Analyst, StockCharts.com
EMERGING MARKET SELLOFF HAS STABILIZED... Thailand's earlier decision to put controls on foreign money invested in its stock market caused an initial plunge in that country's stock market, and nervous selling across other emerging markets. The central bank quickly excluded stock investments from their currency controls...
READ MORE
MEMBERS ONLY

THE MARKET RALLY STILL FAVORS LARGE CAPS -- SMALL AND MID-CAP INDEXES ARE STALLED AT MAY HIGH -- SIX YEARS OF SMALL-CAP LEADERSHIP MAY HAVE ENDED
by John Murphy,
Chief Technical Analyst, StockCharts.com
SMALLER STOCKS STILL HAVEN'T BROKEN OUT ... A lot has been said and written about the fact that the current market rally has been driven mainly by large cap stocks. So today's story isn't exactly new. It does, however, appear to support the idea that...
READ MORE
MEMBERS ONLY

RETAILERS LEAD MARKET RALLY -- NASDAQ CONSOLIDATION LOOKS TO BE RESOLVING TO THE UPSIDE -- BLUE CHIP INDEXES HIT NEW HIGHS
by John Murphy,
Chief Technical Analyst, StockCharts.com
RETAILERS LEAD RALLY ... Good news from Costco following on the heels of yesterday's strong retail report has ignited the retail sector which is leading the rest of the market higher today. On a percentage basis, the day's strongest ETF is the Retail Holders (RTH) shown in...
READ MORE
MEMBERS ONLY

USE 200-DAY LINE ON RELATIVE STRENGTH CHARTS AS A SCREENING DEVICE -- SEMICONDUCTOR UPTREND IS IN DOUBT -- AIRLINES AND ENERGY ARE ON BUY SIGNALS
by John Murphy,
Chief Technical Analyst, StockCharts.com
ANOTHER WAY TO SCREEN MARKET GROUPS ... I'm a big believer in being in the strongest parts of the market -- and avoiding the weakest. There are lots of ways to do that. The Stockchart Performance Charts, for example, rank the various market sectors and industry groups over any time...
READ MORE
MEMBERS ONLY

VERY LITTLE HAS CHANGED SINCE LAST UPDATE -- FED LEAVES RATES UNCHANGED -- MARKET SHOWS SLIGHT TILT TOWARD DEFENSIVE SHARES -- UTILITIES ARE STRONGER THAN TRANSPORTS
by John Murphy,
Chief Technical Analyst, StockCharts.com
VIX STILL HASN'T GIVEN A TRADING SIGNAL ... At the start of November, I wrote about the potential threat to the market of an upturn in the CBOE Volatility (VIX) Index. At the time, I explained that the VIX had to break through some overhead resistance levels to cause...
READ MORE
MEMBERS ONLY
ARE COMMODITIES BOUNCING BACK, OR JUST BOUNCING?
We've seen commodity prices skyrocket over the past several years and equities that have exposure to commodities have gone along for the ride. Should we be concerned now that those commodities have experienced weakness over the past couple months? Or should we instead be focused on the ensuing...
READ MORE
MEMBERS ONLY
XLE AND USO: SOMETHING HAS TO GIVE
The Energy SPDR (XLE) surged over the last two months and is challenging resistance, but the U.S. Oil Fund ETF (USO) remains relatively weak and continues testing support. These two are out of sync and something has to give. As I see it, either XLE will fail at resistance...
READ MORE
MEMBERS ONLY
CRASH TALK IS PREMATURE
I have heard that a number of people have been predicting a crash. I don't know what evidence they are citing, but my analysis of the price structure and internal indicators leads me to the conclusion that there is not a crash anywhere in sight. This does not...
READ MORE
MEMBERS ONLY
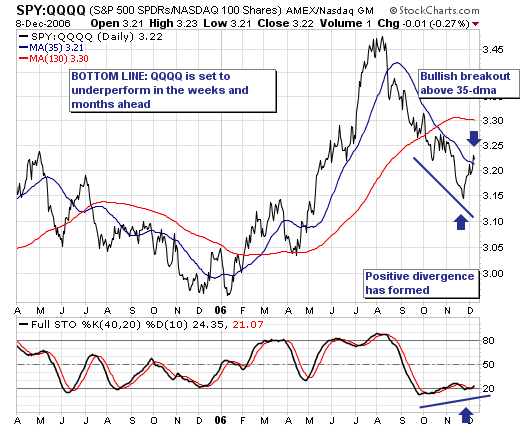
A CORRECTION - OR SOMETHING LARGER?
The recent "slowdown" in the major averages has produced "rotational undercurrents" between these averages; the most poignant we observe is the bullish breakout in the ratio of the S&P 500 Spyders (SPY) and the NASDAQ 100 (QQQQ). The reason we focus upon this is...
READ MORE
MEMBERS ONLY
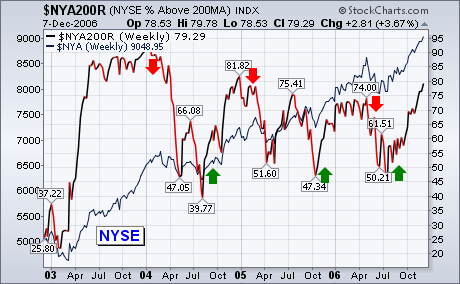
SENTIMENT INDICATORS SHOW A MARKET ENTERING OVERBOUGHT TERRITORY
% NYSE STOCKS ABOVE 200-DAY AVERAGES ... I've received requests to look at some long-term market sentiment indicators. I've chosen a couple that you can plot by yourself on Stockcharts. One of those is the % of NYSE stocks above their 200-day moving average ($NYA200R). That&...
READ MORE
MEMBERS ONLY
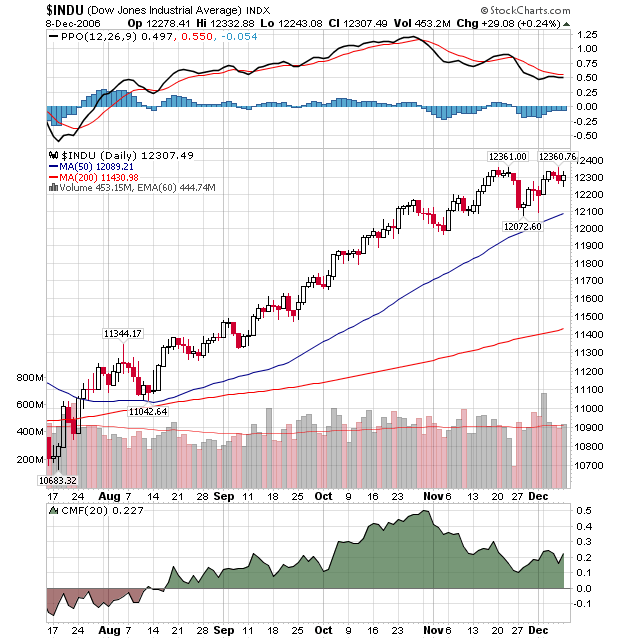
DOW LOOKING "TOPPY"
The Dow Jones Industrial Average had a significant technical development in the middle of last week when it failed to surpass it's previous "peak" for the first time in months. After hitting 12,361 on November 22nd, the index sank to 12,072 a week later....
READ MORE
MEMBERS ONLY

SENTIMENT INDICATORS SHOW AN MARKET ENTERING OVERBOUGHT TERRITORY -- BUT THE TREND OF THE INDICATORS IS STILL UP
by John Murphy,
Chief Technical Analyst, StockCharts.com
% NYSE STOCKS ABOVE 200-DAY AVERAGES ... I've received requests to look at some long-term market sentiment indicators. I've chosen a couple that you can plot by yourself on Stockcharts. One of those is the % of NYSE stocks above their 200-day moving average ($NYA200R). That&...
READ MORE
MEMBERS ONLY

DOLLAR IS IN LONG-TERM DECLINE -- GOLD PULLS BACK FROM SHORT-TERM OVERBOUGHT CONDITION -- FALLING BOND YIELDS BOOST TWO HOUSING ETFS -- USING POINT & FIGURE CHARTS FOR SHORT-TERM SELL SIGNALS
by John Murphy,
Chief Technical Analyst, StockCharts.com
LONG-TERM DOLLAR TREND IS DOWN... One of our readers asked to see a long-term chart of the US Dollar Index. Chart 1 shows the Dollar Index from 1984 to the present. The USD lost half of its value from 1985 to 1990 (falling from 160 to 80). It...
READ MORE
MEMBERS ONLY

MANUFACTURING SLOWDOWN CAUSES PROFIT-TAKING IN STOCKS -- SHORT-TERM INDICATORS STILL SUGGEST MARKET IS IN NEED OF A BREATHER -- NBR INTERVIEW THIS EVENING
by John Murphy,
Chief Technical Analyst, StockCharts.com
NBR INTERVIEW TONIGHT ... I'm scheduled to be the Friday night Market Monitor guest on the Nightly Business Report with Paul Kangas this evening. The TV show airs on Channel 13 (PBS) and runs from 6:30 to 7:00 pm NYT. The guest usually appears midway through the...
READ MORE
MEMBERS ONLY

DOLLAR FALLS TO NEW 20-MONTH LOW -- THAT'S BOOSTING COMMODITIES AND FOREIGN STOCKS -- JAPANESE STOCKS ARE FINALLY BOUNCING -- TEN-MONTH LOW IN BOND YIELDS IS HURTING BANKS -- BUT HELPING HOMEBUILDERS
by John Murphy,
Chief Technical Analyst, StockCharts.com
DOLLAR PLUNGE BOOSTS COMMODITY ASSETS ... As you well know by now, a falling dollar boosts commodity prices and precious metals in particular. The U.S. Dollar Index has fallen to another 20-month low today (the British Pound is trading at the highest level in 14 years). And, not surprisingly,...
READ MORE
MEMBERS ONLY

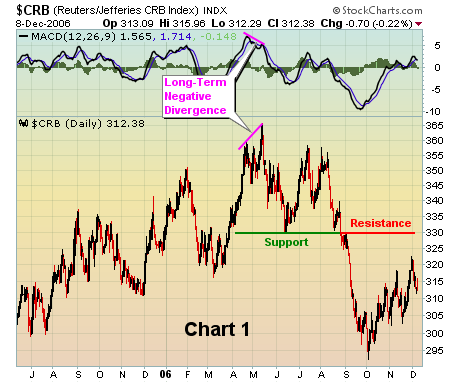
FALLING DOLLAR IS BOOSTING COMMODITIES -- CONTINUOUS COMMODITY INDEX PAINTS STRONGER PICTURE THAN CRB INDEX-- A COMPARISON OF TWO COMMODITY FUNDS -- STRONGER ENERGY SHARES HINT AT OIL BOTTOM -- WHY STOCK RALLY INCREASES ODDS FOR ANOTHER COMMODITY RALLY
by John Murphy,
Chief Technical Analyst, StockCharts.com
TWO DIFFERENT LOOKS AT COMMODITY TREND... When we talk about the trend of commodities in general, it's important to know which trend we're looking at. The next two charts show two versions of the commodity price trend. Chart 1 shows the Reuters/Jefferies CRB Index having...
READ MORE
MEMBERS ONLY

PLUNGING DOLLAR RATTLES STOCKS -- PRECIOUS METALS GAIN -- SO DOES THE FALLING DOLLAR FUND -- S&P 500 SIGNALS SHORT-TERM TOP -- THE NASDAQ MAY RETEST ITS SPRING HIGH
by John Murphy,
Chief Technical Analyst, StockCharts.com
DOLLAR INDEX FALLS TO SPRING LOW... Last Wednesday I wrote about the likelihood of the U.S. Dollar Index heading for a test of its spring low. [I also wrote about the long-term negative implications for the dollar if it were to break that low]. The daily bars in...
READ MORE
MEMBERS ONLY

EXPECTATIONS FOR ECONOMIC SLOWING AND FALLING US RATES PUSH DOLLAR SHARPLY LOWER -- THE EURO IS NEARING ITS 2006 HIGH AS OTHER CURRENCIES JUMP -- PROFUNDS FALLING DOLLAR FUND RISES WHEN THE DOLLAR FALLS
by John Murphy,
Chief Technical Analyst, StockCharts.com
FOREIGN CURRENCIES SURGE AGAINST WEAK DOLLAR ... A government report predicting a slower American economy in the first half of next year is having a bearish impact on the U.S. Dollar and a bullish impact on foreign currencies. Chart 1 shows the Euro moving up to challenge its 2006 highs....
READ MORE
MEMBERS ONLY

INITIAL PRECIOUS METAL BUY SIGNALS ARE STILL INTACT -- SHORT-TERM STOCK INDICATORS ARE OVERBOUGHT, BUT INTERMEDIATE TREND STILL FAVORS HIGHER STOCK MARKET PRICES
by John Murphy,
Chief Technical Analyst, StockCharts.com
EARLIER PRECIOUS METAL BUY SIGNALS ARE STILL INTACT ... Given my somewhat cautious comments on precious metals last week, one of our readers asked if recent point & figure buy signals that I pointed out are still intact. The answer is "yes". Last week I pointed out that gold...
READ MORE
MEMBERS ONLY
WILL THE NASDAQ RALLY FIZZLE?
Not very likely. We've seen a very strong earnings season. Economic report after economic report suggests the Fed is done with its interest rate hike campaign. There are too many non-believers in the market's advance, just take a look at the short-sellers. Lots of...
READ MORE
MEMBERS ONLY

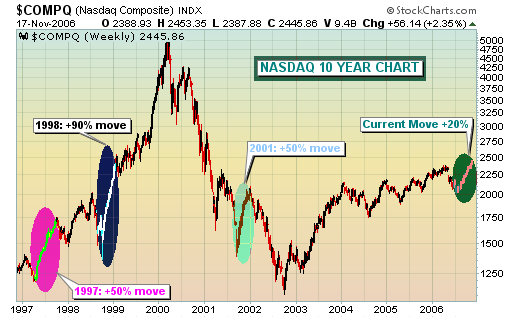
THIRD BREAKOUT FOR QQQQ
For the third time in three months, QQQQ broke consolidation resistance and the uptrend shows no signs of abating. The gray ovals show consolidations in the second halves of August, September and October. These were followed by breakouts in early September, early October and early November. Broken resistance turned into...
READ MORE
MEMBERS ONLY
4-YEAR CYCLE RULES
For quite a while I have been saying that the rally that began in July has been driven by persistent bearishness among investors. I still think this was a significant element, and it was encouraged by a strong belief that a major decline would be occurring in October in conjunction...
READ MORE
MEMBERS ONLY
CANDLEGLANCE, SITE SEARCH
UPDATED CANDLEGLANCE PAGE - We've upgraded the Candleglance page so that people with wide screens will see more charts and less white space. Look for similar improvements throughout our site in the coming weeks.
NEW ENHANCED SITE-SEARCH POWERED BY GOOGLE - We've also greatly enhanced our site...
READ MORE
MEMBERS ONLY

FALLING COMMODITIES HURT CANADA, EMERGING MARKETS LAG
FALLING COMMODITIES HURT CANADA ... When commodity prices started to slide several months ago, I suggested that certain global stocks markets might suffer from falling raw material prices. One of them was Canada. Chart 1 shows the Toronto 300 Index (TSE) in the process of challenging its spring high. That'...
READ MORE
MEMBERS ONLY
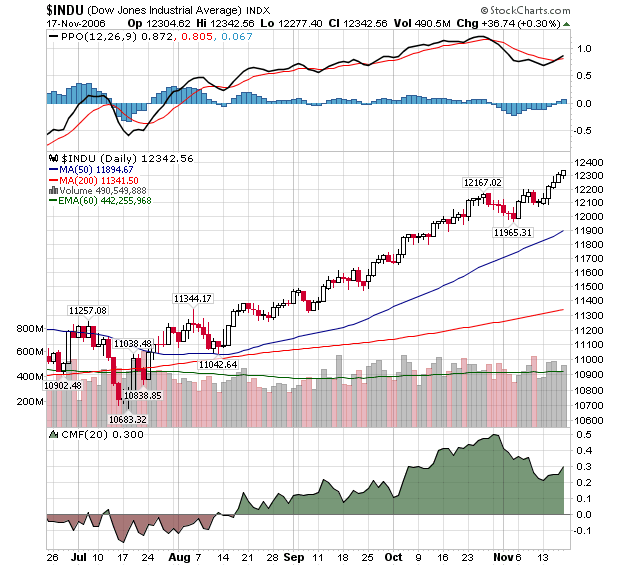
STRONG TECHNICALS?
Here's what a strong techincal picture looks like:
Record closes for each of the past 4 days. Steady volume. Increasing Money Flow values. Quick recovery from a recent downturn. Bullish MACD cross-over. This chart has it all!
Unless...
Maybe too many good signs is a bad sign....
READ MORE
