MEMBERS ONLY

OIL HITS RECORD HIGH AND STOCK SELLING INTENSIFIES -- CYCLICALS, RETAILERS, AND TRANSPORTS LEAD DECLINE -- NASDAQ 100 BREAKS MAJOR SUPPORT LINES

by John Murphy,
Chief Technical Analyst, StockCharts.com
CRUDE EXCEEDS $76... Crude oil surged $1.70 today to reach a new all-time high. A lot of that had to do with mideast tensions. It also had a lot to do with the big drop in oil inventories reported on Wednesday. And the fact that oil, like most...
READ MORE
MEMBERS ONLY

REVIEW OF MOVING AVERAGE SIGNALS -- INTERMEDIATE SELL SIGNAL IS STILL INTACT -- BUT NO MAJOR SELL SIGNAL YET -- DOWNSIDE TARGET IF ONE DOES OCCUR
by John Murphy,
Chief Technical Analyst, StockCharts.com
S&P RETESTS 200-DAY AVERAGE ... This is as good a time as any to take another look at a variety of moving average lines and signals. I'm going to show three different ways to do that. The first is the usual 50- and 200-day moving...
READ MORE
MEMBERS ONLY

SIX-YEAR SMALL CAP DOMINANCE MAY BE ENDING -- REITS AND TELECOM ARE DOING BETTER -- SO IS DJ DIVIDEND ETF
by John Murphy,
Chief Technical Analyst, StockCharts.com
DIVIDEND ETF IS OUTPERFORMING ... Last Friday I showed a few defensive groups that were showing upside leadership including consumer staples, pharmaceuticals, and utilities. Here's another one. Chart 1 is a daily bar chart of the DJ Dividend Index iShares (DVY) through the first six months of 2006. The...
READ MORE
MEMBERS ONLY

FEWER JOBS AND HIGHER WAGES HURT STOCKS -- DOW FALLS BELOW 50-DAY AVERAGE -- DEFENSIVE STOCKS RALLY -- NASDAQ 100 CONTINUES TO DRAG MARKET LOWER
by John Murphy,
Chief Technical Analyst, StockCharts.com
A RECIPE FOR STAGFLATION ... The June employment report gave a double dose of bad news to the stock market today. First of all, June job growth was very weak. That hinted at economic slowing. At the same time, June wages jumped at the fastest rate in five years. That'...
READ MORE
MEMBERS ONLY

NORTH KOREAN MISSILES AND RISING BOND YIELDS RATTLE GLOBAL STOCKS -- GOLD AND OIL RISE -- CRB INDEX TOPS 50-DAY AVERAGE
by John Murphy,
Chief Technical Analyst, StockCharts.com
CRB INDEX CLEARS 50-DAY LINE ... Commodity markets continue the new rally that began with the recent bounce off their 200-day moving average. Today's gain has pushed the Reuters/Jefferies CRB Index back above its 50-day moving average. Fourteen of the nineteen commodities are in the...
READ MORE
MEMBERS ONLY

STOCKS REACT FAVORABLY TO FED MOVE -- SO DO COMMODITIES AS DOLLAR SLIPS -- GASOLINE BREAKS OUT TO TEN-MONTH HIGH
by John Murphy,
Chief Technical Analyst, StockCharts.com
GASOLINE LEADS COMMODITY MARKETS HIGHER ... Commodity markets rose again today. The most bullish action occurred in the gasoline pits. Chart 1 shows the continuous futures contract for unleaded gasoline breaking out to a new ten-month high. Crude oil rose another $1.35 to close at 73.50. That'...
READ MORE
MEMBERS ONLY

GASOLINE CHALLENGES 2006 HIGHS AS ENERGY SHARES RECOVER -- CRB INDEX, GOLD AND SILVER ARE TESTING 200-DAY AVERAGES -- THE DOLLAR IS BOUNCING OFF CHART SUPPORT
by John Murphy,
Chief Technical Analyst, StockCharts.com
GASOLINE TESTS YEARLY HIGH ... One of the things the Fed will most likely be looking at today and tomorrow is the price of oil, gasoline, and most other commodities. They'll do that to get some clue as the future direction of inflation (and the economy). They won'...
READ MORE
MEMBERS ONLY

LACK OF UPSIDE VOLUME SHOWS LITTLE BUYING ENTHUSIASM -- SOX INDEX PULLS MARKET LOWER -- NASDAQ 100 IS TESTING LAST OCTOBER'S LOW
by John Murphy,
Chief Technical Analyst, StockCharts.com
MARKET ON FED WATCH ... Very little has changed over the last few trading days. The market has been attempting a modest price bounce to work off a short-term oversold condition. Major market averages (with the exception of the Dow) have been unable to regain their 200-day moving averages....
READ MORE
MEMBERS ONLY

MARKET ENDS WEEK ON A FIRM NOTE -- BUT LONG-TERM TREND STILL IN DOUBT -- JUNE SPEECH IS AVAILABLE FOR VIEWING
by John Murphy,
Chief Technical Analyst, StockCharts.com
SHORT-TERM TREND STRENGTHENS ... The market is ending the week on a firm note. That's largely due to a short-term oversold condition and improvement in short-term market indicators. Chart 1 shows the daily MACD lines turning positive on the S&P 500 for the first...
READ MORE
MEMBERS ONLY

YIELD ON 10-YEAR NOTE HITS NEW FOUR-YEAR HIGH -- THAT'S BAD FOR HOMEBUILDERS AND RETAILERS -- ESPECIALLY THOSE TIED TO HOME IMPROVEMENT AND FURNISHING
by John Murphy,
Chief Technical Analyst, StockCharts.com
NEW HIGH FOR YIELDS ... The yield on the 10-year Treasury Note touched a new four-year high today. The weekly bars in Chart 1 show that the uptrend in long-term interest rates began exactly a year ago. The fact that bond yields were headed higher was confirmed in...
READ MORE
MEMBERS ONLY

MORGAN STANLEY AND FEDEX LIFT OVERSOLD MARKET AS MAJOR MARKET INDEXES TRY TO RECLAIM 200-DAY AVERAGES
by John Murphy,
Chief Technical Analyst, StockCharts.com
MORGAN STANLEY LEADS BROKERS HIGHER ... Strong second quarter earnings by Morgan Stanley has pushed the brokerage stock up nearly 5% today and is leading a rally in that group and the market in general. Chart 1 shows the stock gapping back over its 200-day moving average on rising volume....
READ MORE
MEMBERS ONLY

KROGER LEADS CONSUMER STAPLES HIGHER -- VERIZON HELPS THE DOW -- ROTATION OUT OF ENERGY INTO CONSUMER STAPLES ISN'T A GOOD SIGN -- NEITHER IS DOW STRENGTH AND SMALL CAP WEAKNESS
by John Murphy,
Chief Technical Analyst, StockCharts.com
CONSUMER STAPLES ARE DAY'S TOP SECTOR... With today's stock market rally fading again, investors continued to favor the defensive qualities of consumer staples. That made consumer staples the day's top sector. That's nothing new. Chart 1 shows the Consumer Staples Sector SPDR...
READ MORE
MEMBERS ONLY

AT&T LEADS TELECOM GROUP HIGHER- RISING RATE FUNDS FOLLOW BOND YIELDS HIGHER -- SMALL CAPS ARE GETTING SMALLER -- NO SAR BUY SIGNAL IN GOLD YET
by John Murphy,
Chief Technical Analyst, StockCharts.com
TELECOM HOLDERS ARE HAVING A GOOD YEAR ... With the market selloff that started in May, a lot of defensive groups have attracted new money -- including consumer staples and utilities. The telecommunications group belongs on that list. Chart 1 shows why. Telecom Holders (TTH) have been one of the top performing...
READ MORE
MEMBERS ONLY
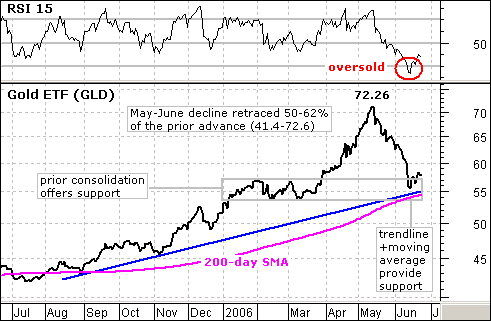
GOLD ETF ENTERS SUPPORT ZONE
After a harrowing decline the last 5-6 weeks, the StreetTracks Gold ETF (GLD) finally reached a support zone and RSI became oversold. This paves the way for a bounce and possibly a continuation of the long-term uptrend.
A number of technical items have come together to mark support...
READ MORE
MEMBERS ONLY
BEARS HAVE HARDLY BUDGED
(Editor's Note: This article was written on June 16th - over a week ago. Given the market's sideways motion since then, the article's basic premise remains valid. It is also instructive to compare commentary from the past with current conditions to see how the commentary...
READ MORE
MEMBERS ONLY
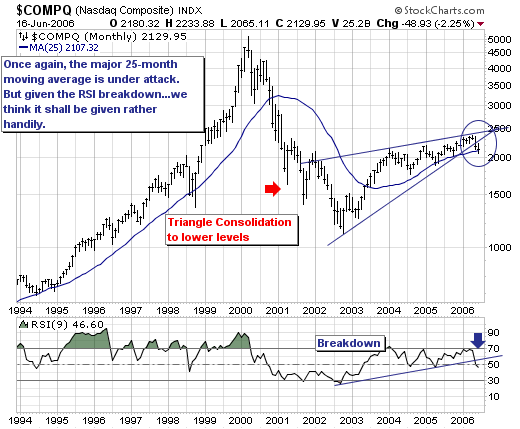
A LOOK AT THE NASDAQ COMPOSITE
The NASDAQ Composite is now in danger embarking on an extended move lower. Quite simply, we use the 25-month month moving average to demarcate the difference between bull and bear trends; and given the Composite is trading only 22 points above this level within the context of an RSI...
READ MORE
MEMBERS ONLY
READING MY LIPS AT THE NYBOT
READING MY LIPS ... On Tuesday June 13, I gave a speech to traders on the New York Board of Trade. I used that opportunity to review the major intermarket principles relating to the dollar, commodities, bonds, and stocks. I talked about the impact of the dollar on foreign ETFs, and...
READ MORE
MEMBERS ONLY
Hello Fellow ChartWatchers!
"Summer-time... and the trading's easy!" Sorry for the singing folks, but we are in a happy mood here at StockCharts right now. Summer time always cheers people in the Pacific Northwest up (I wonder why? ;-). We're so happy that we decided to roll...
READ MORE
MEMBERS ONLY

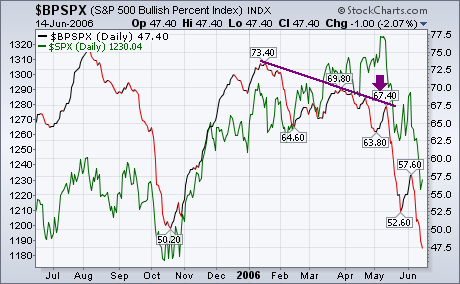
MARKET CONTINUES REBOUND FROM OVERSOLD CONDITION -- NYSE REGAINS 200-LINE PACED BY MATERIALS AND ENERGY -- NYSE BULLISH PERCENT INDEX, HOWEVER, SUGGESTS THIS IS A BEAR MARKET BOUNCE
by John Murphy,
Chief Technical Analyst, StockCharts.com
BULLISH PERCENT INDEX SUGGESTS A BEAR ... The most difficult thing to determine in market analysis is the difference between a market correction and the start of a bear market. They look pretty much the same. Prices fall to an area of chart support (usually around the 200-day moving average)...
READ MORE
MEMBERS ONLY

HIGH CORE INFLATION NUMBERS PUNISH BONDS -- NEGATIVE YIELD CURVE MAY BE HURTING BANKS WHICH FALL SHARPLY -- WORLD STOCK INDEX STILL LOOKS WEAK
by John Murphy,
Chief Technical Analyst, StockCharts.com
BOND PRICES ARE FALLING AGAIN ... For the second day in a row, core inflation numbers came in higher than economists were expecting. Yesterday it was the PPI. Today's core CPI reading for May rose to 0.3%. [The actual CPI rose .4% during May]. Core inflation (excluding food...
READ MORE
MEMBERS ONLY

LEHMAN LEADS BROKERS LOWER -- MARKET STAYS ON THE DEFENSIVE -- JUST AS BOND TOPS LEAD TO STOCK TOPS, STOCK TOPS LEAD TO COMMODITY TOPS
by John Murphy,
Chief Technical Analyst, StockCharts.com
LEHMAN BREAKS 200-DAY AVERAGE ... We've been showing a lot of markets threatening or breaking their 200-day moving averages lately. Here's another one. Despite a 47% jump in second quarter earnings, Lehman Brothers has fallen 4% and, in so doing, has broken its 200-day...
READ MORE
MEMBERS ONLY

NO FRIDAY FOLLOW-THROUGH AS TESTING PROCESS CONTINUES -- BUT LONG-TERM INDICATORS STILL LOOK TOPPY
by John Murphy,
Chief Technical Analyst, StockCharts.com
NYSE STILL SITTING ON 200-DAY LINE ... Friday's market action didn't tell us much about the staying power of Thursday's afternoon bounce. Market averages closed modestly lower in lighter trading volume. The good news is that the NYSE Composite Index remains on top of...
READ MORE
MEMBERS ONLY

MARKET STAGES LATE COMEBACK -- SEVERAL INDEXES END ON TOP OF 200-DAY AVERAGES
by John Murphy,
Chief Technical Analyst, StockCharts.com
DOW AND NYSE INDEXES CLOSE ABOVE 200-DAY LINES ... An afternoon comeback avoided a serious market breakdown. Chart 1 shows the Dow Industrials closing 8 points higher after heavy losses this morning. More importantly, the Dow closed on top of its 200-day moving average. Chart 2 shows the NYSE...
READ MORE
MEMBERS ONLY

HIKES IN GLOBAL RATES PUSH WORLD STOCKS LOWER -- 200-DAY AVERAGES BROKEN AROUND THE WORLD
by John Murphy,
Chief Technical Analyst, StockCharts.com
GLOBAL BREAKDOWN... Rate hikes by central bankers in Europe and Asia (and more hawkish comments from Fed officials) have pushed most global stocks below their 200-day moving averages. Among the hardest hit are emerging markets like Latin America which are tied to commodity prices which are also falling. Chart...
READ MORE
MEMBERS ONLY

BEAR FUNDS CONTINUE TO BENEFIT FROM MARKET DROP -- NASDAQ 100 CONTINUES TO FALL -- S&P 500 RETESTS 200-DAY LINE
by John Murphy,
Chief Technical Analyst, StockCharts.com
BEAR FUNDS ARE STILL RISING... A number of readers have asked for an update on a couple of bear funds that I recommended in mid-May. As you might expect, they've been rising as the market has been falling. Chart 1 shows the ProFunds Short OTC Fund (plotted...
READ MORE
MEMBERS ONLY

RISING RATES AND FALLING STOCKS AREN'T GOOD FOR COMMODITIES -- NEITHER ARE FALLING BASIC MATERIAL STOCKS
by John Murphy,
Chief Technical Analyst, StockCharts.com
FIRMER DOLLAR PUSHES COMMODITIES LOWER... Although commodities have been the strongest asset class since 2002, and while they remain in a major uptrend, they're not immune to a downside correction. We may be seeing the start of one right now. One hint at that is the recent heavy...
READ MORE
MEMBERS ONLY

HOMEBUILDERS CONTINUE TO CRUMBLE -- RECENT MARKET ROTATIONS SHOW INCREASINGLY DEFENSIVE MARKET
by John Murphy,
Chief Technical Analyst, StockCharts.com
HOUSING INDEX HITS NEW 52-WEEK LOW ... More bad news on the housing front pushed the PHLX Housing Index to the lowest level in eighteen months. The weekly bars in Chart 1 leave little doubt that housing stocks have peaked. The recent breaking of the late 2005 lows has left...
READ MORE
MEMBERS ONLY
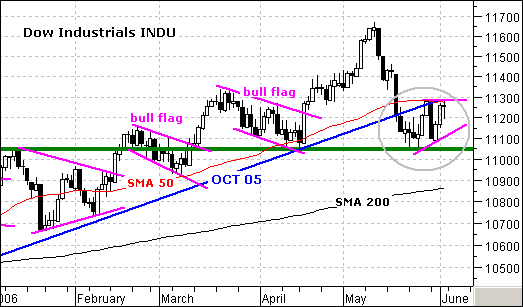
DOW CONSOLIDATES ABOVE KEY SUPPORT
The Dow came down hard in May, but found support at 11050. This support level stems from January resistance and the April low. A key tenet of technical analysis is that broken resistance turns into support. The Dow broke above 11050 in February and this level turned into support in...
READ MORE
MEMBERS ONLY
BOTTOM LOOK PRETTY SOLID
On Tuesday we saw the market successfully retest last week's lows, then on Thursday there was a climactic rally that broke above last week's highs. This was a lot more positive than many people (including me) were expecting.
The most significant short-term event was that...
READ MORE
MEMBERS ONLY
THE DAMAGE FROM "THE MAY SWOON"
The May Swoon as we are apt to call weakness seen during the month had led to an increase in confusion amongst technical analysts. However, we would argue that is all about "time horizons", and we should confuse short-term movements with long-term time horizons as we...
READ MORE
MEMBERS ONLY
SERVER UPGRADES COMPLETED, MORE BANDWIDTH, FUTURE PLANS
SERVER UPGRADE COMPLETED - We hit another major milestone last week when we upgraded our final database server. In addition to the SharpCharts2 roll-out, we've been quietly upgrading our 8 database servers to the newest, fastest hardware from Dell with the newest, fastest software from Microsoft. Last Monday...
READ MORE
MEMBERS ONLY
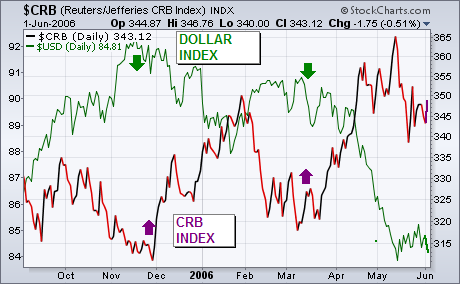
US DOLLAR AT CRUCIAL JUNCTURE
The chart below compares the Dollar Index (green line) to the CRB Index (purple line) since last September. The main message to be drawn from the chart is that the two markets have been trending in opposite directions which is their natural tendency. Dollar peaks last November and again in...
READ MORE
MEMBERS ONLY
Hello Fellow ChartWatchers!
The results are in! We have the five winners for our "Seeing Clearly with SharpCharts2" contest! Thanks again to everyone that entered. There were over one hundred entries and all of them were very well done. The judges' job was not easy at all.
The five winners...
READ MORE
MEMBERS ONLY

COMMODITIES FINISH STRONG -- DOLLAR ENDS WEEK AT CRUCIAL CHART JUNTURE -- UTILITIES SURGE ON FALLING BOND YIELDS
by John Murphy,
Chief Technical Analyst, StockCharts.com
CRB INDEX STAYS OVER 50-DAY LINE ... The Reuters/Jefferies CRB Index jumped seven points today to close at 350. As Chart 1 shows, that keeps the CRB above its 50-day moving average. Chart 1 also shows that very little damage has been done to the commodity uptrend. While...
READ MORE
MEMBERS ONLY

SHORT-TERM BOUNCE CONTINUES AS MARKET INDEXES BOUNCES OFF 200-DAY AVERAGES AGAIN -- MONTHLY AND WEEKLY CHARTS, HOWEVER, STILL LOOK TOPPY
by John Murphy,
Chief Technical Analyst, StockCharts.com
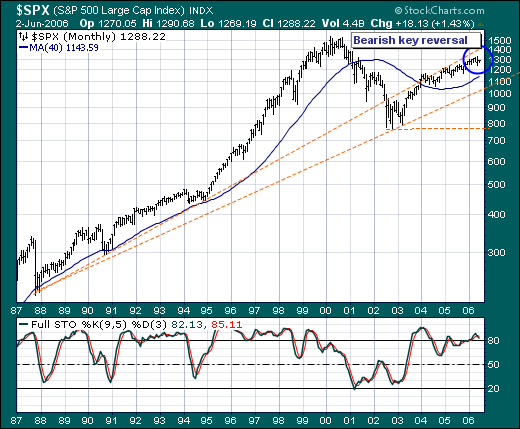
THE DOW IS BACKING OFF FROM 2000 PEAK ... Whenever the market is at an important inflection point, it's usually a good idea to take another look at long-term charts. Not that short-term trends aren't important. But longer-term trends are more important. That'...
READ MORE
MEMBERS ONLY

ANOTHER MEASURE OF VOLATILITY FLASHES A WARNING -- MARKET FALLS ON RISING VOLUME AND MAY HAVE ENDED SHORT-TERM BOUNCE
by John Murphy,
Chief Technical Analyst, StockCharts.com
VIX CONTINUES TO CLIMB ... We've produced a number of articles recently showing the CBOE Volatility (VIX) Index climbing to a new two-year high and warned about the danger that poses for the stock market. That's because the market usually trends in the opposite direction of...
READ MORE
MEMBERS ONLY

200-DAY MOVING AVERAGES HOLD -- WEEKLY INDICATORS, HOWEVER, REMAIN NEGATIVE -- A LONGER LOOK AT WHY NEW DOW LEADERSHIP ISN'T GOOD FOR THE MARKET
by John Murphy,
Chief Technical Analyst, StockCharts.com
SO FAR SO GOOD... Global stock markets survived an important test this week. Almost everywhere we look in the world, we see major stock markets staying above or bouncing off their 200-day moving averages. The first three charts show some of the foreign markets doing the latter. Emerging markets...
READ MORE
MEMBERS ONLY

COMMODITY BOUNCE DOESN'T LAST -- EMERGING MARKETS AND SMALL CAPS TEST 200-DAY AVERAGES -- NEW DOW LEADERSHIP IS A SIGN OF A DEFENSIVE MARKET
by John Murphy,
Chief Technical Analyst, StockCharts.com
CRB GIVES UP ALL OF YESTERDAY'S GAINS ... Yesterday's sharp jump in commodity prices didn't last for long. The CRB Index fell more than nine points today to give up all of yesterday's gains and more. Three of the biggest percentage losers were...
READ MORE
MEMBERS ONLY

COMMODITIES REBOUND AND PULL RELATED STOCKS WITH THEM -- THE XLE AND XAU BOUNCE OFF 200-DAY LINES
by John Murphy,
Chief Technical Analyst, StockCharts.com
COMMODITIES BACK OVER 50-DAY LINES ... Commodity markets are staging a comeback attempt today and the rally is pretty broad based. Fourteen of the nineteen commodity markets are in the black today. The biggest gainers are copper (+11%), silver (+5%), gasoline (2%) and gold (+2%). Chart 1 shows the Reuters/...
READ MORE
MEMBERS ONLY

GROWING RISK AVERSION HURTS EMERGING MARKETS -- BUT HELPS STAPLES, UTILITES, AND BANKS -- BEAR FUND UPDATE -- RISING VIX SHOWS FIRST SIGNS OF FEAR IN FOUR YEARS
by John Murphy,
Chief Technical Analyst, StockCharts.com
EMERGING MARKETS FALL WITH OTHER FORMER LEADERS... Last Monday I wrote about a number of sell signals that were being given in the market and in commodity-related stocks in particular. I wrote a paragraph entitled "Growing Aversion to Risk" in which I explained that former market leaders...
READ MORE
