MEMBERS ONLY

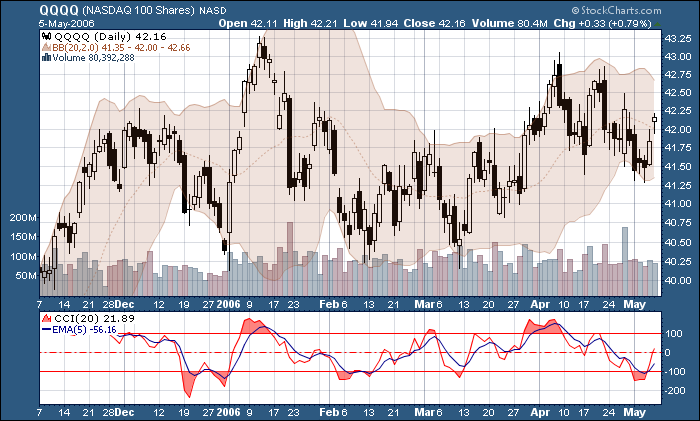
QQQQ BREAKS KEY SUPPORT
QQQQ established support at 40 with three bounces over the last six months and broke this key support level with a sharp decline over the last two weeks. The break below 40 signals a major victory for the bears and the first downside target is to around 37-38. The...
READ MORE
MEMBERS ONLY
OVERSOLD BOUNCE IS DUE, BUT . . .
During the last two weeks the market has experienced a much needed (and long anticipated) decline, and now it is due a bounce out of a short-term oversold condition; however, the decline could continue for a few more months.
On our first chart below we can see that the...
READ MORE
MEMBERS ONLY
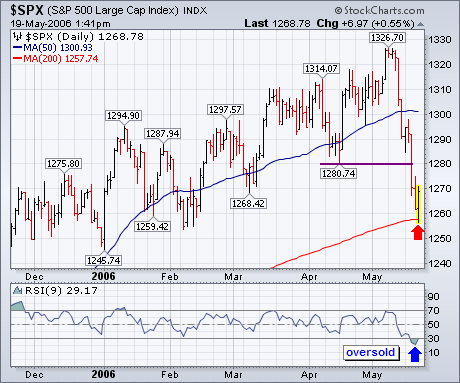
S&P 500 IS ENTITLED TO A BOUNCE
Although the longer-range chart picture has weakened (with most weekly indicators on sell signals), the S&P 500 has lost about 5% this week and looks to be in a short-term oversold condition. Its daily chart shows the 9-day RSI line below 30 for the first...
READ MORE
MEMBERS ONLY
Hello Fellow ChartWatchers!
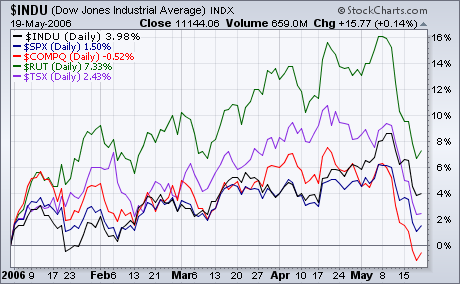
The markets moved lower last week with some disturbingly large downward movements. As you can see in the chart below, last week's losses put the Nasdaq Composite into negative territory for the year - the first of the major averages to get there.
(Did you notice the cool Performance...
READ MORE
MEMBERS ONLY

VIX SPIKE IS ANOTHER CAUTION SIGNAL FOR THE MARKET -- THE S&P 500 IS TESTING ITS 200-DAY LINE AND LOOKS OVERSOLD

by John Murphy,
Chief Technical Analyst, StockCharts.com
VIX HITS ONE-YEAR HIGH ... The market has something else to worry about. The CBOE Volatility (VIX) Index jumped to the highest level in a year. In so doing, it exceeded the previous peak hit in January and, at one point today, the peak hit last October. That's...
READ MORE
MEMBERS ONLY

INFLATION REPORT RATTLES STOCKS -- HOMEBUILDERS ARE NEAR 52-WEEK LOWS -- BEAR FUNDS ARE MOVING UP
by John Murphy,
Chief Technical Analyst, StockCharts.com
CORE CPI TOPS FORECASTS ... While the CPI numbers creep higher month after month, economists keep telling us there's really no inflation. It's all energy. There's no inflation anywhere else and not much threat of it picking up. Those of us who look ahead, however,...
READ MORE
MEMBERS ONLY

CNBC INTERVIEW AT 4:05 -- A SUMMARY OF MY MARKET VIEWS -- ANOTHER LOOK AT SILVER
by John Murphy,
Chief Technical Analyst, StockCharts.com
WITH MARIA ... I'm scheduled to be interviewed at approximately 4:05 pm (Eastern time) this afternoon by Maria Bartiromo on CNBC. If you tune in, you won't hear anything that you haven't already read on this site. Given the events of the past week,...
READ MORE
MEMBERS ONLY

COMMODITIES SUCCUMB TO PROFIT-TAKING
by John Murphy,
Chief Technical Analyst, StockCharts.com
CRB LOSES MORE THAN 2% ... It was just a matter of time until commodities entered a much-needed correction. And today is the day. The Reuters/Jefferies CRB Index fell over 8 points (-2.3%) as 16 of the 19 commodities experienced selloffs. Most of the biggest losers are in...
READ MORE
MEMBERS ONLY

INFLATION FEARS CAUSE HEAVY MAY SELLING -- A LOT OF SELL SIGNALS ARE BEING GIVEN -- ONE WAY TO BENEFIT FROM FALLING MARKET IS TO BUY OTC BEAR FUND
by John Murphy,
Chief Technical Analyst, StockCharts.com
THIS IS LOGICAL SPOT FOR THE MARKET TO PEAK ... I've been writing a lot lately about the inflationary implications of the falling dollar, rising commodity prices, and rising interest rates. I've also been showing a number of negative divergences in market breadth indicators. It looks like...
READ MORE
MEMBERS ONLY

INFLATIONARY IMPLICATIONS OF FALLING DOLLAR AND SOARING COMMODITIES WEAKEN STOCK MARKET -- NASDAQ FALLS THE HARDEST
by John Murphy,
Chief Technical Analyst, StockCharts.com
TOO MUCH FOCUS ON THE FED ... It seems to me there's way too much focus on what the Fed does or what it intends to do. Yesterday's Fed statement hinted at another rate hike in the offing. I suspect there will be several more after that....
READ MORE
MEMBERS ONLY

THE FED DOESN'T HAVE MUCH CONTROL OVER LONG-TERM RATES -- GLOBAL INFLATION IS THE DRIVING FORCE -- THE DOLLAR MAY BE IN SECULAR DOWNTREND
by John Murphy,
Chief Technical Analyst, StockCharts.com
GLOBAL FORCES MAY BE TAKING OVER ... Everyone's attention will be on what the Fed does tomorrow and what it says while it's doing it. The consensus view (encouraged by the new Fed chairman) seems to be for another quarter point rate hike to 5% after which...
READ MORE
MEMBERS ONLY
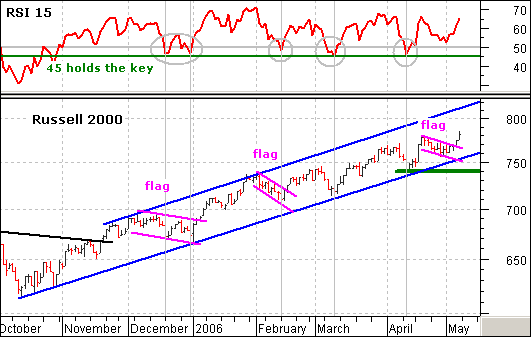
ANOTHER BREAKOUT FOR THE RUSSELL 2000
The Russell 2000 has not been the strongest broad index over the last few weeks, but it is still by far the strongest index in 2006 and shows no signs of stopping after another falling flag breakout on Thursday. This is the third such breakout since December and the death...
READ MORE
MEMBERS ONLY
GOOD AND BAD NEWS ABOUT THE DOLLAR
On March 17 our trend model turned from bullish to neutral on the US dollar, and since then the technical picture has continued to deteriorate. Prices have dropped precipitously from near 90 to near 85, and the weekly 17-EMA has crossed down through the 43-EMA, a long-term...
READ MORE
MEMBERS ONLY
SC2 OFFICIALLY RELEASED
SHARPCHARTS2 OFFICIALLY RELEASED - Late last week we officially released SharpCharts2. This is a huge step forward for StockCharts.com and we couldn't have done it without the help and support of our users. Thanks again to everyone that provided feedback to us during the Beta process. We are...
READ MORE
MEMBERS ONLY
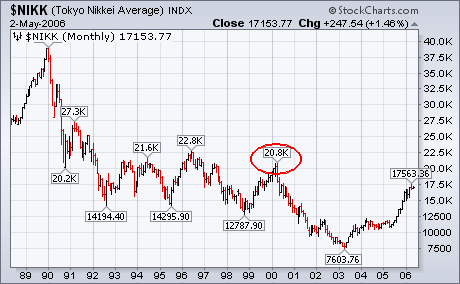
WHY JAPAN IS STILL A GLOBAL VALUE
The first chart below shows why I believe Japan to be one of the best global values. While most other global markets are at or near record highs, the Nikkei 225 has recovered barely a third of its losses from 1990 to 2003. The Nikkei is still down 55% from...
READ MORE
MEMBERS ONLY
Hello Fellow ChartWatchers!
SIGNAL LINES GALORE
One of the huge new features of SharpCharts2 is its ability to plot "indicators of indicators." In other words, SharpCharts2 can chart indicators based on the value of another indicator which, in turn, is based on the value of the chart's main stock,...
READ MORE
MEMBERS ONLY

GOLD'S RISING AGAINST ALL FOREIGN CURRENCIES -- THE RISING YEN BOOSTS JAPAN ISHARES -- WHY JAPANESE LEADERSHIP IS GOOD FOR GOLD AND BAD FOR BONDS -- EWJ NEARS 2000 HIGH
by John Murphy,
Chief Technical Analyst, StockCharts.com
GOLD IN FOREIGN CURRENCIES ... One of our readers asked if the falling dollar is the only reason that gold is rising. The answer to that is most certainly no. Since gold is quoted in U.S. dollars, a falling dollar produces higher gold prices. That means that gold rises in...
READ MORE
MEMBERS ONLY

OIL FALLS BELOW $70 AND CAUSES ENERGY PROFIT-TAKING -- GOLD AND METALS STOCKS RISE WITH THE EURO -- USING PRICE CHANNELS TO STAY WITH A TREND
by John Murphy,
Chief Technical Analyst, StockCharts.com
CRUDE FORMS SHORT-TERM TOP ... Crude oil prices fell sharply for the second day in a row. More importantly, today's drop of $2.68 puts it back below $70 for the first time in three weeks. That breaks the intra-day low hit last week and has left...
READ MORE
MEMBERS ONLY

BULLISH PERCENT INDEX GIVES ANOTHER BEARISH DIVERGENCE -- A BREAK OF APRIL LOWS WOULD PROVIDE INTERMEDIATE SELL SIGNAL ON THE S&P 500
by John Murphy,
Chief Technical Analyst, StockCharts.com
A HISTORICAL LOOK AT THE BPI... One of the themes that I keep coming back to is that the 2006 bull market advance into new multi-year highs isn't being confirmed by a lot of technical indicators that measure market breadth. I've written articles showing negative...
READ MORE
MEMBERS ONLY

THE PARABOLIC STOP AND REVERSAL (SAR) SYSTEM WORKS WELL IN FAST RISING MARKET LIKE GOLD -- FILTERING DAILY SIGNALS WITH WEEKLY AND MONTHLY CHARTS -- STAGGERING SELL STOPS
by John Murphy,
Chief Technical Analyst, StockCharts.com
USING SAR IN FAST RISING MARKET ... Different market conditions require different indicators. Fortunately, Stockcharts offers a wide variety. What works in a trading range market doesn't work as well in a trending market. What works in a market that's trending gradually higher might not be suitable...
READ MORE
MEMBERS ONLY

MONDAY RECAP - Jeanette Young
by John Murphy,
Chief Technical Analyst, StockCharts.com
SELL IN MAY AND GO AWAY?...NOT... He just couldn't leave well enough alone; there was the Dow Jones, enjoying a rally in today's session and then, Chairman Bernanke's comments were aired, minimizing the rally in gold, crude oil and a rise in interest...
READ MORE
MEMBERS ONLY

ANOTHER LOOK AT BOLLINGER BANDS -- HOW TO APPLY THEM TO DIFFERENT TIME SPANS -- AND HOW TO COMBINE THOSE TIME SPANS
by John Murphy,
Chief Technical Analyst, StockCharts.com
DIRECTIONAL SIGNALS ON MONTHLY CHART ... I'm going to devote this article to a demonstration of the usefulness of Bollinger Bands. But first an explanation of what they are. Developed by John Bollinger, the two bands are plotted two standard deviations above and below a middle line which is...
READ MORE
MEMBERS ONLY

HINT AT RATE PAUSE RALLIES MARKET -- FINANCIALS LEAD -- CHINESE RATE HIKE WEAKENS COMMODITIES
by John Murphy,
Chief Technical Analyst, StockCharts.com
CHINESE RATE HIKE WEAKENS COMMODITY MARKETS ... The Chinese central bank raised interest rates for the first time since October 2004. They did that to prevent the Chinese economy from overheating. One of the immediate reactions was a selloff in most commodity markets. It's no secret that China has...
READ MORE
MEMBERS ONLY

ANOTHER MEASURE OF MARKET BREADTH SHOWS NEGATIVE DIVERGENCE
by John Murphy,
Chief Technical Analyst, StockCharts.com
McCLELLAN SUMMATION INDEX ... Yesterday I showed some negative divergence starting to appear between the NYSE Advance-Decline line and the S&P 500. In response to another reader question, today I'm showing another measure of market breadth that's showing a more serious negative divergence. The...
READ MORE
MEMBERS ONLY

FALLING GASOLINE CAUSES ENERGY PROFIT-TAKING -- BOND YIELDS HIT ANOTHER FOUR-YEAR HIGH -- DOLLAR INDEX FALLS TO SEVEN-MONTH LOW -- NYSE ADVANCE-DECLINE LINE STARTS TO WEAKEN
by John Murphy,
Chief Technical Analyst, StockCharts.com
FALLING GASOLINE PULLS XLE LOWER ... Earlier today I showed gasoline futures pulling back from overhead resistance at their summer highs. That caused profit-taking in energy shares. I also showed Exxon Mobil and ConocoPhillips pulling back from their September highs. Chart 1 shows the selling in the Energy SPDR (XLE)...
READ MORE
MEMBERS ONLY

GASOLINE PULLS BACK FROM OVERHEAD RESISTANCE AND CAUSES PROFIT-TAKING IN ENERGY PATCH -- EXXON AND CONOCO PULLBACK FROM THEIR SEPTEMBER HIGHS
by John Murphy,
Chief Technical Analyst, StockCharts.com
THIS IS NORMAL SPOT TO EXPECT A PULLBACK ... Everyone is looking at the chart of crude oil. They should also be watching gasoline. That's because gasoline futures have reached their next upside target and are starting to pullback from the most overbought reading since last summer. That'...
READ MORE
MEMBERS ONLY

SURGING YEN WEAKENS NIKKEI -- BUT THE FALLING DOLLAR CUSHIONS JAPANESE ISHARES -- GOLD AND SILVER ARE TAKING WELL-DESERVED BREATHER
by John Murphy,
Chief Technical Analyst, StockCharts.com
YEN SURGES ON CALL FOR HIGHER ASIAN CURRENCIES ... Last week we saw the Euro hit a new 2006 high. Today it's the yen that's jumping. Over the weekend, the Group of Seven called for Asian countries to let their currencies rise to their true market values....
READ MORE
MEMBERS ONLY

COMMODITIES AND THEIR STOCKS BOUNCE BACK -- CRUDE HITS $75 FOR FIRST TIME -- NASDAQ 100 SUFFERS DISTRIBUTION DAY
by John Murphy,
Chief Technical Analyst, StockCharts.com
CRB INDEX STAYS ABOVE BREAKOUT POINT ... Yesterday's bout of commodity profit-taking (which was concentrated in metals markets) may have been a one-day affair. At least that's what today's strong bounce back suggested. The CRB Index regained 4.65 points today to close...
READ MORE
MEMBERS ONLY

COMMODITIES RECAP - Jeanette Young
by John Murphy,
Chief Technical Analyst, StockCharts.com
EURO SETTING NEW HIGHS FOR THE YEAR... As indicated in Chart 1, after the strong rally seen on April 05, 2006, the Euro retreated, never breaking the uptrend line. All this backing and filling gave the Euro enough energy to leap forward, gapping higher and printing a new high for...
READ MORE
MEMBERS ONLY

USING PROFUNDS TO TRADE THE DOLLAR -- XAU INDEX BREAKS OUT TO RECORD HIGH -- OIL ETFS HIT NEW HIGHS AS NATURAL GAS BOTTOMS -- CORE CPI IS HIGHEST IN A YEAR
by John Murphy,
Chief Technical Analyst, StockCharts.com
USING PROFUNDS TO TRADE THE DOLLAR ... With the U.S. Dollar continuing to drop toward its low for the year -- and the Euro hitting a new 2006 high today -- it's time to revisit two mutual funds that allow investors to trade the U.S. Dollar. As was the...
READ MORE
MEMBERS ONLY

MARKET SURGES ON BIG VOLUME -- FCX HITS RECORD HIGH -- SEMIS GAIN MORE THAN 3% -- FALLING DOLLAR PUSHED CRB INDEX TO RECORD HIGH AND BOOSTS FOREIGN ETFS
by John Murphy,
Chief Technical Analyst, StockCharts.com
MAJOR INDEXES HAVE IMPRESSIVE DAY ... I'm not sure exactly what caused today's impressive stock market rally. It might have been a relatively low core inflation figure. Or it may have been comments from a Fed official hinting that the Fed was concerned about raising rates too...
READ MORE
MEMBERS ONLY

GE LEADS DOW LOWER -- A PLUNGING DOLLAR PUSHES COMMODITY PRICES SHARPLY HIGHER AND THE STOCK MARKET LOWER -- $70 OIL PUNISHES AIRLINES AND RETAILERS
by John Murphy,
Chief Technical Analyst, StockCharts.com
FOREIGN CURRENCIES JUMP AGAINST DOLLAR... The U.S. dollar fell sharply today against all of its major trading partners. Once again, the main impetus came from another Chinese voice calling for a reduction in that country's holdings of U.S. assets. Chart 1 shows today's explosive...
READ MORE
MEMBERS ONLY
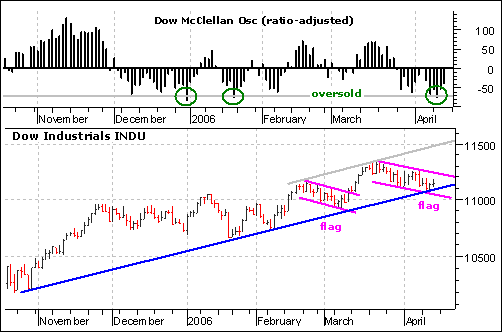
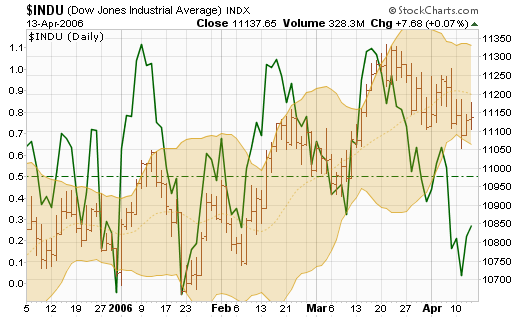
DOW OVERSOLD AND AT SUPPORT
The decline in the Dow Industrials over the last few weeks looks like a bull flag. This downward sloping flag is a potentially bullish pattern that requires confirmation with an upside breakout. Notice that the Dow formed a similar falling flag in late February and early March. The breakout at...
READ MORE
MEMBERS ONLY
ENERGY ADVANCE NOT SUPPORTED BY CASH FLOW
One way we can gauge sentiment regarding a particular market or sector index is by watching asset levels and/or cumulative net cash flow in and out of the related Rydex mutual fund. In general, cash flows should rise and fall along with prices. When divergences occur, price movement should...
READ MORE
MEMBERS ONLY
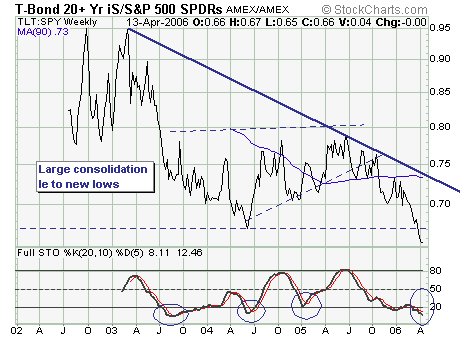
INTEREST RATES MATTER AT THE MARGIN
Last week the 10-year note and 30-year bond rose decidedly above the psychologically important 5.0% level. This is first time since June-2002 that the 10-year has traded above this level. If we have learned anything in our 24 years of trading - it is that interest...
READ MORE
MEMBERS ONLY
SHARPCHARTS2 ALMOST COMPLETED
SHARPCHARTS2 PROGRESS REPORT -SharpCharts2 took another huge step forward last week when all of our "Basic" subscribers were automatically converted to the new system. At this point, the only group left to be fully converted to the new charts is our Extra (and "ExtraRT") members. We...
READ MORE
MEMBERS ONLY
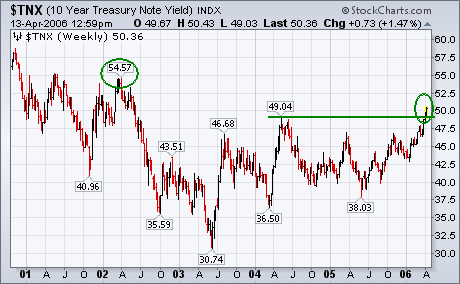
TEN-YEAR YIELDS EXCEEDS 5%
Last week the yield on the 10-Year T-note broke through its 2004 peak at 4.90% to reach the highest level in four years. Today the TNX has moved through the psychological level of 5%. That doesn't come as much of a surprise considering that the...
READ MORE
MEMBERS ONLY
Hello Fellow ChartWatchers!
MAKING MONEY WITH SHARPCHARTS2
This week - tax week (ugh!) - I wanted to show you three examples of the kind of analysis that you can only do with SharpCharts2. These examples illustrate important technical analysis techniques that just weren't possible with our older charts. Hopefully, these examples will inspire...
READ MORE
MEMBERS ONLY

PROFUNDS RISING RATES FUNDS RISE WITH BOND YIELDS -- SHORT REAL ESTATE FUND MOVES INVERSELY TO REITS
by John Murphy,
Chief Technical Analyst, StockCharts.com
PROFUNDS RISING OPPORTUNITY 10 FUND ... I wrote an article yesterday (Thursday) about rising long-term interest rates and why that was bearish for bond funds. That's because traditional bond funds (which are based on the price of bonds) fall when bond yields are rising. The 10-year T-...
READ MORE
MEMBERS ONLY

TEN-YEAR YIELDS EXCEED 5% -- HOMEBUILDERS CONTINUE TO WEAKEN -- REITS BREAK 50-DAY LINE
by John Murphy,
Chief Technical Analyst, StockCharts.com
TEN-YEAR YIELDS EXCEEDS 5% ... Last week the yield on the 10-Year T-note broke through its 2004 peak at 4.90% to reach the highest level in four years. Today the TNX has moved through the psychological level of 5%. That doesn't come as much of...
READ MORE
