MEMBERS ONLY

FIRST QUARTER SUPPORT LINES ARE BROKEN -- WATCHING SMALL CAPS FOR SIGNS OF A TOP

by John Murphy,
Chief Technical Analyst, StockCharts.com
S&P 500 AND DOW BREAK SUPPORT LINES ... Although the S&P 500 closed slightly below its 50-day average, it was the only one of the major stock indexes to do so. That, however, isn't my main concern with today's action. My main...
READ MORE
MEMBERS ONLY

GASOLINE HITS SIX-MONTH HIGH WHILE CRUDE IS TESTING OLD HIGH -- UTILITY FALL MAY BE EARNING MARKET WARNING -- HEALTHCARE BREAKS DOWN
by John Murphy,
Chief Technical Analyst, StockCharts.com
GASOLINE CONTINUES TO CLIMB ... It's no secret that energy prices are climbing again. And that shouldn't be a surprise to anyone who watches price charts. Back on March 29, for example, I showed the futures price of gasoline breaking through its January high at 1.89...
READ MORE
MEMBERS ONLY

10-YEAR T-NOTE YIELD HITS FOUR-YEAR HIGH -- JAPAN'S EMERGENCE FROM DEFLATION IS A BIG REASON WHY -- OVERBOUGHT GOLD MARKET PULLS BACK FROM $600 -- APRIL ENDS STRING OF BEST SIX MONTHS
by John Murphy,
Chief Technical Analyst, StockCharts.com
30-YEAR T-BOND YIELD EXCEEDS 5% ... A strong employment report today finally pushed long-term rates above key chart and psychological barriers. That's having a ripple effect through all of the financial markets. It's giving a boost to the dollar which may be contributing to...
READ MORE
MEMBERS ONLY

EURO RALLIES WHILE DOLLAR WEAKENS -- A REVIEW OF FLORIDA CURRENCY CHARTS -- SHIFT FROM ASIAN DEFLATION TO INFLATION -- BEWARE A RISING YUAN
by John Murphy,
Chief Technical Analyst, StockCharts.com
WE DON'T GET ANY RESPECT ... Modified to correct the language, that familiar refrain was until recently the mantra of the Euro. The beleaguered currency, however, has perked up and begun to rally. We noted in a previous article at the start of March (March 01, 2006) the change...
READ MORE
MEMBERS ONLY

INDUSTRIALS SPDR HITS NEW HIGH -- UPS HITS NEW 52-WEEK HIGH -- HEWLETT AND HONEYWELL REMAIN DOW LEADERS
by John Murphy,
Chief Technical Analyst, StockCharts.com
INCLUDES A LOT OF TRANSPORTS ... I recently wrote about the strong action in the Industrials Sector SPDR (XLI) (March 15, 2006). The headline in that piece was "Rails Lead Industrials SPDR to Record Highs". That's still the case. The purpose of that article was twofold. One...
READ MORE
MEMBERS ONLY

RECENT BOUNCE IN TAIWAN ISHARES AND TAIWAN SEMICONDUCTOR MAY CARRY SOME GOOD NEWS FOR THE SOX
by John Murphy,
Chief Technical Analyst, StockCharts.com
SEMICONDUCTOR INDEX MAY BE BOTTOMING ... Last week I wrote about how the Semiconductor (SOX) Index was in an area of chart support and starting to show early signs of turning back up again. The daily bars in Chart 1 show the SOX finding new support just above its 200-day...
READ MORE
MEMBERS ONLY
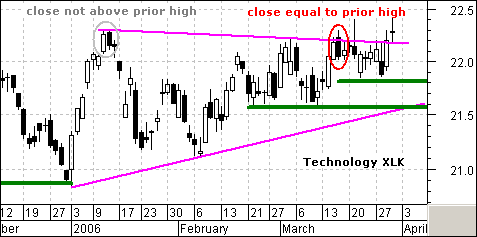
DARK CLOUDS REVISITED
In my previous column, I featured the Information Technology SPDR (XLK) with a pair of Dark Cloud Cover reversal patterns. Greg Morris, who wrote Candlestick Charting Explained, informed me that the Dark Cloud Cover pattern is one of the few that uses the previous days high as part of its...
READ MORE
MEMBERS ONLY
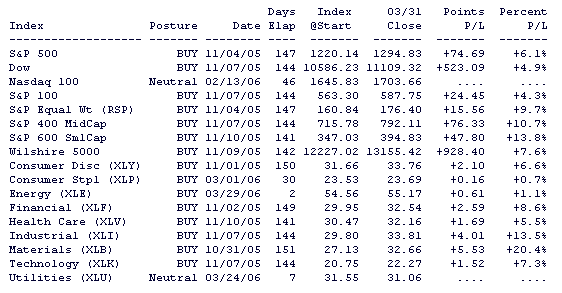
MARKET TREND IS STILL UP, BUT...
The overall trend of the market is still up, but there are very few new opportunities surfacing. Taking a look at our primary mechanical timing models below, we can see that nearly all of the broad market and sector indexes are on profitable buy signals, but most of the signals...
READ MORE
MEMBERS ONLY
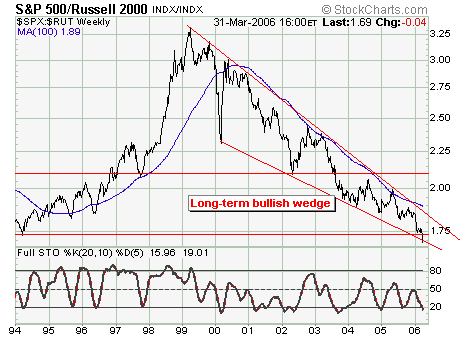
LARGE CAPS VS. SMALL CAPS
Today we look at large cap vs. small cap stock via the S&P 500/Russell 2000 Ratio. Since 1999, the ratio has gone nowhere other than down; which means this is the 8th year of decline. More generally, the ratio runs in 7 year cycles, so given we...
READ MORE
MEMBERS ONLY
SHARPCHARTS2 FOR BASIC MEMBERS STARTS THIS WEEK!
BASIC MEMBERS, SHARPCHARTS2 CONVERSION LATER THIS WEEK! - If you are a member of our "Basic" charting service, get ready. We plan on converting our Basic members to our SharpCharts2 charts during the coming week. ALL OF YOUR SAVED CHARTS WILL BE AUTOMATICALLY CONVERTED FOR YOU. You don'...
READ MORE
MEMBERS ONLY

SMALL CAPS AND AD LINE ARE STILL RISING
Rising interest rates can help the stock market over the short- to intermediate-term because it implies economic strength. It also causes some money to rotate out of falling bond prices and into stocks. Although rising bond yields usually cause problems for the market eventually, we have to watch the...
READ MORE
MEMBERS ONLY

Hello Fellow ChartWatchers!
NADAQ BREAKSOUT - P&F CHART SHOWS IT BEST
Last week the Nasdaq composite broke through the 2340 resistance level and has moved into territory not seen since the "bubble popped" back in early 2001. The mid-term significance of this development can best be seen on the...
READ MORE
MEMBERS ONLY

A STRONG GERMANY IS PUSHING GLOBAL BOND YIELDS HIGHER AND BOOSTS EURO -- A WEAKER DOLLAR PUSHES GOLD TO A 25-YER HIGH -- EWJ BREAKS OUT -- SMALL CAP LEADERSHIP IS A SIGN OF MARKET OPTIMISM
by John Murphy,
Chief Technical Analyst, StockCharts.com
GERMANY LEADS STRONG EUROPEAN GAINS ... A lot of today's intermarket moves can be traced to new signs of strength in Europe. Today, for example, three of Europe's markets -- France, Germany, and Italy -- showed gains of more than 1% to lead global markets higher. The biggest of...
READ MORE
MEMBERS ONLY

BASIC MATERIALS, ENERGY, AND TECHS LEAD MARKET HIGHER -- APPLE AND GOOGLE SUPPORT NASDAQ BREAKOUT -- AS DO INTERNET AND CHIP STOCKS
by John Murphy,
Chief Technical Analyst, StockCharts.com
CRB INDEX MOVES OVER 50-DAY LINE... Last Friday I showed the Reuters/Jefferies CRB Index rebounding off its 200-day moving average and suggested that the commodity correction appeared over. In today's trading, the CRB is climbing above its 50-day moving average and appears to be...
READ MORE
MEMBERS ONLY

HECLA MINING IS ANOTHER SILVER PLAY -- METAL STOCKS LEAD MATERIALS SPDR HIGHER -- STRONGER YEN BOOSTS JAPANESE ISHARES -- WHY TIGHTER JAPANESE POLICY COULD HURT THE DOLLAR AND BOOST GOLD
by John Murphy,
Chief Technical Analyst, StockCharts.com
HECLA MINING RALLIES WITH SILVER... Over the last month I've shown two silver stocks that are benefiting from silver's move to a new twenty-two year high. The two stocks are Coeur D Alene Mines (CDE) and Pan American Silver (PAAS). Hecla Mining (HL) is another...
READ MORE
MEMBERS ONLY

SOFTER DOLLAR BOOSTS COMMODITY MARKETS -- GOLD AND GOLD STOCKS ARE TURNING UP -- SILVER OUTSHINES GOLD -- BUYING DOW DIAMONDS TO PLAY IT SAFER
by John Murphy,
Chief Technical Analyst, StockCharts.com
LOWER RATES WEAKEN ... Just a day after a report showing a big jump in sales of previously owned homes during February, we read today that new home sales tumbled 10%, which is the biggest drop in nine years. Personally, I think the latter number makes a lot more sense in...
READ MORE
MEMBERS ONLY

STRONG HOUSING NUMBERS BOOST HOMEBUILDERS -- HOME DEPOT BREAKS OUT -- AIRLINES AND TRUCKERS LEAD TRANSPORTS LOWER -- ENERGY SHARES RISE WITH CRUDE -- OVERBOUGHT MARKET SOFTENS
by John Murphy,
Chief Technical Analyst, StockCharts.com
KBH LEADS HOMEBUILDING GROUP HIGHER... Sales of existing homes rose strongly during February which is giving a much-needed boost to homebuilders. Three of the five top percentage gainers in the S&P 500 are homebuilding stocks. The biggest percentage gainer is KBH which is gaining 5%. [KBH also...
READ MORE
MEMBERS ONLY

BMY LEADS DRUG GROUP HIGHER -- HEALTHCARE ETFS CONTINUE TO GAIN -- WHY NEW DOW LEADERSHIP IS A CAUTION SIGN
by John Murphy,
Chief Technical Analyst, StockCharts.com
BMY GAPS UP ON BIG VOLUME ... News that Bristol Myers Squibb reached a settlement calling for delayed production of the generic version of the world's second largest drug pushed the stock 11% higher today and made it the day's strongest stock. Chart 1 shows BMY gapping...
READ MORE
MEMBERS ONLY

HOME DEPOT AND WAL MART BOOST RETAIL SECTOR -- SO DOES FALLING OIL PRICES -- NASDAQ FAILS TEST OF JANUARY HIGH -- PEPSI BOTTLING BREAKS OUT
by John Murphy,
Chief Technical Analyst, StockCharts.com
RETAIL HOLDERS RESOLVE BULLISH TRIANGLE ... Near the end of February, I wrote a positive piece on the retail sector (February 27, 2006). At the time the Retail Holders (RTH) were testing the upper line in a triangular-shaped pattern which favored an eventual move to the upside. Chart 1 shows...
READ MORE
MEMBERS ONLY
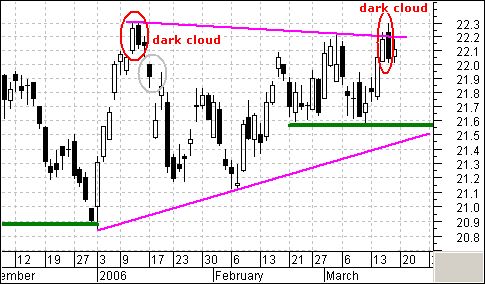
DARK CLOUDS FOR XLK
The dark cloud is a bearish candlestick reversal pattern made up of two candlesticks. The first is white and the second black. The open of the second is above the close of the first and the close of the second is below the mid point of the body of the...
READ MORE
MEMBERS ONLY
MARKET IS ST OVERBOUGHT AND AT RESISTANCE
Last week I wrote an article entitled Investors Intelligence Sentiment Helps Bulls in which I pointed out that sentiment had become very bearish, and that the market was more likely to rally than decline. Since then the market has enjoyed a short rally, but sentiment continues to be steadfastly bearish,...
READ MORE
MEMBERS ONLY
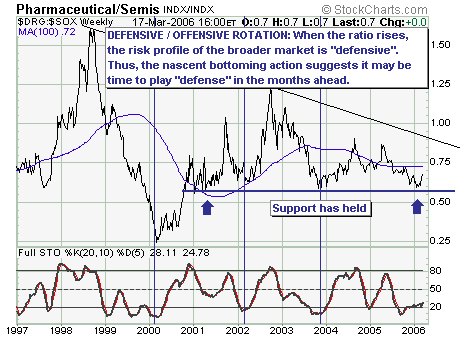
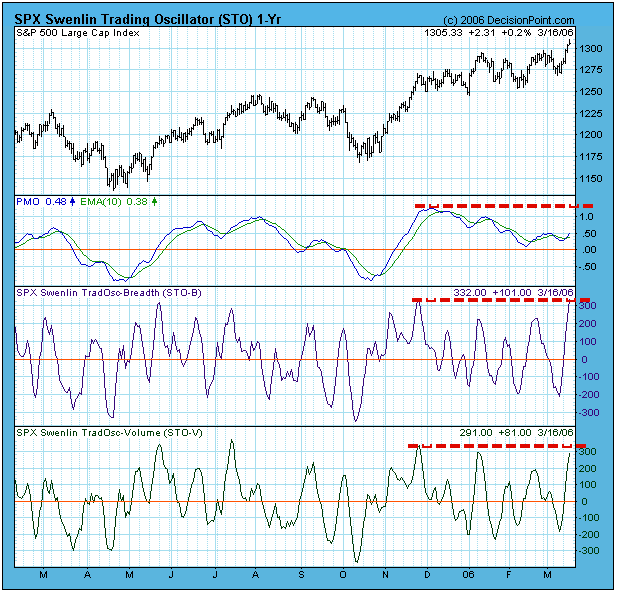
BROAD MARKETS TAKING "DEFENSE POSITIONS"
With the broad market indices such as the Dow Industrials and S&P 500 hitting new multi-year highs, one would reasonably believe that the advance has further to travel and riskier and riskier positions taken. However, when we look underneath the hood, we find rotation taking place towards...
READ MORE
MEMBERS ONLY
BOOKSTORE BEST SELLERS
TOP TEN BEST SELLERS- We maintain a list of the top ten best-selling products in our online store. Hint: they are best-sellers for a reason. Take a look....
READ MORE
MEMBERS ONLY
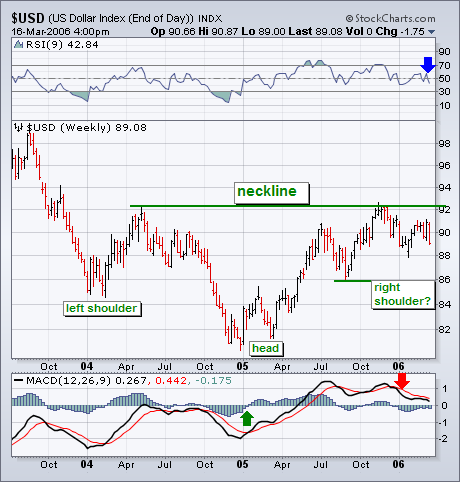
HEAD AND SHOULDERS DOLLAR BOTTOM?
It's possible that the current dollar pullback is part of a large basing pattern of the head and shoulders variety. A case can be made that the Dollar Index formed a left shoulder at the start of 2004 and a head at the start of 2005. The fourth...
READ MORE
MEMBERS ONLY

DOLLAR TURNS LOWER AS EURO AND YEN RISE -- A WEAKER DOLLAR WOULD BOOST COMMODITIES AND FOREIGN ETFS
by John Murphy,
Chief Technical Analyst, StockCharts.com
DOLLAR INDEX BREAKS 200-DAY AVERAGE ... The Dollar Index has taken a turn for the worst this past week. The daily bars in Chart 1 (through Thursday) show the USD falling below its March low and its 200-day moving average. The daily MACD lines are also in negative alignment....
READ MORE
MEMBERS ONLY

RAILS LEAD INDUSTRIALS SPDR TO RECORD HIGH -- GE CLEARS 200-DAY LINE
by John Murphy,
Chief Technical Analyst, StockCharts.com
INDUSTRIALS SPDR INCLUDED TRANSPORTS ... While the Dow Industrials have reached the highest level in four and half years, the Dow Transports are trading at a new record. In today's trading, the transports gained more than 2.0% and were the day's strongest group. In case you&...
READ MORE
MEMBERS ONLY

GOLDMAN SACHS PROFIT SPARKS STOCK BUYING -- FOREIGN STOCKS RESUME UPTREND WHILE S&P HITS NEW HIGH -- OVERSOLD COMMODITY STOCKS HAVE A GOOD DAY
by John Murphy,
Chief Technical Analyst, StockCharts.com
GOLDMAN SACHS SURGES TO RECORD HIGH... The big brokerage firm reported the biggest profit in the history of Wall Street. As a result, the stock gapped to a new high on very strong volume as shown in the daily bars in Chart 1. The monthly bars in Chart 2 are...
READ MORE
MEMBERS ONLY

RECENT BUYING OF CONSUMER STAPLES SUGGESTS A MORE DEFENSIVE MOOD -- THERE ARE SEVERAL WAYS TO PARTICIPATE -- CONUMER INDEX NEARS RECORD HIGH
by John Murphy,
Chief Technical Analyst, StockCharts.com
TWO DIFFERENT VIEWS ... Last week I wrote an article on sector rotations that suggested that consumer staples were now due to show market leadership. They were in fact the strongest sector last week. Chart 2 gives two views of the group. The black line is the S&P Consumer...
READ MORE
MEMBERS ONLY

THE US DOLLAR IS AN EXCELLENT TRENDING VEHICLE THAT CHARTS EXTREMELY WELL -- PROFUNDS OFFERS A COUPLE OF DOLLAR FUNDS FOR TRADING OR HEDGING PURPOSES
by John Murphy,
Chief Technical Analyst, StockCharts.com
LONG-TERM DOLLAR VIEW ... I've long maintained that currency markets represent a separate asset class that most investors don't participate in. Institutions can and do trade cash currencies through interbank arrangements. Futures and options traders can trade foreign currencies on the Chicago Mercantile Exchange or the...
READ MORE
MEMBERS ONLY

NEW DOW LEADERSHIP IS A SIGN OF MORE DEFENSIVE MARKET -- CONSUMER STAPLES BECOME NEW LEADERS AFTER ENERGY PEAKS -- CRB INDEX FALLS BELOW 200-DAY LINE
by John Murphy,
Chief Technical Analyst, StockCharts.com
STAPLES COME AFTER ENERGY ... In the latter stages of an economic expansion and and bull market in stocks, basic material and energy stocks take over market leadership. We've seen that over the last two years. Energy stocks are usually the last group to peak at a market top....
READ MORE
MEMBERS ONLY

LATIN AMERICA LEADS EMERGING MARKETS LOWER -- FALLING COMMODITIES ARE HURTING BOTH -- SOX SELLING PULLS DOWN ASIAN MARKETS AND THE NASDAQ
by John Murphy,
Chief Technical Analyst, StockCharts.com
RISING RATES HURT RISKIER MARKETS ... This week's upside breakout in U.S. bond yields, and prospects for more global tightening of short-term rates, takes a toll on riskier markets. That certainly includes emerging markets which are falling hard today with average losses of 3%. What's...
READ MORE
MEMBERS ONLY

TWENTY-ONE MONTH HIGH IN BOND YIELDS RATTLES MARKET -- ENERGY AND UTILITIES ARE DAY'S WEAKEST GROUPS ALONG WITH GOLD STOCKS --- TELECOM AND REITS ARE ONLY WINNERS -- S&P MAY TEST 2006 LOW
by John Murphy,
Chief Technical Analyst, StockCharts.com
BOND BREAKOUT ... Last Friday I showed the yield on the 10-year T-note testing its 2004 highs. It broke through those highs today. Chart 1 shows the TNX trading over 4.70% for the first time since the middle of 2004 (see red circle). That appears to leave little...
READ MORE
MEMBERS ONLY
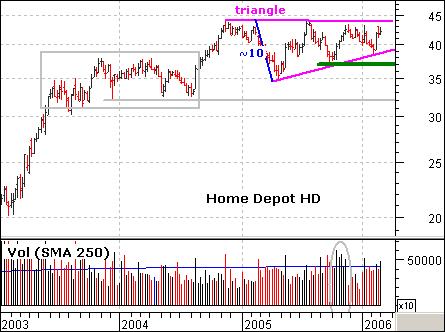
HOME DEPOT CONSOLIDATES WITH A MASSIVE TRIANGLE
HD is no stranger to long consolidations. The stock surged in 2003 and then consolidated for a year (gray box). The advance continued with a surge in 2004 and the stock consolidated over the last 12 months with a large triangle. The gains from 2003 and 2004 are largely holding...
READ MORE
MEMBERS ONLY

RYDEX CASH FLOW IS BEARISH
The Rydex Cash Flow Ratio*, which is shown on the first chart below, reflected a fair amount of bullish sentiment and peaked around the end of November. Since then it has been sliding down toward the bearish side of the range in spite of the fact that prices have been...
READ MORE
MEMBERS ONLY
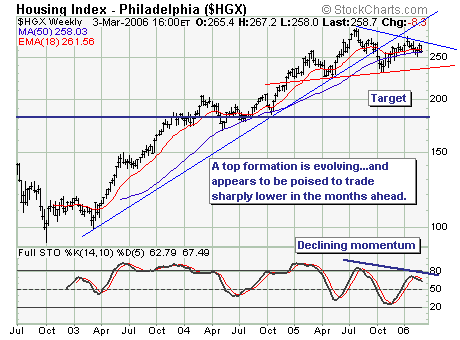
A LOOK AT THE HOUSING INDEX ($HGX)
Sometimes the best trade is the most obvious trade; and for us that is the "short housing" trade, or more succinctly...short the homebuilders. Interest rates moved sharply higher this week on the short-end as well as the long-end of the curve, and ht prospects are...
READ MORE
MEMBERS ONLY
SHARPCHARTS2 FOR FREE USERS
FREE USERS CONVERTED TO SHARPCHARTS2 - As mentioned above, we retired SharpCharts1 for Free Users last week. Be sure to click on the "Instructions" link for help with common pitfalls that ex-SharpCharts1 users are hitting when first starting to use SharpCharts2.
MORE SHARPCHARTS2 CONVERSIONS COMING SOON - Watch for...
READ MORE
MEMBERS ONLY
GLOBAL RATES ARE HEADING HIGHER
Yesterday's decision by the ECB to raise rates was pretty much expected. What wasn't expected was the hawkish comments that accompanied that rate increase with hints of more to come. The Japanese have been talking about doing the same and may do so before the month...
READ MORE
MEMBERS ONLY
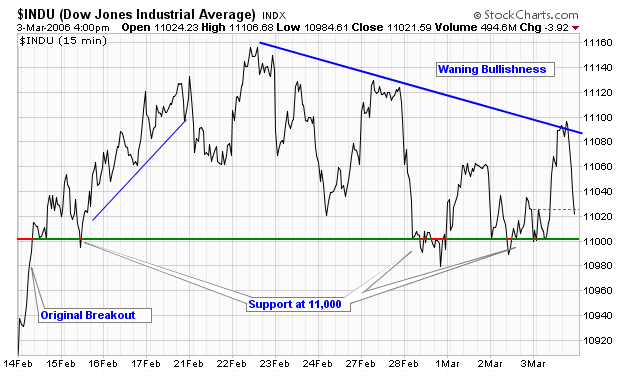
Hello Fellow ChartWatchers!
STRUGGLING WITH 11,000
The Dow continues to test the big breakout about 11,000 it had last month. Here's a chart of the recent action on a 15-minute scale which shows how the initial push has waned and how 11,000 is providing major support for...
READ MORE
MEMBERS ONLY

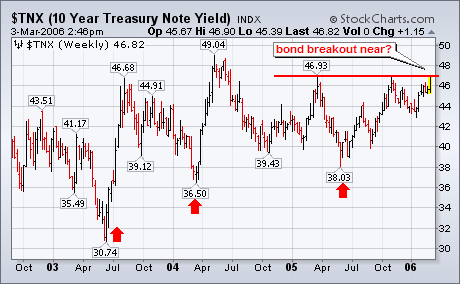
WHY GOLD CAN DO BETTER THAN GOLD STOCKS -- SILVER HITS 22-YEAR HIGH -- A COUPLE OF SILVER PLAYS -- ECB RAISES RATES, JAPAN IS NEXT -- YIELD ON 10-YEAR T-NOTE ON VERGE OF UPSIDE BREAKOUT
by John Murphy,
Chief Technical Analyst, StockCharts.com
WHY BULLION CAN LEAD GOLD STOCKS FOR A TIME... Earlier in the week I made the observation that, at the moment, bullion might be a better bet than gold stocks. Naturally, I got a lot of e-mail questioning that view. After all, I've written in the past...
READ MORE
MEMBERS ONLY

CISCO SCORES BULLISH BREAKOUT -- ALTERA AND TEXAS INSTRUMENTS LEAD STRONG SOX BOUNCE -- TAIWAN ETF REGAINS 50-DAY LINE
by John Murphy,
Chief Technical Analyst, StockCharts.com
CISCO BREAKS OUT ON BIG VOLUME ... Although most technology stocks rallied today, Cisco was the chart standout. Chart 1 shows why. The big networker broke through its summer 2005 highs and it's done so on sharply higher volume. That's a bullish combination. Its relative strength line...
READ MORE
