MEMBERS ONLY

EURO, YEN, AND DOLLAR DEVELOPMENTS

by John Murphy,
Chief Technical Analyst, StockCharts.com
ECB EXPECTED TO RAISE RATES... This Thursday we have an interest rate decision from the European Central Bank. It is widely expected that it will increase the European rate at that meeting. It's likely that the recent bounce in the Euro is in anticipation of that expected rate...
READ MORE
MEMBERS ONLY

GOOGLE LEADS MARKET INTO HIGHER VOLUME DECLINE -- NASDAQ 100 FALLS BACK BELOW 50-DAY AVERAGE -- HOUSING STOCKS STARTED TO FALL BEFORE THE BAD NEWS -- BULLION BOUNCES WHILE NEWMONT FALLS
by John Murphy,
Chief Technical Analyst, StockCharts.com
GOOGLE FALLS ON BIG VOLUME ... Today's market selloff can't be blamed entirely on Google. There were other factors at work as well. But the plunge in Google didn't help. A disappointing forecast sent the huge Internet stock plunging over $30 today on huge volume....
READ MORE
MEMBERS ONLY

LOWES LEADS RETAIL RALLY -- NASDAQ 100 TURNS UP WITH HELP FROM BIOTECH GROUP
by John Murphy,
Chief Technical Analyst, StockCharts.com
RETAIL HOLDERS TEST RESISTANCE LINE... In an article on Regional Banks Holders last Wednesday, I incorrectly used the symbol RTH instead of the correct RKH. I showed the right chart, but typed the wrong symbol. Maybe my subconscious mind was at work because today I'm writing about the...
READ MORE
MEMBERS ONLY

COMMODITIES BOUNCE AT WEEK'S END -- JAPANESE ISHARES REGAIN 50-DAY LINE -- BIOTECH BREAKOUT -- WHY I LIKE MACD LINES
by John Murphy,
Chief Technical Analyst, StockCharts.com
CRB INDEX STAYS OVER 200-DAY LINE... Earlier in the week we showed the Reuters/Jefferies CRB Index bouncing off its 200-day moving average. After dipping back on Thursday, it rallied again at week's end. Thirteen of the nineteen commodities in the CRB bounced on Friday with...
READ MORE
MEMBERS ONLY

BANK BREAKOUT LEADS MARKET HIGHER -- SOX BOUNCES OFF 50-DAY LINE -- THE QQQQS MAY BE READY TO TURN BACK UP
by John Murphy,
Chief Technical Analyst, StockCharts.com
BANK BREAKOUT ... Some good things happened to the market today. One of them was a bullish breakout in bank stocks. Earlier today I showed the Bank Regional Holders (RTH) hitting a new record high (February 22, 2006). They were the day's strongest ETF. Chart 1 shows the bullish...
READ MORE
MEMBERS ONLY

REGIONAL BANKS LEAD MARKET HIGHER -- FIFTH THIRD BANCORP IS PERCENTAGE LEADER -- CITIGROUP BOUNCES OFF 200-DAY LINE
by John Murphy,
Chief Technical Analyst, StockCharts.com
FINANCIALS ARE DAY'S STRONGEST SECTOR ... Judging from today's strong surge in the financial sector, it seems that the market is encouraged by the January core CPI inflation rate of 0.2% and less concerned about the threat of rising interest rates. That would explain today'...
READ MORE
MEMBERS ONLY

THE NYSE AD LINE VERSUS THE NYSE BULLISH PERCENT INDEX -- WHY TWO BIOTECH ETFS LOOK DIFFERENT -- FALLING SOX INDEX WEIGHS ON NASDAQ MARKET
by John Murphy,
Chief Technical Analyst, StockCharts.com
TWO WAYS TO MEASURE MARKET BREADTH... One of our readers asked me to explain the difference between the NYSE Advance-Decline line and the NYSE Bullish Percent Index. They both tell us something about market "breadth", but in different ways. Chart 1 shows the NYSE AD line which...
READ MORE
MEMBERS ONLY

OVERSOLD COMMODITIES ARE BOUNCING -- CRB INDEX TURNS UP AT 200-DAY AVERAGE
by John Murphy,
Chief Technical Analyst, StockCharts.com
CRB UPTREND IS STILL INTACT... It was in October of 2001 that the Reuters/Jefferies CRB Index started the four-year rally that continues to this day. During that period, we've seen steep rallies followed by downside corrections or periods of consolidation. Two things,however, have remained constant....
READ MORE
MEMBERS ONLY
DOW THEORY UPDATE
Two weeks ago, I reported waning upside momentum for the Dow Industrials and Dow Transports. In addition, I noted that a Dow Theory non-confirmation was brewing, but a Dow Theory sell signal had yet to register. The Dow Industrials and Dow Transports would both have to move below their...
READ MORE
MEMBERS ONLY
SHORT-TERM OVERBOUGHT
In my February 2 article I stated my belief that a medium-term correction is in progress because the PMM Percent Buy Index (PBI) has turned down and crossed down through its 32-EMA. The chart below shows this condition still exists, and I have not changed my mind at...
READ MORE
MEMBERS ONLY
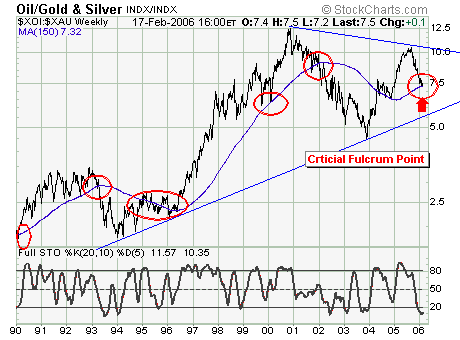
LOOKING AT OIL AND GOLD/SILVER INDEXES
For the longest time, crude oil and gold prices have dominated the news in terms of bullish commodities. We like to look at the ratio between the Integrated Oil and Gold/Silver Indexes ($XOI:$XAU) for a possible "pairs trade", and every few years we are accorded any...
READ MORE
MEMBERS ONLY
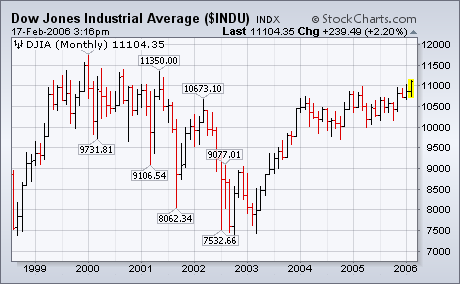
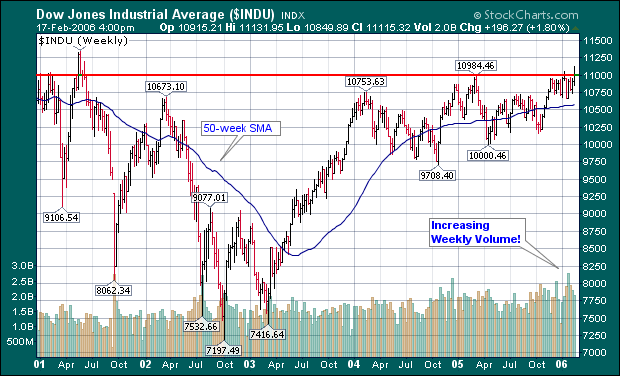
DOW HITS MULTI-YEAR HIGH
The Dow was the only one of the major averages to reach a new high this week. That continues its new upside leadership that I wrote about last week. With the Dow now above the 11K level, the next potential upside target is its 2001 high at 11350. One of...
READ MORE
MEMBERS ONLY
Hello Fellow ChartWatchers!
Stocks made a strong statement last week with the Dow Jones Industrials moving above the 11,000 mark decisively for the first time since June of 2001(!). The Dow flirted with 11,000 in March of last year and briefly broke thru 11,000 at the start of this year,...
READ MORE
MEMBERS ONLY

UTILITIES AND NATURAL GAS STOCKS BOUNCE OFF 200-DAY LINES -- BOND YIELD DIP BOOSTS EURO AND GOLD -- CANADA BOUNCES WHILE JAPAN DOESN'T -- NEW DOW LEADERSHIP
by John Murphy,
Chief Technical Analyst, StockCharts.com
KEYSPAN LEADS UTILITY BOUNCE ... Although utilities are usually thought of as being interest-rate sensitive, they're being heavily influenced by the trend of energy stocks -- and natural gas stocks in particular. Today is a good example of that. News that KeySpan, which is the largest natural gas seller...
READ MORE
MEMBERS ONLY

WHY I USE THE 50-DAY AVERAGE SO MUCH -- AN AWFUL LOT OF MARKETS ARE FINDING SUPPORT AT THAT LINE -- SOME ARE BOUNCING OFF 200-DAY LINES
by John Murphy,
Chief Technical Analyst, StockCharts.com
WHY I USE THEM ... As you know, I place a lot of importance on moving average lines. Not because they're infallible, because they're not. Or because they're the most important of all the indicators I look at. Because they're not. For people...
READ MORE
MEMBERS ONLY

BIOTECH ISHARES NEAR TEST OF 2004 HIGH -- IBB/S&P RELATIVE STRENGTH RATIO TESTS FIVE-YEAR DOWN TRENDLINE
by John Murphy,
Chief Technical Analyst, StockCharts.com
BIOTECH HOLDERS MOVE UP ... Over the last week, I've shown bullish breakouts in two telecom ETFs (TTH and IYZ) and the strong upturn in Retail Holders (RTH). The biotech group has moved into third place over the last week in the relative strength rankings. The weekly bars in...
READ MORE
MEMBERS ONLY

DOW CLOSES OVER 11K AS TRANSPORTS HIT RECORD -- FALLING OIL BOOSTS AIRLINES AND RETAILERS -- ANOTHER TELECOM BREAKOUT -- S&P 500 CLEARS 50-DAY LINE
by John Murphy,
Chief Technical Analyst, StockCharts.com
DOW CLOSES BACK OVER 11K... The Dow Industrials continue to show new market leadership. Today's strong close put it back over the 11,000 level for the first time since mid-January. The monthly bars in Chart 2 put that in better perspective. A Dow close over 11047...
READ MORE
MEMBERS ONLY

MARKET RALLIES ON CONTINUING DROP IN OIL PRICES AND BIG JUMP IN RETAIL SPENDING -- HOME DEPOT LEADS RETAIL GROUP HIGHER
by John Murphy,
Chief Technical Analyst, StockCharts.com
JANUARY RETAIL SPENDING JUMPS 2.3% ... The market is being helped by at least two factors today. One is the continuing drop in crude oil prices to the lowest level in 2006. While energy stocks are the day's weakest group, retailers are one of the day's...
READ MORE
MEMBERS ONLY

GOOGLE HEADS TOWARD 200-DAY LINE -- NASDAQ IS NOW PULLING MARKET LOWER -- JAPAN ETF BREAKS 50-DAY LINE -- CRB INDEX CONTINUES TO WEAKEN
by John Murphy,
Chief Technical Analyst, StockCharts.com
CRB INDEX BREAKS 50-DAY LINE ... The sharp slide in commodity markets that started last week continued into Monday trading. Today's four point loss has pushed the Reuters/Jefferies CRB Index to the lowest level for 2006. It broke its 50-day average on Friday and now appears...
READ MORE
MEMBERS ONLY

ENERGY AND METALS STOCKS REMAIN ON THE DEFENSIVE -- TELECOM CONTINUES BREAKOUT
by John Murphy,
Chief Technical Analyst, StockCharts.com
GOLD CONTINUES DOWNSIDE CORRECTION ... Gold stocks fell again on Friday to continue the downside correction that began late last week. The daily bars in Chart 1 show the Gold & Silver (XAU) Index heading down toward its 50-day day moving average. This week's downturn in the XAU...
READ MORE
MEMBERS ONLY

SUBTLE SHIFT OUT OF SMALLER STOCKS COULD BE AN EARLY SIGN OF A MARKET TOP -- THE SAME IS TRUE OF RECENT STABILITY IN THE DOW INDUSTRIALS
by John Murphy,
Chief Technical Analyst, StockCharts.com
SMALL CAPS ARE STARTING TO SLIP ... One of the more subtle changes that took place this past week was slippage in small cap stocks. The slippage wasn't substantial; nor has there been any serious chart damage done. But it's something that bears watching. That's...
READ MORE
MEMBERS ONLY

FOREIGN MARKETS ARE STILL HOLDING UP BETTER THAN THE US
by John Murphy,
Chief Technical Analyst, StockCharts.com
S&P 500 CLIMBS BACK OVER 50-DAY LINE -- FOREIGN ETFS ARE EVEN STRONGER ... Chart 1 shows the S&P 500 climbing back over its 50-day moving average in afternoon trading. That's a positive sign and suggests that the short-term decline of the last...
READ MORE
MEMBERS ONLY

TELECOM BREAKOUT -- PFIZER LEADS HEALTHCARE ETF HIGHER -- MONEY IS ALSO FLOWING INTO THE CHIPS
by John Murphy,
Chief Technical Analyst, StockCharts.com
TELECOM HOLDERS HIT 52-WEEK HIGH ... Here's a group that I seldom write about. The reason I'm writing about it now is that it's the strongest group in the market over the last week. Chart 1 tells the tale. Telecom Holders (TTH) have broken...
READ MORE
MEMBERS ONLY

HOMEBUILDERS PULL MARKET LOWER -- GOLD AND ENERGY SELLING ALSO WEAKENS MARKET
by John Murphy,
Chief Technical Analyst, StockCharts.com
HOUSING INDEX BREAKS 200-DAY LINE ... A bad earnings report from Toll Brothers (which hit a new 52-week low) made a bad situation worse for the homebuilding group. The five homebuilders in the S&P 500 suffered losses averaging 3.5% on the day. Each of the stocks...
READ MORE
MEMBERS ONLY

DROP IN ENERGY PRICES CAUSES PROFIT-TAKING IN ENERGY PATCH
by John Murphy,
Chief Technical Analyst, StockCharts.com
NATURAL GAS INDEX STALLS AT PREVIOUS PEAK... Last Thursday I showed the Natural Gas Index (XNG) pulling back from its late-September peak and suggested that it was leading an energy pullback. With natural gas prices falling to a six-month low, and crude down to the lowest level in...
READ MORE
MEMBERS ONLY

GOLD BEGINS DOWNSIDE CORRECTION AFTER GOLD STOCKS STALL AT MAJOR RESISTANCE
by John Murphy,
Chief Technical Analyst, StockCharts.com
XAU PULLS BACK FROM OLD HIGHS... Last Friday I issued a short-term warning on gold and gold stocks based primarily on Chart 1 which showed the Gold & Silver (XAU) Index up against major overhead resistance at its 1996 and 1987 highs near 155 (February 03, 2006). I suggested...
READ MORE
MEMBERS ONLY

START OF A NEW INFLATION ERA?
by John Murphy,
Chief Technical Analyst, StockCharts.com
EDITOR'S NOTE... Jeanette Schwarz Young contributed to this article. Ms. Young is a trader on the New York Board of Trade with special expertise on commodity markets. In the coming weeks, you can expect to see more joint articles from her and myself. - John Murphy
IT'S...
READ MORE
MEMBERS ONLY
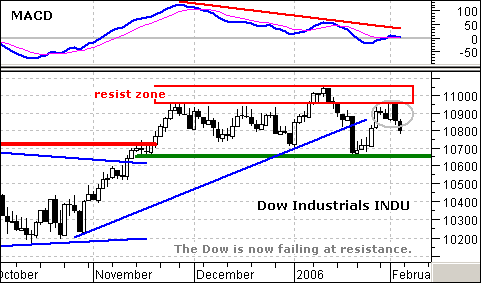
DOW THEORY NON-CONFIRMATION
The Dow is meeting staunch resistance around 11000, a level that turned the Average back in December and January. February is getting off to the same start with a big black candlestick on Thursday and 11500 remains the level to beat. In addition to a failure at resistance, MACD has...
READ MORE
MEMBERS ONLY
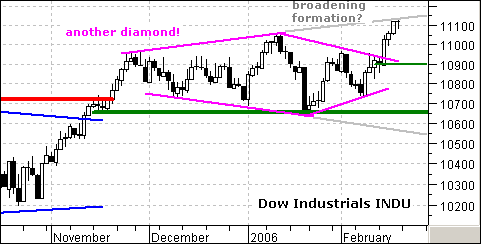
CORRECTION PHASE BEGINNING
With the market having formed numerous tantalizing tops since the end of November, perhaps the title of this article should say that a correction phase is finally beginning. And, considering all those previous false starts, why am I so sure that this time is the real thing? Well, I'...
READ MORE
MEMBERS ONLY
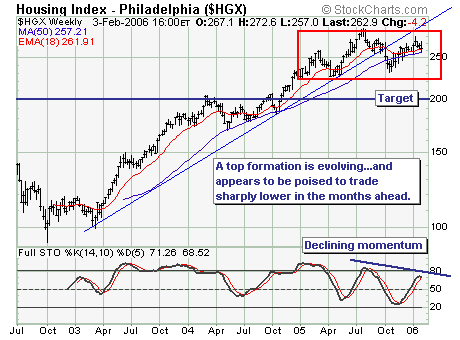
DECLINE IN HOUSING MARKET CONTINUES
The decline in the housing market is becoming more and more real; however, the housing index has yet to fully reflect the risk of the potential for still slower housing growth numbers. In some cases such as Ryland's (RYL), new home sales were recently below 2004 levels. Thus,...
READ MORE
MEMBERS ONLY
SHARPCHARTS2 BETA 7 "SHIPS"
NOTHING MUCH GOING ON - Yep, StockCharts.com is pretty quiet this week... Just Kidding! SharpCharts2 Beta 7 is out. Check out the article at the top of this newsletter for more details....
READ MORE
MEMBERS ONLY
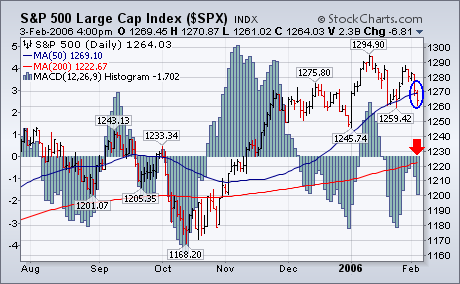
S&P 500 BREAKS ITS 50-DAY LINE
The chart below shows the S&P 500 closing the week below its 50-day moving average. That suggests a further drop toward 1245. The daily MACD histogram bars also paint a short-term negative picture. They stayed below the zero line and failed to confirm the previous week&...
READ MORE
MEMBERS ONLY
Hello Fellow ChartWatchers!
Have you tried SharpCharts2 yet? The reception for our new "Beta 7" version of SharpCharts2 has been incredible! More people have created more great looking SharpCharts2 charts in the past 3 days than ever before. And many of you have sent us lots of wonderful feedback about what...
READ MORE
MEMBERS ONLY

RISING WAGES FAN NEW INFLATION FEARS -- INTERNET STOCKS WEAKEN NASDAQ 100 -- S&P 500 BREAKS 50-DAY AVERAGE AS SHORT-TERM TREND WEAKENS
by John Murphy,
Chief Technical Analyst, StockCharts.com
AMAZON AND GOOGLE FALL HARD... It wasn't hard to see where most of the damage in the Nasdaq 100 came from today and the past week. Two of the biggest weekly losers were Amazon.com (-15%) and Google (-12%). The ugly chart damage can be seen in Charts...
READ MORE
MEMBERS ONLY

GOLD STOCKS ARE UP AGAINST LONG-TERM RESISTANCE -- USING THE PARABOLIC SAR ON GLD -- DISTINBUISHING BETWEEN CORE AND TRADING POSITIONS
by John Murphy,
Chief Technical Analyst, StockCharts.com
XAU INDEX REACHES MAJOR RESISTANCE ... Earlier in the week I showed a chart of Newmont Mining trading over its 1996 high at 60. [It's since dipped back below that level]. Chart 1 shows a long-term chart of the Gold & Silver (XAU) Index. And therein lies a...
READ MORE
MEMBERS ONLY

WHAT ARE INFLATION SENSITIVE STOCKS AND WHY HAVE THEY BEEN DOING SO WELL -- ROTATING FROM HOUSING TO COMMODITIES
by John Murphy,
Chief Technical Analyst, StockCharts.com
RESPONSE TO QUESTIONS ... I've made several references to the strong performance of inflation-sensitive stocks. Apparently, there are a lot of readers who don't know what they are. Inflation-sensitive stocks are those that are tied to rising commodity prices. The most obvious are gold (precious...
READ MORE
MEMBERS ONLY

DROP IN PRODUCTIVITY AND JUMP IN LABOR COSTS RAISES INFLATION CONCERNS -- RISING YIELDS HURT HOMEBUILDERS -- YIELD CURVE INVERTS AGAIN
by John Murphy,
Chief Technical Analyst, StockCharts.com
MARKET TURNS DEFENSIVE ... Two of the factors that have helped keep inflation under control are rising worker productivity and low labor costs. But that may now be changing. Fourth quarter worker productivity fell for the first time in five years. At the same time, labor costs rose for the first...
READ MORE
MEMBERS ONLY

ALUMINUM, GOLD, AND STEEL STOCKS LEAD BASIC MATERIALS TO NEW HIGH-- NEWMONT MINING HITS A NEW RECORD
by John Murphy,
Chief Technical Analyst, StockCharts.com
U.S. STEEL NEARS RECORD HIGH... Stocks tied to basic materials continue to gain ground on the back of the ongoing commodity rally. The Materials Select SPDR (XLB) was the only sector ETF to hit a new 52-week high today while most others fell. One of the day'...
READ MORE
MEMBERS ONLY

MATERIALS SECTOR RIDES COMMODITY WAVE -- SOX UPTURN AIDS BREAKOUT IN TAIWAN ETF -- YIELD CURVE STEEPENS AS BOND YIELDS JUMP -- DOLLAR BOUNCES OFF 200-DAY LINE
by John Murphy,
Chief Technical Analyst, StockCharts.com
MATERIALS ARE WEEK'S TOP SECTOR ... There's generally a pretty close correlation between the direction of commodity prices and basic material stocks that are tied to those commodities. I've suggested in the past that one way to participate in the commodity bull market is through...
READ MORE
MEMBERS ONLY

MARKET HAS STRONG DAY ON GOOD VOLUME -- LED BY CHIPS AND FINANCIALS -- JAPAN STABILIZES ABOVE 5O-DAY AVERAGE AS XAU HITS NEW HIGH
by John Murphy,
Chief Technical Analyst, StockCharts.com
S&P HOLDS 50-DAY LINE ... As you know, I've been expecting the S&P 500 to fall below its 50-day average. It dipped beneath it yesterday intra-day before closing just above it. Today it bounced off it pretty impressively. While that doesn'...
READ MORE
